CORS in Action: Creating and consuming cross-origin APIs (2015)
Part 3. Debugging CORS requests
The previous two parts of this book focused on how CORS works from both the client’s and the server’s perspective. Because there is both a client- and server-side component to CORS, there are many places where things can go wrong, and debugging these issues can be difficult.
Chapter 7 provides details on how to debug CORS requests. It starts by introducing you to the browser’s developer tools. These developer tools provide a lot of insightful information about CORS requests, including any CORS-related errors, and a view into the request and response headers. If the developer tools aren’t sufficient, the chapter looks at Wireshark, which is a tool that analyzes network traffic. Wireshark can help shed some light on why CORS requests are failing.
Next, the chapter looks at other tools that can be useful for debugging CORS requests, such as curl and test-cors.org. Then the chapter moves on to tips for debugging requests from mobile devices. Finally, the chapter covers where to go to get help on CORS-related issues.
Chapter 7. Debugging CORS requests
This chapter covers
· Using network sniffers like Wireshark to view network traffic
· Using curl to make an HTTP request
· Debugging requests from mobile devices
· Getting more help on CORS-related questions
Suppose that, using the guidance from the previous chapters, you now have a working CORS server with a web page that makes CORS requests. You fire up your server, visit your web page...and nothing happens. Now what?
Up until this point, we’ve focused on how to build a working CORS server implementation. But what happens when things go wrong? Over the course of developing any application, things inevitably go wrong and need to be debugged. You may be building a CORS server, and find that requests aren’t going through. Or you may be coding a client that talks to a CORS server, and find that the request is failing. Either way, you need to know how to figure out what is going wrong.
This chapter introduces tools that can be used to debug CORS requests. It starts by introducing features of the Chrome Debugger Tool. Next it looks at how to monitor request and response headers using Wireshark. Then it turns to using curl and test-cors.org to make CORS requests. It ends with resources where you can find answers to your CORS questions.
7.1. Solving CORS errors
With all the platforms, libraries, and frameworks out there, it can be daunting to know where to start debugging CORS requests. But regardless of whether you’re using ASP.NET running on Mono or Tomcat running on Linux, debugging CORS comes down to one thing: isolating and analyzing the HTTP headers. The server and client communicate using HTTP headers, and most CORS errors indicate a mismatch between the client request headers and the server response headers.
Regardless of what tools you use to solve the issue, the steps to solving CORS errors are the same (see figure 7.1):
Figure 7.1. Three steps to fixing CORS errors

1. Capture a snapshot of the request and response headers
2. Compare the headers to see if and where there is a mismatch
3. Fix the issue by either
1. Updating the client to send the correct headers
2. Updating the server to allow the client headers
The rest of this chapter will explore tools you can use to capture and view the HTTP headers. But first, let’s create a request you can test against. To understand how to debug broken requests, you need to break a request. The code from chapter 6 introduced configuration options that can be used to configure how a CORS-enabled server behaves. The following listing modifies the configuration options in a way that breaks the client.
Listing 7.1. Configuring the CORS server to only allow the Timezone-Offset header
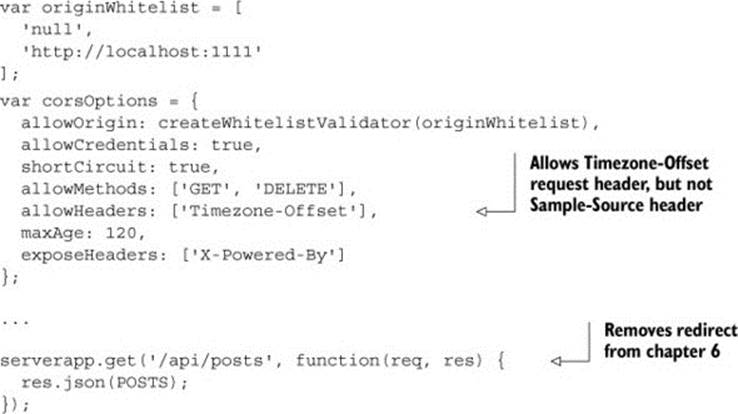
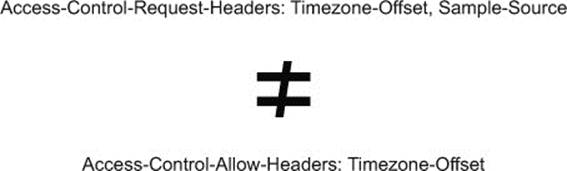
These configuration options are essentially the same as those from the previous chapter, but with one critical difference. This code only allows the Timezone-Offset request header, even though the client is configured to send both the Timezone-Offset and the Sample-Source request headers. This means that the preflight request will fail, because the Access-Control-Allow-Headers response header won’t match the Access-Control-Request-Headers request header (figure 7.2).
Figure 7.2. The CORS request fails because the Access-Control-Request-Headers doesn’t match the Access-Control-Allow-Headers header.
The fix to this error is as easy as adding the Sample-Source header to the allowHeaders array. But even though you know how to fix this, set this knowledge aside and forget about it for a while. The rest of this chapter will approach this sample as if you were debugging an unknown error, and will walk through the tools that can be used to debug the request.
7.2. Using the browser’s developer tools
If you restart the sample server and visit the client page, you’ll be greeted with the error page rather than the blog posts. To figure out what went wrong, let’s start by inspecting the error using your browser’s developer tools.
All modern browsers have a suite of developer tools, which are in-browser panels that can help a web developer catch and diagnose issues with a site. The following sidebar explains how to find the developer tools in various browsers.
Finding your browser’s developer tools
All modern browsers contain a suite of developer tools. While all developer tools perform the same functions, they can be found in different places depending on which browser you use. Here is a breakdown of how to find the developer tools in each browser.
· Chrome— Choose the Chrome menu at the top-right of your browser window, then choose Tools > Developer Tools. Or press F12 or Ctrl + Shift + I (or Cmd + Opt + I on a Mac). For more information, see https://developers.google.com/chrome-developer-tools/.
· Firefox— Choose the Tools menu, then choose Web Developer > Toggle Tools. Or press F12 or Ctrl + Shift + I (or Cmd + Opt + I on a Mac). For more information, see https://developer.mozilla.org/en-US/docs/Tools.
· Internet Explorer— Internet Explorer’s developer suite is called F12 because you can launch the developer tools by pressing F12. For more information, see http://msdn.microsoft.com/library/ie/bg182326(v=vs.85).
· Opera— Opera’s developer suite is called Dragonfly and it can be found by choosing the Tools menu, then Advanced > Opera Dragonfly. Or press Ctrl + Shift + I (Cmd + Opt + I on a Mac). For more information, see http://www.opera.com/dragonfly/.
· Safari— To use Safari’s developer tools, you must first enable the feature by clicking Show Develop Menu in the Menu Bar found in Safari’s preferences under the Advanced pane. This will show a Develop menu in the toolbar. Next, choose Develop > Show Web Inspector. Or press Cmd + Opt + I after enabling the Develop menu. For more information, see https://developer.apple.com/safari/tools/.
The developer tools contain many different features, including:
· Console— Logs errors and other useful messages, and enables developers to interactively execute JavaScript on a page.
· JavaScript debugger— Allows the developer to set breakpoints and trace through JavaScript code.
· Network monitor— Logs the request and responses for all network traffic. Can be filtered by resource type.
· DOM inspector— Enables the developer to view the DOM associated with elements on the page.
· Profiler— Tracks the performance of actions on the site, and enables the developer to uncover performance bottlenecks.
When debugging CORS requests, we’ll focus on two features in particular: the console and the network monitor. The examples from the rest of this chapter will use Chrome, but the developer tools from any browser can perform the same functions. Let’s see how you can use these tools to debug CORS requests.
7.2.1. Using the console
The console can be found in the developer tools and under the Console tab (if it isn’t already selected). The console serves two purposes:
· It logs any messages or errors that occur while a site loads and runs.
· It allows you to enter JavaScript commands that can be run against the page.
The console is the first place to check when something on the page goes wrong. With that in mind, if you reload the sample client, the error from figure 7.3 should appear.
Figure 7.3. Error message from the missing request header
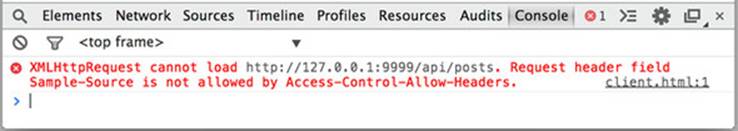
The text of the error message may differ from browser to browser. Chrome and Safari happen to give very detailed error messages for CORS errors. In the message from figure 7.3, you can see exactly what is wrong: “Request header field Sample-Source isn’t allowed by Access-Control-Allow-Headers.”
The console also lets you run JavaScript commands from the page. If you made changes to the server, you could reissue the CORS request without reloading the page by calling the getBlogPosts function directly. To do this, typegetBlogPosts() in the console window and press Enter. Because the request will still fail, you’ll see the same error message as in figure 7.3.
So, the console tells you what the error is, but not much more. To debug this request further, you need to look at the HTTP request itself. This can be done from the Network tab.
7.2.2. Using the Network tab
The Network tab shows the HTTP requests and responses from a page, as shown in figure 7.4. This includes requests for CSS style sheets, JavaScript files, images, fonts, WebSockets, and any HTTP requests triggered fromXMLHttpRequests.
Figure 7.4. The Network tab in Chrome’s developer tools
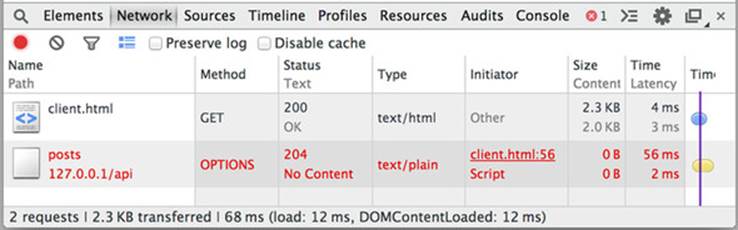
The Network tab for the sample shows two requests:
· The client.html page itself
· The CORS request to load the blog posts
The request to load the blog posts, shown in the bottom row, is a failing request.
The Network tab also provides additional information about the request, also shown in figure 7.4. This includes information such as the HTTP method, the HTTP status, the content type of the request, the location on the page that initiated the request, the size of the response, and the time it takes to load the response.
Right clicking a column can configure the view to show and hide additional bits of information. There are two additional columns that are hidden by default, but can be useful when debugging CORS requests. The Remote Address column indicates the server the request is going to, and can be useful for identifying cross-origin requests; the Vary column indicates the value of the Vary header (as you learned in chapter 6, the Vary header indicates which header values should be taken into account when calculating caching resources).
Clicking the request reveals even more detailed information, such as the request and response headers, as shown in figure 7.5. When debugging CORS requests, it’s important to pay special attention to any CORS-specific headers, such as the Origin header and any header prefixed with Access-Control.
Figure 7.5. Viewing the request and response headers for the failing request
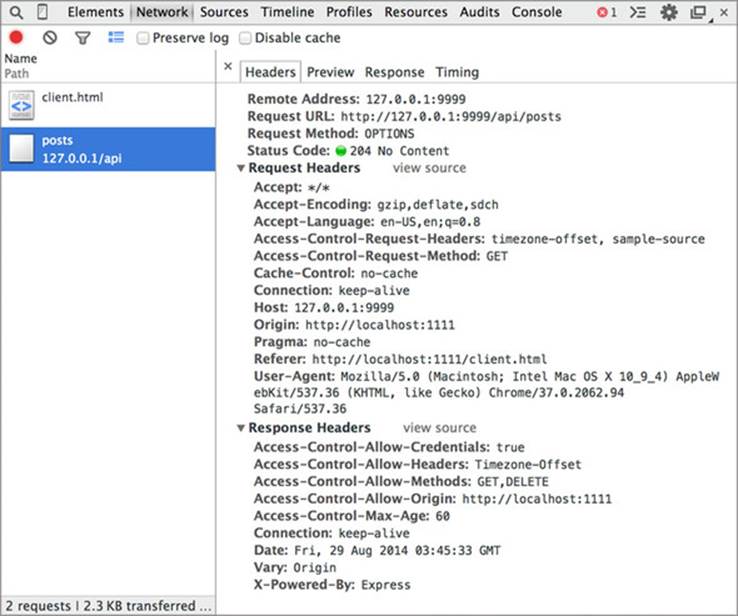
The Network tab provides more insight into why the request is failing. The HTTP method is OPTIONS, which means that the preflight request is failing. Because the preflight request fails, the actual request is never issued. This is verified by the fact that you don’t see a second GET request to load the blog posts. By inspecting the HTTP headers, you can see that although the request has an Access-Control-Request-Headers: timezone-offset, sample-source header, the server responds with Access-Control-Allow-Headers: Timezone-Offset, and is missing the Sample-Source header.
Now that we’ve diagnosed the root cause of this issue, there are a few ways to proceed. If the request header is expected and valid, the server configuration can be updated to allow the request header. But this only works if you have control over the server configuration (as you do in this sample). If you’re making requests against a server you don’t have control over (for example, if you’re querying a third-party API built by a different company), your options are more limited. You can remove the Sample-Source header from the client. That is easy in this particular case, because the Sample-Source header doesn’t do anything. But if the request header is important to the request, you may need to reach out to the server owner and ask them to allow your particular header. Table 7.1 explores ways to fix this issue.
Table 7.1. CORS issue can either be fixed in the client code or the server code
|
In the client code |
In the server code |
|
xhr.setRequestHeader( |
var corsOptions = { |
|
Remove the disallowed header from the request |
Add the failing header to the allowHeaders whitelist (only works if you can change the server code) |
The console log message coupled with inspecting and comparing the HTTP request and response headers is usually sufficient to diagnose most CORS issues. But there are times when the developer tools don’t tell the whole story. If you issue a simple cross-origin GET request that fails, Chrome’s developer tools will hide the response headers. The response headers are hidden because of the browser’s policy of hiding any information that the server hasn’t opted in to. This also makes it hard to debug cross-origin requests. The next section looks at how to use a network sniffer like Wireshark to view the HTTP request and response headers.
7.3. Monitoring network traffic
Sometimes Chrome developer tools won’t show all the HTTP header information. To see this in action, let’s once again break the sample code, but in a different way. The following code snippet removes the Timezone-Offset and Sample-Source custom request headers from the client.html file:
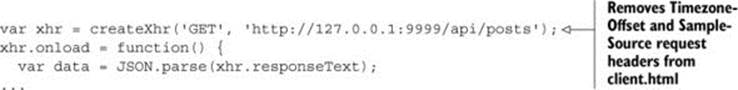
Next, the app.js server code is updated to remove the client http://localhost:1111 from the whitelist:
![]()
This essentially means that the client won’t be able to make requests, because there won’t be an Access-Control-Allow-Origin header in the response. If you restart the sample and reload the page, you’ll once again see an error, but there will be some slight differences.
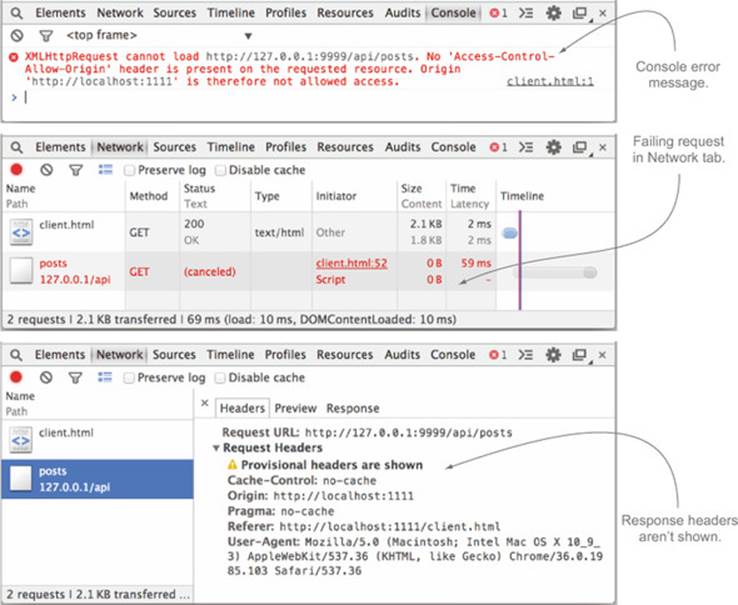
Figure 7.6 shows the Console and Network tabs for the request to /api/posts. The request still fails, but this time the failure is on the actual GET request, because there is no preflight request. (Remember there is no preflight request because you removed the custom request headers from the request.) The HTTP status is labeled as (canceled). Clicking the request itself shows that while you can see the request headers, the response headers are missing and there is an error that says “CAUTION: Provisional headers are shown.” This error means that the response headers are unavailable. In this particular case, because the CORS request fails, the browser follows the conservative route and hides any response information, even though an HTTP response was sent to the server.
Figure 7.6. Console and Network tabs for a failing request to /api/posts
Even though Chrome won’t display the response headers, there are other options available. You could always try a different browser. Browsers such as Internet Explorer and Firefox will display the response headers (although it’s possible that they could change this behavior in the future).
Another option is to use a packet analyzer, such as Wireshark or Fiddler. Packet analyzers show all the network traffic flowing through your system, including the cross-origin request from the browser. The rest of this section explores how to use Wireshark or Fiddler to capture and view network traffic.
7.3.1. Using Wireshark
Wireshark is a tool that monitors and logs all network traffic passing through your computer. The network traffic isn’t limited to HTTP requests, but it includes all network traffic, including TCP and UDP traffic. Wireshark fits under the general category of tools called packet analyzers. But what makes it appealing is that it’s an open source tool that runs on most platforms (including Windows, Mac, and Linux). Wireshark can be downloaded from http://wireshark.org. Appendix B goes into more details on how to download and install Wireshark.
Note
While this section focuses on Wireshark, you don’t need to use it to obtain network data. Any packet analyzer will do. Other popular tools with network monitoring support include Fiddler and Charles.
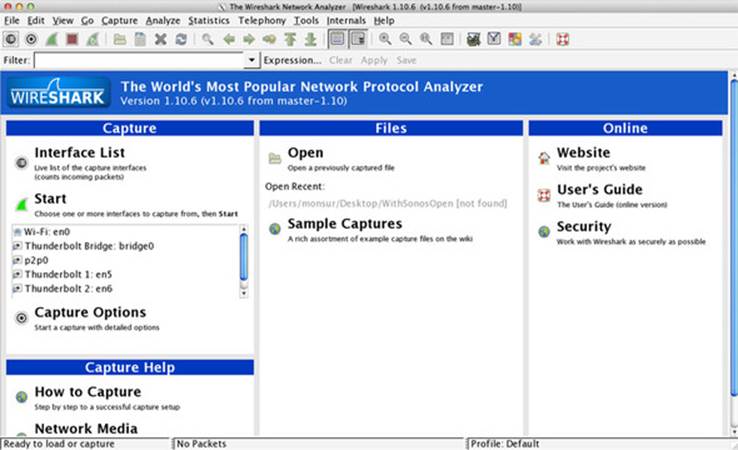
Wireshark is a rich app with many features, so we’ll focus on the features you can use to debug CORS requests. When you first fire up Wireshark, you’re greeted with a starting page similar to figure 7.7.
Figure 7.7. Wireshark startup screen
Tip
It might be a good idea to close all open tabs and any other sources of network traffic while Wireshark is running. This will make it easier to find your CORS requests among all the other network chatter.
This screen offers a lot of choices, but we’re going to focus on starting a network capture. To initiate a network capture, choose your network interface and click Start. The network interface is the interface through which network requests are made. Choosing the right network interface can be tricky. If you’re making requests to the outside world, you should choose the interface you’re connected with, such as Wi-Fi. But if you’re following along with the sample code, you should select the “loopback” interface, because the sample is making a request from your computer to your computer.
Note
Windows users may have issues with this step. If you’re on Windows, you can skip ahead to the next section, which covers Fiddler, a packet analyzer for Windows.
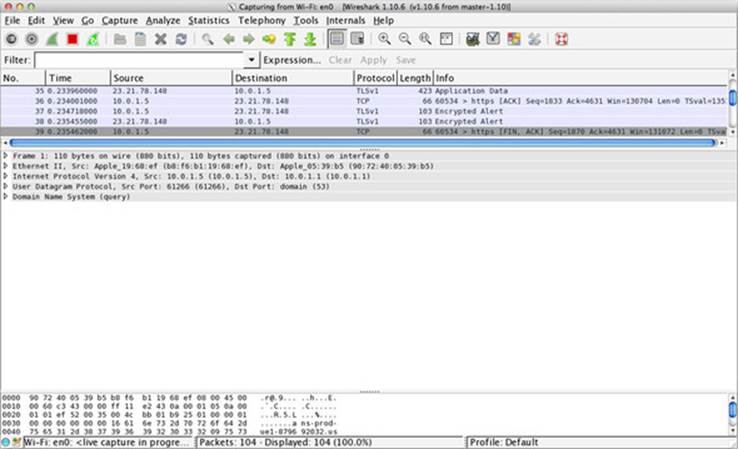
Once the network capture has started, Wireshark switches to the view in figure 7.8. Wireshark is now monitoring and logging all the network traffic passing through your computer. Each line in the log is a network request or response. Don’t worry about making sense of this output at the moment; you’ll learn how to filter the data to find what you’re looking for.
Figure 7.8. Wireshark capturing network traffic
Now that the network capture has started, you need to trigger a CORS request so that it can be logged. You can do this by reloading the page at http://localhost:1111/client.html. Reloading the page will trigger an HTTP request to your server. Once the page has reloaded, you can stop the capture in Wireshark by clicking Stop.
The CORS request is logged somewhere in the network capture log, but finding it can be like spotting a needle in a haystack. Luckily Wireshark provides a rich filtering language to help narrow down the entries in the log. A simple way to find the CORS request is to filter the network log by HTTP requests. This is as simple as typing http in the filter box. Figure 7.9 shows the results of filtering by HTTP requests. You can clearly see both the request and response for the client.html page and the /api/posts pages.
Figure 7.9. Filtering Wireshark’s display to only show HTTP requests and responses
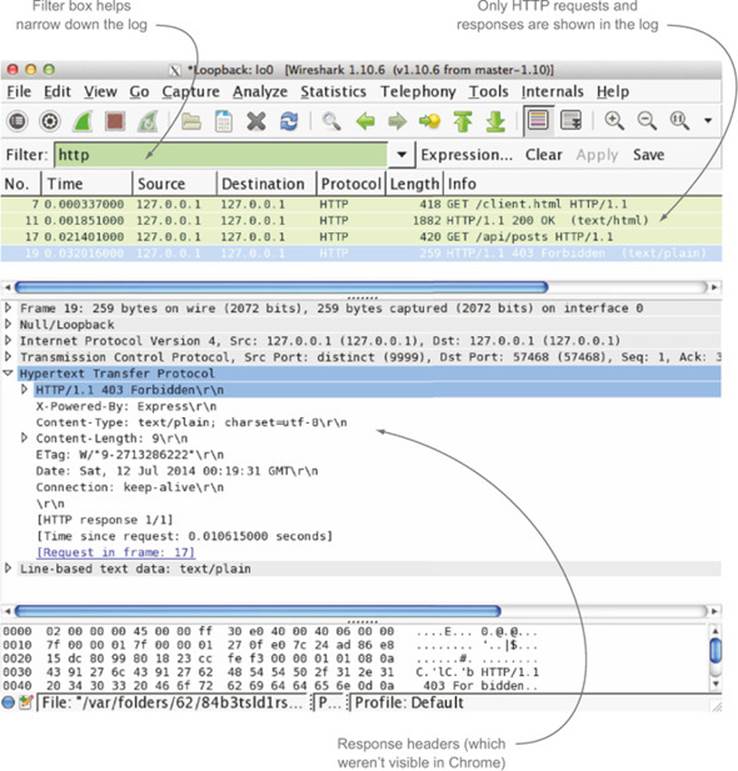
Notice that unlike in Chrome’s developer tools, you can see the response to the /api/posts request. Clicking each log item will show more details about the request, including the headers. If you click the response to the /api/posts requests, you can see that although the request has an Origin header, the response doesn’t have an Access-Control-Allow-Origin header, and therefore the request fails. Figure 7.10 shows the discrepancy in the headers.
Figure 7.10. CORS request and response to /api/posts
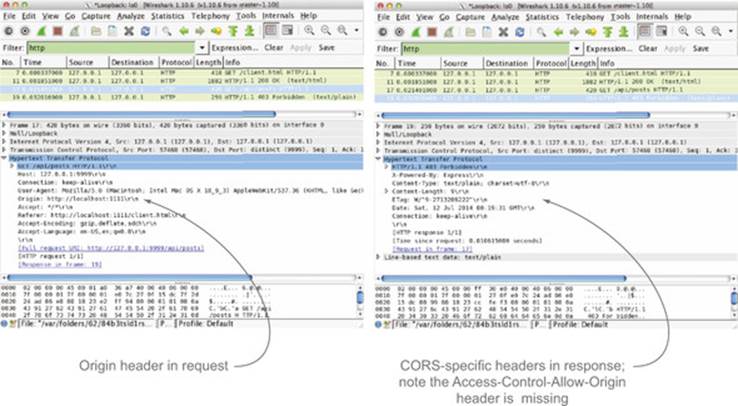
Wireshark is useful for digging into HTTP requests when the browser doesn’t provide the information you need. This is often the case when making simple GET or POST requests that don’t have a preflight request.
7.3.2. Using Fiddler
Fiddler is another packet analyzer. It is easier to use than Wireshark, but it’s available only on Windows. In addition to network analysis, Fiddler supports a lot of other features, such as web debugging, web session manipulation, performance testing, and security testing. But for the purposes of debugging CORS requests, we’ll focus on the network analysis.
Fiddler is a free tool, and it can be downloaded from www.telerik.com/fiddler. If you’d like to follow along with this example, install and run Fiddler (see appendix B for installation details).
Note
When opening Fiddler, Windows 8 users may see a popup referring to AppContainer. It’s safe to ignore this message. Go ahead and click either No or Cancel.
From the moment you open Fiddler it starts recording network traffic. If you go back to your browser and navigate to http://localhost:1111/client.html, you’ll see the requests appear in Fiddler, as shown in figure 7.11.
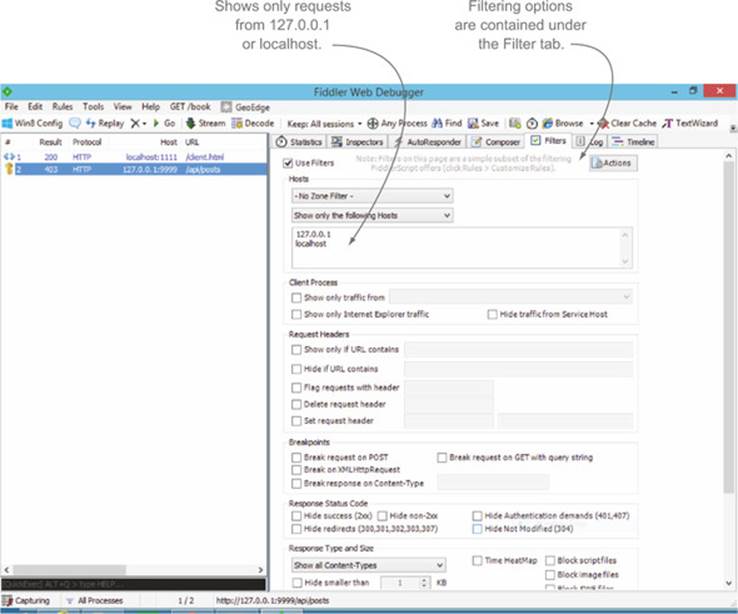
Figure 7.11. Viewing network traffic in Fiddler
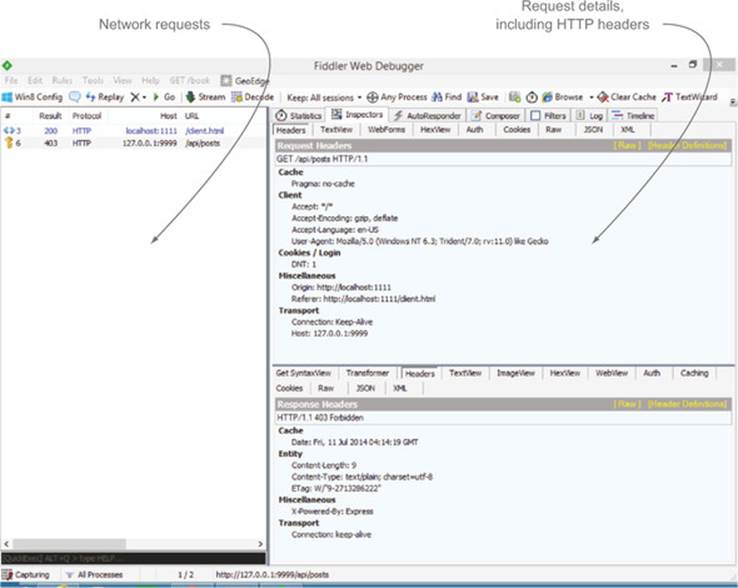
The left pane records each request, and includes such details as the protocol, response status, host, and URL. You should see the requests to both client.html and /api/posts in the left pane. Selecting the /api/posts request opens up more details in the right pane, such as the request headers, response headers, response body, and cookie details. Selecting the Inspector tab, followed by the Headers tabs (there should be two Headers tabs, one for requests and one for responses), will show you the request and response headers. In figure 7.11, you can see that while the request has an Origin header, the response doesn’t have the corresponding Access-Control-Allow-Origin header.
If you have other browser windows open, you may notice the left pane fills up with requests pretty quickly. Fiddler allows you to filter requests so you can only focus on those requests that matter to you. Figure 7.12 shows how to use the Filter tab to limit requests to only those from localhost or 127.0.0.1. As you can see from the figure, there are myriad other ways to filter requests.
Figure 7.12. Filtering requests in Fiddler
This section only scratches the surface of what Fiddler can do. If you’re using Windows, Fiddler is a simple, yet powerful tool for analyzing network traffic. This section covered tools for monitoring network traffic. But when testing CORS requests, it can also be useful to trigger various types of requests. Next, let’s look at how to initiate CORS requests using curl.
7.4. Using curl to simulate CORS requests
When building a new CORS implementation, it’s often useful to craft HTTP requests to the server and observe the results. One way to do this is to create a web page with an XMLHttpRequest that performs exactly the request you need. While this works, it can grow tedious to edit an HTML page, refresh it in the browser, then check the results in the developer tools. Curl is a command-line tool that lets you craft HTTP requests to the server and view the results. Let’s look at how you can use curl to make requests to the sample server.
7.4.1. Making CORS requests using curl
Curl comes preinstalled on most Linux and Mac systems, but you’ll have to download it for Windows (appendix B goes into detail on how to install curl). You can see if you have curl installed on your computer by typing curl --version. If this returns an error, you’ll need to install curl from http://curl.haxx.se/.
Note
Some versions of Window’s Powershell already have an alias to curl that points to the Invoke-Webrequest cmdlet. If typing curl --version returns an error about “Bad Gateway,” you’re using the wrong curl. You can work around this issue by installing and using the curl tool from http://curl.haxx.se/.
Curl can be used to send HTTP requests to servers. Let’s start with a simple example. The following command can be used to send an HTTP request to Google:
curl http://www.google.com
If you type in this command, it will return the HTML response from Google.com. Next, let’s turn this curl request on the sample server. The following command hits the sample blogging API:
curl http://127.0.0.1:9999/api/posts
If you run this command, you’ll receive the response Forbidden. While the request was sent to the server, this message doesn’t shed any insight into what is wrong, especially because there aren’t HTTP headers in the response. Curl’s --verbose option can be used to display the request and response headers. To view the HTTP headers, add the --verbose option to the curl request:
curl --verbose http://127.0.0.1:9999/api/posts
This command will not only print Forbidden, but also the request and response headers, as shown in figure 7.13.
Figure 7.13. Request and response headers from the curl command
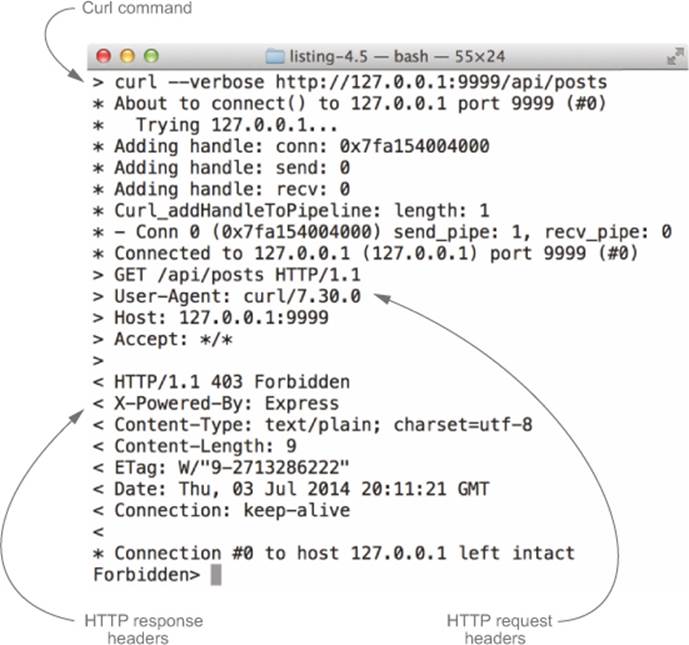
The request headers are prefixed with >, while the response headers are prefixed with <. Looking at the response headers, you can clearly see that the Access-Control-Allow-Origin header is missing.
If you look closely at the request headers, you can also see that the Origin header is missing. The browser automatically adds the Origin header. When using curl, you need to manually add the Origin header. You can set headers on curl requests by using the -H flag, as shown in the following code snippet. If you wanted to mimic a request from the sample client, you could set the Origin as follows:
curl --verbose -H "Origin: http://localhost:1111" http://127.0.0.1:9999/api/posts
Setting the Origin header is useful when you want to test an Origin but don’t want to host a page on that origin. For example, the preceding command tested a request from http://localhost:1111 without having to upload and run code on the actual http://localhost:1111 site. The following command changes the Origin to a null value to mimic a request from a file:
curl --verbose -H "Origin: null" http://127.0.0.1:9999/api/posts
If you run this command, you’ll see an Access-Control-Allow-Origin header in the response. This is because the null value is in the origin whitelist. The -H command can be used to add any request header. If you want to mimic a request from Firefox, you could add Firefox’s User-Agent header to the request.
Debugging CORS requests is all about comparing the request headers to the response headers. The actual body of the response isn’t too important, and it can get in the way of the header information (especially when a response has a ton of text that pushes the headers off the screen). The response body can be hidden by redirecting it to a different location. The command to do this on Windows is
curl --verbose -H "Origin: null" http://127.0.0.1:9999/api/posts > NUL
The same command on Mac/Linux looks like this:
curl --verbose -H "Origin: null" http://127.0.0.1:9999/api/posts > /dev/null
Using this syntax makes the output easier to read. Now that you have a basic understanding of how curl works, let’s take a look at how to use curl to mimic a preflight request.
7.4.2. Making preflight requests using curl
Curl can also be used to send preflight requests. Figure 7.14 (introduced in chapter 4 as figure 4.9) highlights the characteristics of a preflight request.
Figure 7.14. The pieces of a preflight request
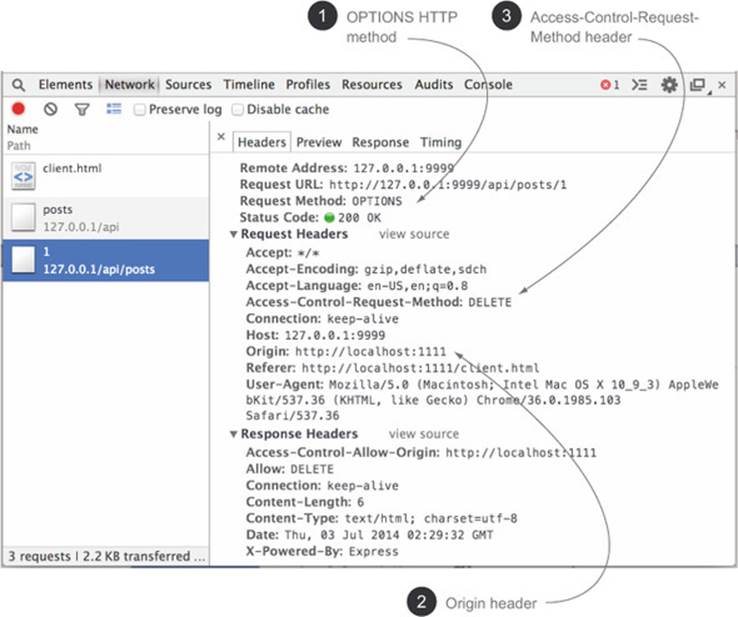
A preflight request will have an OPTIONS HTTP method ![]() , an Origin header
, an Origin header ![]() , and an Access-Control-Request-Method header
, and an Access-Control-Request-Method header ![]() . To mimic a preflight request using curl, you need to mimic these three characteristics.
. To mimic a preflight request using curl, you need to mimic these three characteristics.
The previous section showed you how to add an Origin header to the curl request. The -H flag can also be used to add an Access-Control-Request-Method header to the request. Finally, the -X flag can be used to set the HTTP method. The final curl request looks like this:
curl --verbose -H "Origin: null" -H "Access-Control-Request-Method: GET" -X OPTIONS http://127.0.0.1:9999/api/posts
After running this command, the server will reply with the preflight response.
7.4.3. Why use curl?
There are reasons why using curl can be advantageous over making requests from a web page, including:
· Developer velocity
· Request flexibility
· Ease-of-use
· Isolation
Let’s delve further into what each of these items mean.
Developer velocity
Developer velocity is the speed at which you can iterate and develop your app. Tools with high developer velocity enable you to work faster.
The traditional development process for CORS is to edit code, reload the web page, and view the headers in either the developer tools or Wireshark. Curl can speed up this process because making a curl request and viewing the headers can all be done in the same window.
If you have a complicated web app, there may be additional pieces of the page that need to load, or you may need to click a button to trigger the CORS request. Another way in which curl speeds development is that it focuses solely on the HTTP request, and doesn’t need to load any of those extraneous pieces.
Request flexibility
Curl is flexible enough to craft any type of HTTP request you can imagine. You can do things with curl that you can’t do from a web page.
Suppose you want to test your server’s behavior with requests from different origins. To do this from a browser, you’d need to upload your client code to each site that you want to test, which is cumbersome. With curl, you have the flexibility to set the Origin header (and any other header) to any value you need.
Ease-of-use
Curl’s ease-of-use was demonstrated earlier when you learned how to trigger a preflight request from CORS. Triggering the same preflight request from JavaScript code can be a little more difficult, because you have to build the actual request, then rely on the browser to send the correct preflight. In curl, you don’t need to jump through hoops to trigger a preflight.
Note
Chrome and Firefox’s Network tab include a Copy as cURL option when you right-click a request. This allows you to copy a request from the browser as a curl command you can run from the command line. This makes curl even easier to use.
Isolation
Perhaps most importantly, curl provides isolation. When you make a request from JavaScript code, there are places where things can go wrong. The developer’s JavaScript code may have a bug in it, or your assumptions of which headers the browser is adding may be different from what the browser is doing.
With curl, what you see on the command line is exactly what is sent to the server. If you have an error in your code, but the curl request works just fine, you know there is something wrong in your code. If you have an error in your code and the curl request fails, you know the issue is somewhere on your server.
7.5. Sending requests using test-cors.org
Full disclosure: I am the creator and maintainer of test-cors.org. I built the site because I found it difficult to find information on how CORS requests behave in actual browsers. The test-cors.org site offers four features for testing CORS requests:
· A curl-like interface to send CORS requests to a remote server. This can be useful for testing actual CORS requests from a browser against your server.
· A mechanism for configuring a server’s response, then testing a request against this response. This can be useful if you want to learn how server and client settings interact.
· A mechanism to view events in an XMLHttpRequest’s lifecycle.
· A mechanism to get the JavaScript code for the request you’re testing. These last two features are useful for client-side CORS users as well.
When you first visit test-cors.org, you’re greeted with the page in figure 7.15.
Figure 7.15. The test-cors.org landing page
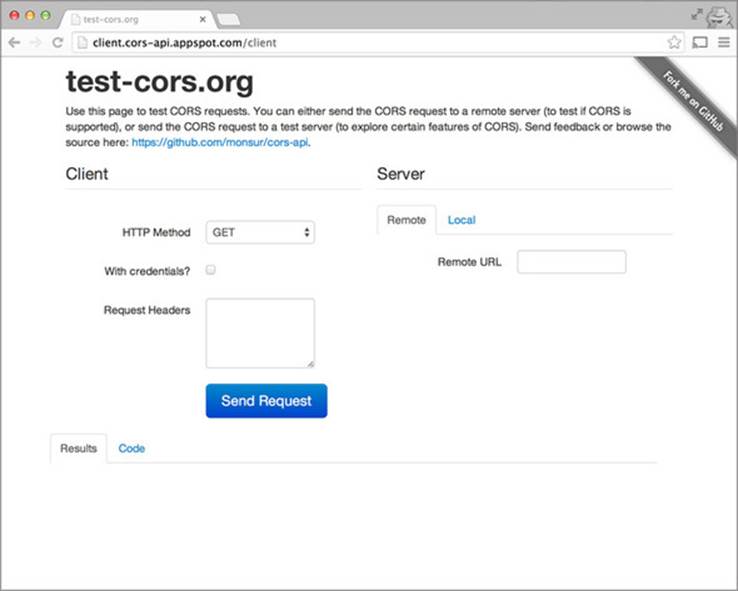
The page is divided into three parts: the client panel, the server panel, and the results panel. Let’s dig deeper into how these panels interact by exploring the various features of test-cors.org.
7.5.1. Sending requests to a remote server
The first way to use test-cors.org is to send cross-origin requests to a remote server. This is similar to how curl works, but it makes its request from the browser using an XMLHttpRequest object, rather than the command line. This can be helpful because it makes an HTTP request the same way you’d expect a client. For example, curl will let you add a Host header to the request. But the Host header can’t be set from test-cors.org, because the browser controls this header.
To use test-cors.org to send a request to your sample server, begin by recreating the request to /api/posts in the client panel. This is a GET request that includes cookies and has the Timezone-Offset and Sample-Source headers set. Next, choose the Remote tab in the response panel (if it’s not already selected) and enter http://127.0.0.1:9999/api/posts in the Remote URL textbox.
Note
You’ll also need to whitelist the origin http://client.cors-api.appspot.com in your server app.
If you click the Send Request button, it will send the request to your test server. Figure 7.16 shows an example of what the page should look like.
Figure 7.16. Making a request to the sample server
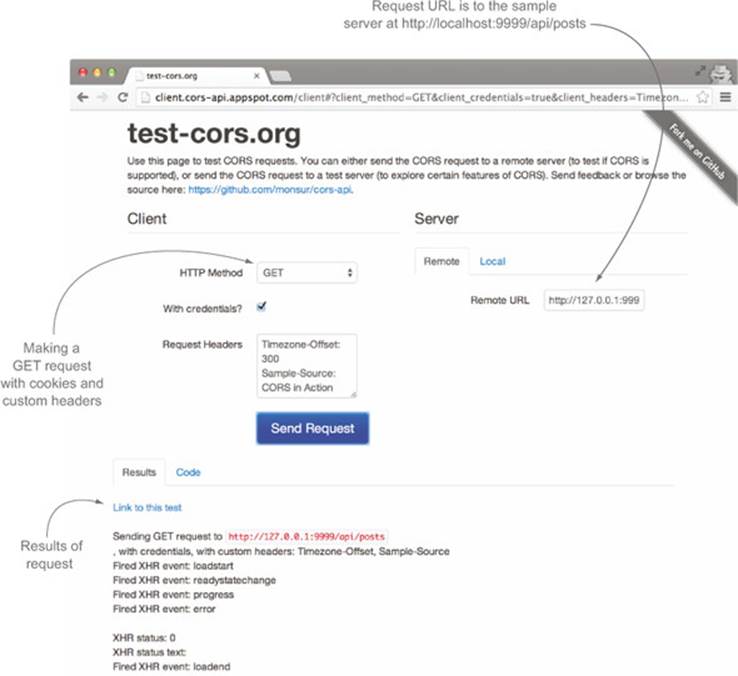
It may seem odd that the test-cors.org website, which lives on a different server, can access your local server at 127.0.0.1:9999. But remember that test-cors.org makes requests from the browser, so the test-cors.org server itself isn’t involved in the request. Since the JavaScript code is running on your computer, it can make requests to localhost.
Another convenient feature of test-cors.org is that you don’t need a working CORS implementation to use it. The site also allows requests to be made to its own local server. The next section takes a look at how to do this, and why it’s useful.
7.5.2. Sending requests to the local server
In addition to sending cross-origin requests, test-cors.org can send requests to its own local server. This local server can be configured using the parameters in the response panel, which control how the server responds to CORS requests.
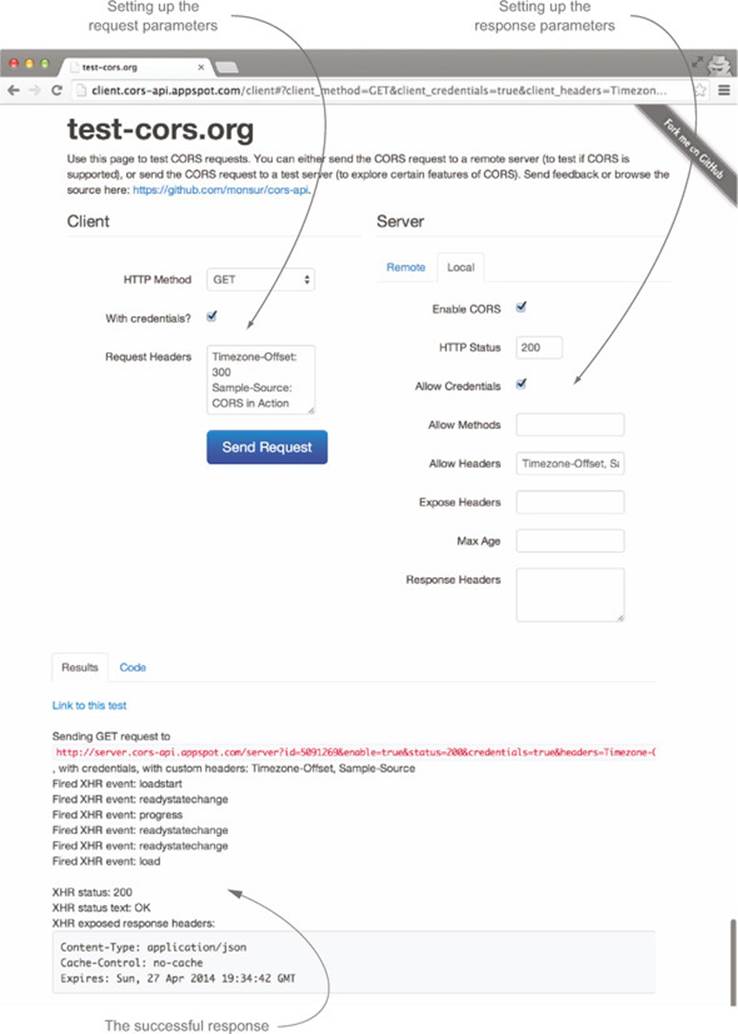
Let’s configure the local server to respond to the same GET request configured in the previous section. Choose the Local tab in the response panel. This shows the options that can be configured in the local server. If you click Send Request, you’ll see that the error event handler will fire. This code throws an error because you haven’t configured the local server to support cookies and custom headers.
Each box under the Local tab corresponds to a particular CORS header. You can add support for cookies and custom headers by first clicking the Allow Credentials checkbox, then typing Timezone-Offset, Sample-Source in the Allow Headers checkbox. After making these changes and clicking Send Request, the request should succeed, as shown in figure 7.17.
Figure 7.17. Recreating the request to /api/posts on the test-cors.org server
This particular feature was intended as a playground for exploring how CORS works. CORS can be a difficult feature to learn because it requires both a server and a client. This feature gives you both a server and a client that you can customize and play around with. Hopefully it can be a useful tool for answering your CORS questions.
7.5.3. Understanding how the client works
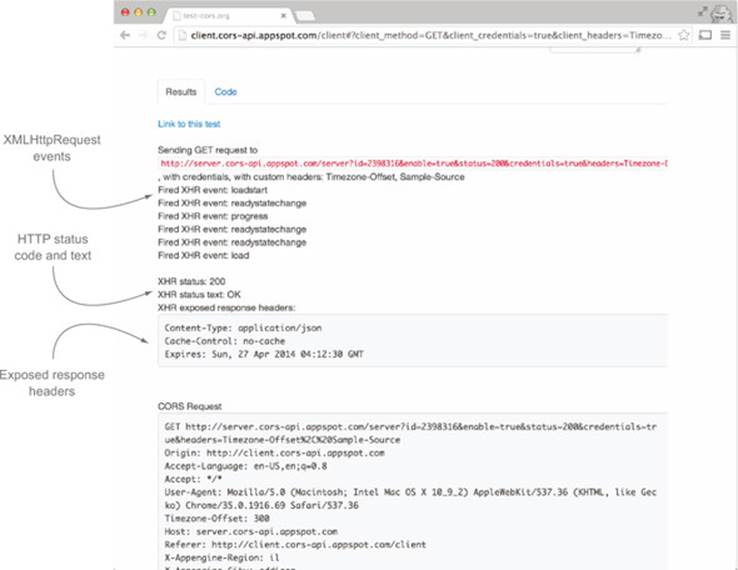
Test-cors.org can also be used to get a better handle on how the client behaves when making cross-origin requests. The log panel displays the following bits of information (see figure 7.18):
· All the client-side event handlers that fire during the course of the request. This can be useful to view things like when and in what order the events fire.
· The status code and status text associated with the response.
· Any response headers visible to the client. This can help verify which headers are exposed through the Access-Control-Expose-Headers header.
Figure 7.18. Test-cors.org results panel
In addition, the site gives you the JavaScript code associated with the request. Choosing the Code tab will show the JavaScript code used to send the request, as shown in figure 7.19.
Figure 7.19. JavaScript code used to make the HTTP request
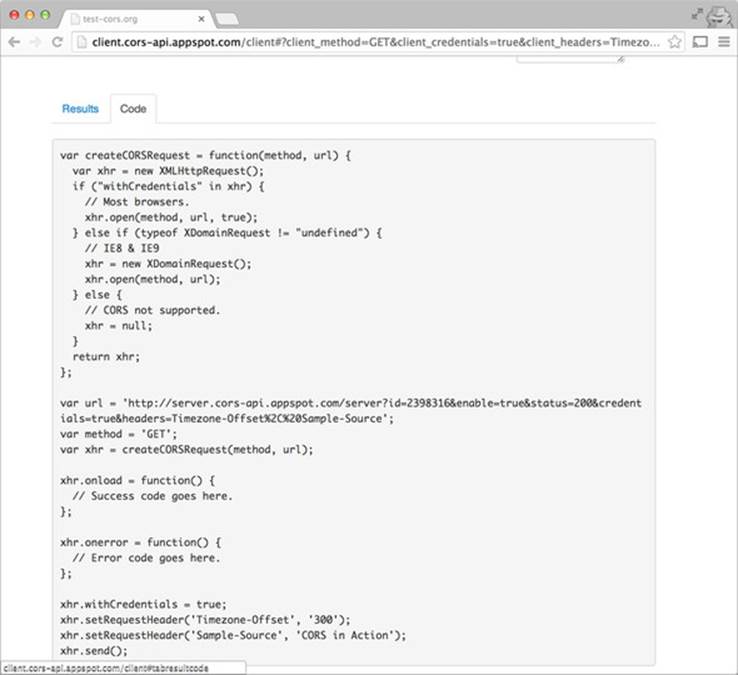
The code in figure 7.19 creates an XMLHttpRequest that uses the GET method, sets withCredentials to true, and sets the Timezone-Offset and Sample-Source request headers. You can copy and paste this code into your own page to recreate the same request.
The tools and techniques described here work great for debugging from a computer. It can be a bit harder to debug requests from mobile devices. For example, there is no way to run Wireshark on your iPhone. The next section looks at tips for debugging requests from mobile devices.
7.6. Tips for mobile debugging
Debugging requests from mobile phones can be a challenge because the tools described in this chapter aren’t available on a mobile phone. But if you’re debugging requests from a mobile phone, there are still techniques you can use to capture the HTTP headers.
7.6.1. Log requests on the server
If you’re in charge of the server that receives the request, you could configure it to log HTTP headers. The following code will log the request headers to a Node.js server’s output:
console.log(req.headers);
The headers can be logged to the output, to the server logs, or to anywhere that is convenient for you. The exact configuration of where to log the headers depends on your server and logging framework.
7.6.2. Use test-cors.org
We covered test-cors.org in the previous section. Because test-cors.org is a web tool, it can be accessed from any browser, including mobile browsers. If you visit test-cors.org from your mobile phone, you can send a series of test requests to your own server or to the test-cors.org server and view the response.
7.6.3. Use remote debugging tools
There are remote debugging tools available for mobile phones and they all work in the same way. You connect your phone to your computer, and the computer logs request and response information from the phone. Here are a few remote debugging options:
· Chrome has built-in remote debugging options for Android phones. More details can be found at https://developer.chrome.com/devtools/docs/remote-debugging.
· Safari supports remote debugging for iPhones and iOS devices, but only from a Mac. More details can be found at http://webdesign.tutsplus.com/articles/quick-tip-using-web-inspector-to-debug-mobile-safari--webdesign-8787.
· Fiddler is a tool that allows you to proxy mobile requests through your computer, and logs the request and response details. Fiddler can be used with both iOS and Android, but it only runs on Windows. You can learn more about Fiddler at www.telerik.com/fiddler.
7.6.4. Use a mobile simulator
Google, Apple, and Microsoft all provide mobile simulators to test their respective mobile platforms. These simulators are programs that run in your computer, but mimic a mobile phone interface. Figure 7.20 shows an example of Apple’s iOS simulator running on a Mac.
Figure 7.20. Apple’s iOS simulator
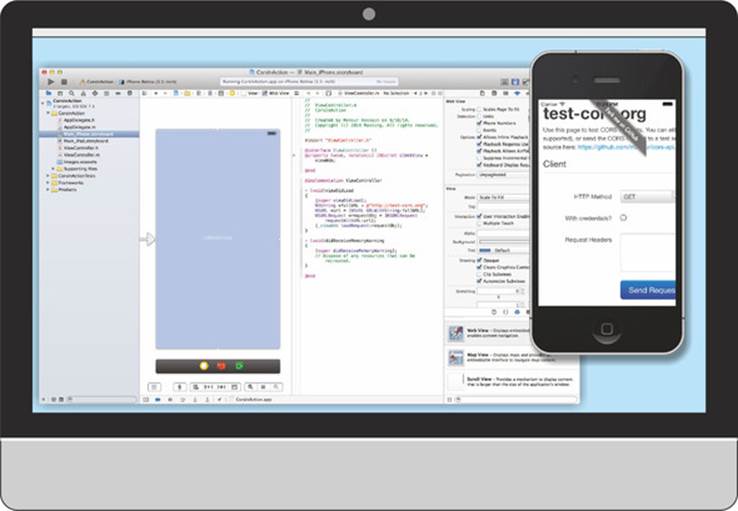
Using a simulator will give you a good idea of how a request will behave on a mobile device. It’s also handy when you want to test a device you may not have access to (for example, if you own an Android phone, but want to test an iPhone).
So far I’ve covered techniques for testing and debugging CORS requests. But what if you’ve tried all these techniques and you’re still stuck? The next section looks into some options for getting help with CORS questions.
7.7. Getting help
If you’re stuck on some CORS issues, here are a few resources you can consult to get some help. The first is the site enable-cors.org (full disclosure: I maintain this site as well). The site seeks to catalog how to enable CORS in all the programming languages and platforms. The examples in this book are built around Node.js, but if you’re using a different platform, such as Tomcat, you can turn to enable-cors.org to learn more about configuring CORS in Tomcat.
Enable-cors.org catalogs over 10 different platforms. It also contains pointers to learning more about CORS, as well as links to other CORS-enabled APIs. The site is also open source and hosted at GitHub athttps://github.com/monsur/enable-cors.org, so you can contribute your own edits or content.
Stack Overflow (http://stackoverflow.com) is a good place to ask CORS-related questions. It is a popular, community-driven, question-and-answer site for programming-related issues. Each question can be categorized with a set of tags, and you can find CORS questions tagged with a “cors.” If you post a question here, including the request and response headers from your code (using either Chrome developer tools or Wireshark, as described previously) can go a long way toward helping others to answer your question.
7.8. Summary
This chapter presented tools you can use to debug issues with CORS requests. When faced with a broken CORS request, the steps to solve it are always the same:
1. Grab a snapshot of the request and response headers.
2. Compare the headers to see if and where there is a mismatch.
3. Fix the issue by either
1. Updating the client to send the correct headers.
2. Updating the server to allow the client headers.
This chapter also covered the following tools and resources, which can aid in debugging CORS requests:
· Developer tools— Can be used to show errors, network traffic, and request/response headers
· Wireshark— Can be used to monitor network traffic
· Curl— Can be used to send HTTP requests
· Test-cors.org— Can be used to test cross-origin requests in the browser
· Enable-cors.org— Can show how to configure CORS in your own platform
· Stackoverflow.com— Where you can ask CORS-related questions
While CORS can be a powerful tool for enabling open APIs, it can sometimes prove challenging to work with. I hope this chapter and this book help you to successfully implement CORS on your own servers, and tackle any CORS-related issues that come your way. The web has always been driven forward by a vision of simplicity and openness. By supporting and using CORS, you’re doing your part to help promote this vision.