JavaScript for Kids: A Playful Introduction to Programming (2015)
Part III. Canvas
Chapter 13. The Canvas Element
JavaScript isn’t all about playing with text and numbers. You can also use JavaScript to draw pictures with the HTML canvas element, which you can think of as a blank canvas or sheet of paper. You can draw almost anything that you want on this canvas, such as lines, shapes, and text. The only limit is your imagination!
In this chapter, you’ll learn the basics of drawing on the canvas. In the following chapters, we’ll build on our knowledge to create a canvas-based JavaScript game.
Creating a Basic Canvas
As our first step in using the canvas, create a new HTML document for the canvas element, as shown in the following listing. Save this document as canvas.html:
<!DOCTYPE html>
<html>
<head>
<title>Canvas</title>
</head>
<body>
➊ <canvas id="canvas" width="200" height="200"></canvas>
<script>
// We'll fill this in next
</script>
</body>
</html>
As you can see at ➊, we create a canvas element and give it an id property of "canvas", which we’ll use to select the element in our code. The width and height properties set the dimensions of the canvas element in pixels. Here we set both dimensions to 200.
Drawing on the Canvas
Now that we’ve built a page with a canvas element, let’s draw some rectangles with JavaScript. Enter this JavaScript between the <script> tags in canvas.html.
var canvas = document.getElementById("canvas");
var ctx = canvas.getContext("2d");
ctx.fillRect(0, 0, 10, 10);
We’ll go over this code line by line in the following sections.
Selecting and Saving the canvas Element
First, we select the canvas element using document.getElementById("canvas"). As we saw in Chapter 9, the getElementById method returns a DOM object representing the element with the supplied id. This object is assigned to the canvas variable with the code var canvas = document.getElementById("canvas").
Getting the Drawing Context
Next, we get the drawing context from the canvas element. A drawing context is a JavaScript object that includes all the methods and properties for drawing on a canvas. To get this object, we call getContext on canvas and pass it the string "2d" as an argument. This argument says that we want to draw a two-dimensional image on our canvas. We save this drawing context object in the variable ctx using the code var ctx = canvas.getContext("2d").
Drawing a Square
Finally, on the third line, we draw a rectangle on the canvas by calling the method fillRect on the drawing context. The fillRect method takes four arguments. In order, these are the x- and y-coordinates of the top-left corner of the rectangle (0, 0) and the width and height of the rectangle (10, 10). In this case, we’re saying, “Draw a 10-pixel-by-10-pixel rectangle at coordinates (0, 0),” which are at the top-left corner of the canvas.
When you run this code, you should see a small black square on your screen, as shown in Figure 13-1.
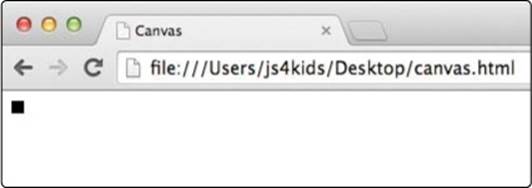
Figure 13-1. Our first canvas drawing
Drawing Multiple Squares
How about trying something a bit more interesting? Rather than drawing just one square, let’s use a loop to draw multiple squares running diagonally down the screen. Replace the code in the <script> tags with the following. When you run this code, you should see a set of eight black squares, as shown in Figure 13-2:
var canvas = document.getElementById("canvas");
var ctx = canvas.getContext("2d");
for (var i = 0; i < 8; i++) {
ctx.fillRect(i * 10, i * 10, 10, 10);
}
The first two lines are the same as in the earlier listing. In the third line, we create a for loop that runs from 0 to 8. Next, inside this loop, we call fillRect on the drawing context.
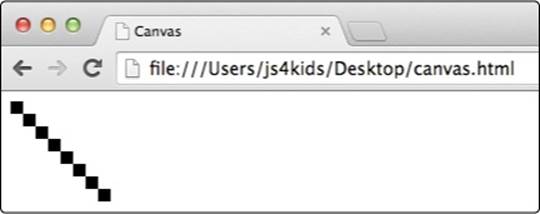
Figure 13-2. Drawing multiple squares using a for loop
The x and y positions for the top-left corner of each square are based on the loop variable, i. The first time around the loop, when i is 0, the coordinates are (0, 0) because 0 × 10 is equal to 0. This means that when we run the code ctx.fillRect(i * 10, i * 10, 10, 10), we will draw a square at the coordinates (0, 0), with a width and height of 10 pixels by 10 pixels. This is the top-left square in Figure 13-2.
The second time around the loop, when i is 1, the coordinates are (10, 10) because 1 × 10 is equal to 10. This time, the code ctx.fillRect(i * 10, i * 10, 10, 10) draws a square at the coordinates (10, 10), but the square’s size is still 10 pixels by 10 pixels (because we’re not changing the width and height arguments). This is the second square down in Figure 13-2.
Since i increments by 1 each time through the loop, the x- and y-coordinates keep increasing by 10 pixels each time through the loop, but the width and height of the square stay fixed at 10. The remaining six squares are drawn over the remaining six times around the loop.
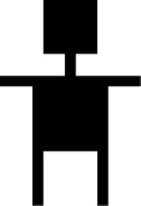
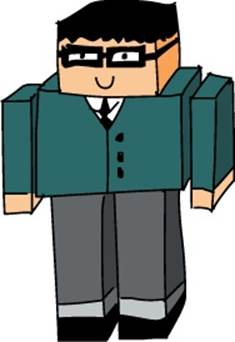
Now that you know how to draw squares and rectangles on the canvas, try drawing this little robot using the fillRect method.
Hint: You’ll need to draw six separate rectangles. I made the head using a 50-pixel-by-50-pixel rectangle. The neck, arms, and legs are all 10 pixels wide.
Changing the Drawing Color
By default, when you call fillRect, JavaScript draws a black rectangle. To use a different color, you can change the fillStyle property of the drawing context. When you set fillStyle to a new color, everything you draw will be drawn in that color until you change fillStyleagain.
The easiest way to set a color for fillStyle is to give it the name of a color as a string. For example:
var canvas = document.getElementById("canvas");
var ctx = canvas.getContext("2d");
➊ ctx.fillStyle = "Red";
ctx.fillRect(0, 0, 100, 100);
At ➊ we tell the drawing context that everything we draw from now on should be colored red. Running this code should draw a bright red square on the screen, as shown in Figure 13-3.
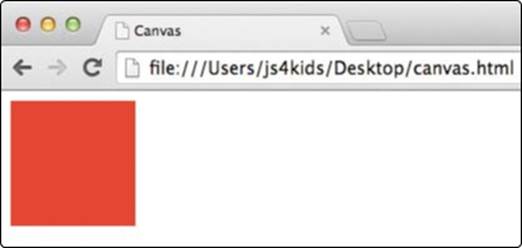
Figure 13-3. A red square
NOTE
JavaScript understands more than 100 color names, including Green, Blue, Orange, Red, Yellow, Purple, White, Black, Pink, Turquoise, Violet, SkyBlue, PaleGreen, Lime, Fuchsia, DeepPink, Cyan, and Chocolate. You’ll find a full list on the CSS-Tricks website: http://css-tricks.com/snippets/css/named-colors-and-hex-equivalents/.
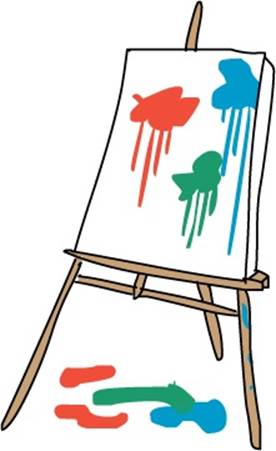
Look at the CSS-Tricks website (http://css-tricks.com/snippets/css/named-colors-and-hex-equivalents/) and choose three colors you like. Draw three rectangles using these colors. Each rectangle should be 50 pixels wide and 100 pixels tall. Don’t include any space between them. You should end up with something like this:
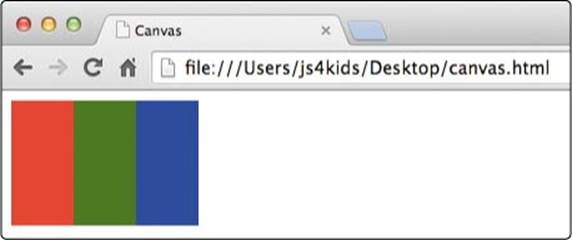
. . . although I’m sure you can find some more interesting colors than red, green, and blue!
Drawing Rectangle Outlines
As we’ve seen, the fillRect method draws a filled-in rectangle. That’s fine if that’s what you want, but sometimes you might want to draw just the outline, as if you were using a pen or pencil. To draw just the outline of a rectangle, we use the strokeRect method. (The word stroke is another word for outline.) For example, running this code should draw the outline of small rectangle, as shown in Figure 13-4:
var canvas = document.getElementById("canvas");
var ctx = canvas.getContext("2d");
ctx.strokeRect(10, 10, 100, 20);
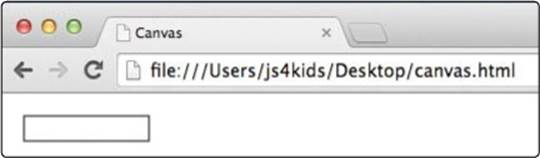
Figure 13-4. Using strokeRect to draw the outline of a rectangle
The strokeRect method takes the same arguments as fillRect: first the x- and y-coordinates of the top-left corner, followed by the width and height of the rectangle. In this example, we see that a rectangle is drawn starting at 10 pixels from the top left of the canvas, and it is 100 pixels wide by 20 pixels tall.
Use the strokeStyle property to change the color of the rectangle’s outline. To change the thickness of the line, use the lineWidth property. For example:
var canvas = document.getElementById("canvas");
var ctx = canvas.getContext("2d");
➊ ctx.strokeStyle = "DeepPink";
➋ ctx.lineWidth = 4;
ctx.strokeRect(10, 10, 100, 20);
Here, we set the color of the line to DeepPink at ➊ and the width of the line to 4 pixels at ➋. Figure 13-5 shows the resulting rectangle.
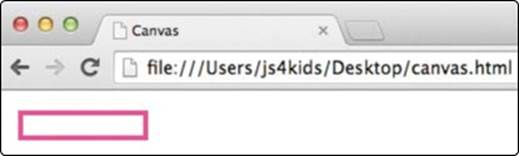
Figure 13-5. A deep pink rectangle with a 4-pixel-wide outline
Drawing Lines or Paths
Lines on the canvas are called paths. To draw a path with the canvas, you use x- and y-coordinates to set where each line should begin and end. By using a careful combination of starting and stopping coordinates, you can draw specific shapes on the canvas. For example, here’s how you might draw the turquoise X shown in Figure 13-6:
var canvas = document.getElementById("canvas");
var ctx = canvas.getContext("2d");
➊ ctx.strokeStyle = "Turquoise";
➋ ctx.lineWidth = 4;
➌ ctx.beginPath();
➍ ctx.moveTo(10, 10);
➎ ctx.lineTo(60, 60);
➏ ctx.moveTo(60, 10);
➐ ctx.lineTo(10, 60);
➑ ctx.stroke();
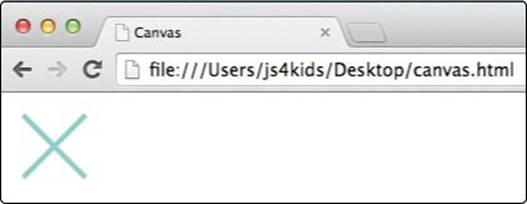
Figure 13-6. A turquoise X, drawn with moveTo and lineTo
At ➊ and ➋ we set the color and width of the line. At ➌ we call the beginPath method on the drawing context (saved as ctx) to tell the canvas that we want to start drawing a new path. At ➍ we call the moveTo method with two arguments: x- and y-coordinates. Calling moveTo picks up our virtual JavaScript pen off the canvas paper and moves it to those coordinates without drawing a line.
To start drawing a line, we call the lineTo method at ➎ with x- and y-coordinates, which places the virtual pen back on the canvas and traces a path to these new coordinates. Here, we draw a line from the point (10, 10) to the point (60, 60)—a diagonal line from the top left of the canvas to the bottom right, forming the first line of the X.
At ➏ we call moveTo again, which sets a new location to draw from. At ➐ we call lineTo again, to draw a line from (60, 10) to (10, 60)—a diagonal line from the top right of the canvas to the bottom left, completing the X shape.
But we’re not done yet! So far we’ve only told the canvas what we’d like to draw; we haven’t actually drawn anything. So at ➑, we call the stroke method, which finally makes the lines appear on the screen.
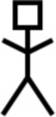
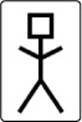
Try drawing this happy stickman using the beginPath, moveTo, lineTo, and stroke methods. You can use the strokeRect method for the head. The head is a 20-pixel-by-20-pixel square, and the line width is 4 pixels.
Filling Paths
So far we’ve looked at strokeRect for drawing rectangle outlines, fillRect for filling rectangles with color, and stroke for outlining a path. The equivalent of fillRect for paths is called fill. To fill a closed path with color instead of just drawing an outline, you can use the fillmethod instead of stroke. For example, you could use this code to draw the simple sky blue house shown in Figure 13-7.
var canvas = document.getElementById("canvas");
var ctx = canvas.getContext("2d");
ctx.fillStyle = "SkyBlue";
ctx.beginPath();
ctx.moveTo(100, 100);
ctx.lineTo(100, 60);
ctx.lineTo(130, 30);
ctx.lineTo(160, 60);
ctx.lineTo(160, 100);
ctx.lineTo(100, 100);
➊ ctx.fill();
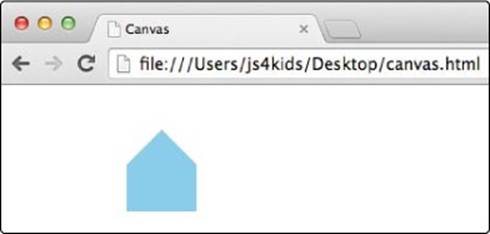
Figure 13-7. A sky blue house, drawn with a path and filled with the fill method
Here’s how this code works. After setting our drawing color to SkyBlue, we begin our path with beginPath and then move to our starting point of (100, 100) using moveTo. Next we call lineTo five times for each corner of the house, using five sets of coordinates. The final call tolineTo completes the path by going back to the starting point of (100, 100).
Figure 13-8 shows the same house, but with each coordinate labeled.
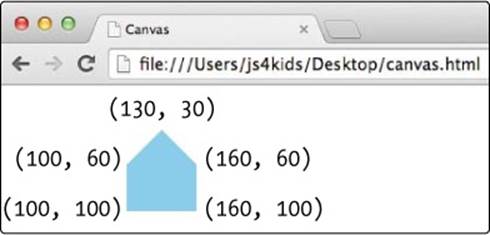
Figure 13-8. The house from Figure 13-7 with coordinates labeled
Finally, at ➊ we call the fill method, which fills our path with the chosen fill color, SkyBlue.
Drawing Arcs and Circles
In addition to drawing straight lines on the canvas, you can use the arc method to draw arcs and circles. To draw a circle, you set the circle’s center coordinates and radius (the distance between the circle’s center and outer edge) and tell JavaScript how much of the circle to draw by providing a starting angle and ending angle as arguments. You can draw a full circle, or just a portion of a circle to create an arc.
The starting and ending angles are measured in radians. When measured in radians, a full circle starts at 0 (at the right side of the circle) and goes up to π × 2 radians. So to draw a full circle, you tell arc to draw from 0 radians to π × 2 radians. Figure 13-9 shows a circle labeled with radians and their equivalent in degrees. The values 360° and π × 2 radians both mean a full circle.
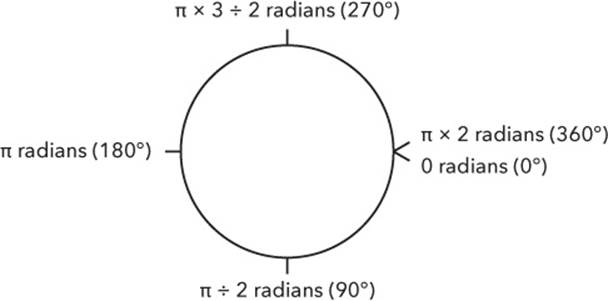
Figure 13-9. Degrees and radians, starting from the right side of the circle and moving clockwise
For example, the following code will create a quarter circle, a half circle, and a full circle, as shown in Figure 13-10.
ctx.lineWidth = 2;
ctx.strokeStyle = "Green";
ctx.beginPath();
➊ ctx.arc(50, 50, 20, 0, Math.PI / 2, false);
ctx.stroke();
ctx.beginPath();
➋ ctx.arc(100, 50, 20, 0, Math.PI, false);
ctx.stroke();
ctx.beginPath();
➌ ctx.arc(150, 50, 20, 0, Math.PI * 2, false);
ctx.stroke();
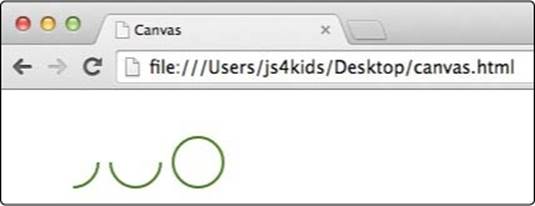
Figure 13-10. Drawing a quarter circle, a half circle, and a full circle
We’ll go over all three shapes in the following sections.
Drawing a Quarter Circle or an Arc
The first block of code draws a quarter circle. At ➊, after calling beginPath, we call the arc method. We set the center of the circle at the point (50, 50) and the radius to 20 pixels. The starting angle is 0 (which draws the arc starting from the right of the circle), and the ending angle isMath.PI / 2. Math.PI is how JavaScript refers to the number π (pi). Because a full circle is π × 2 radians, π radians means a half circle, and π ÷ 2 radians (which we’re using for this first arc) gives us a quarter circle. Figure 13-11 shows the start and end angles.
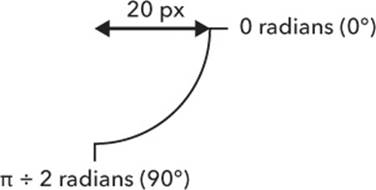
Figure 13-11. The start angle (0 radians, or 0°) and end angle (π ÷ 2 radians, or 90°) of the quarter-circle
We pass false for the final argument, which tells arc to draw in a clockwise direction. If you want to draw in a counterclockwise direction, pass true for this final argument.
Drawing a Half Circle
Next we draw a half circle. The arc at ➋ has a center at (100, 50), which places it 50 pixels to the right of the first arc, which was at (50, 50). The radius is again 20 pixels. We also start at 0 radians again, but this time we end at Math.PI, drawing a half circle. Figure 13-12 shows the start and end angles.
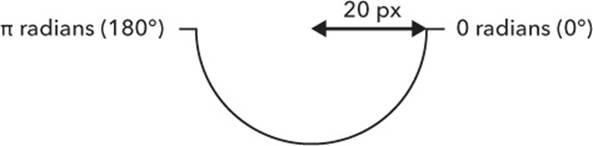
Figure 13-12. The start angle (0 radians, or 0°) and end angle (π radians, or 180°) of the half circle
Drawing a Full Circle
At ➌ we draw a full circle. The center is at (150, 50), and the radius is 20 pixels. For this circle, we start the arc at 0 radians and end it at Math.PI * 2 radians, drawing a full circle. Figure 13-13 shows the start and end angles.
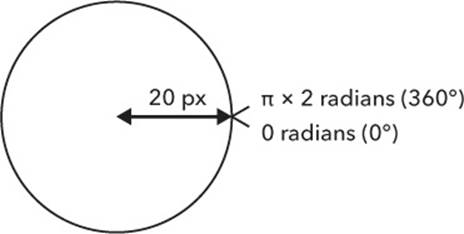
Figure 13-13. The start angle (0 radians, or 0°) and end angle (π × 2 radians, or 360°) of the full circle
Drawing Lots of Circles with a Function
If you just want to draw circles, the arc method is a bit complicated. For circles, you’re always going to want to start the arc at 0 and end at π × 2, and the direction (clockwise or counterclockwise) doesn’t matter. Also, to actually draw the circle you always need to call ctx.beginPath andctx.stroke before and after calling the arc method. We can make a function to draw circles that lets us ignore those details so that we have to supply only the x, y, and radius arguments. Let’s do that now.
var circle = function (x, y, radius) {
ctx.beginPath();
ctx.arc(x, y, radius, 0, Math.PI * 2, false);
ctx.stroke();
};
As with the arc method, inside this function the first thing we have to do is call ctx.beginPath to tell the canvas we want to draw a path. Then, we call ctx.arc, passing the x, y, and radius variables from the function arguments. As before, we use 0 for the start angle, Math.PI * 2for the end angle, and false to draw the circle clockwise.
Now that we have this function, we can draw lots of circles simply by filling in the center coordinates and radius as arguments. For example, this code would draw some colorful concentric circles:
ctx.lineWidth = 4;
ctx.strokeStyle = "Red";
circle(100, 100, 10);
ctx.strokeStyle = "Orange";
circle(100, 100, 20);
ctx.strokeStyle = "Yellow";
circle(100, 100, 30);
ctx.strokeStyle = "Green";
circle(100, 100, 40);
ctx.strokeStyle = "Blue";
circle(100, 100, 50);
ctx.strokeStyle = "Purple";
circle(100, 100, 60);
You can see what this should look like in Figure 13-14. First, we set the line width to a thick 4 pixels. Then we set the strokeStyle to "Red" and use the circle function to draw a circle at the coordinates (100, 100), with a radius of 10 pixels. This is the red center ring.
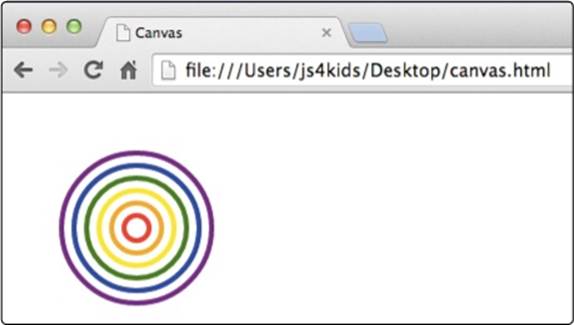
Figure 13-14. Colorful concentric circles, drawn using our circle function
We then use the same technique to draw an orange circle at the same location but with a radius of 20 pixels; we follow that with a yellow circle, again in the same location but with a radius of 30 pixels. The last three circles are also in the same location, but with increasingly larger radii and in green, blue, and purple.
How would you modify our circle function to make it fill the circle instead of outline it? Add a fourth argument, a Boolean, that says whether the circle should be filled or outlined. Passing true indicates that you want the circle to be filled. You can call the argument fillCircle.
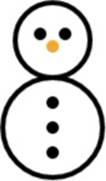
Using your modified function, draw this snowman, using a mix of outlined and filled circles.
What You Learned
In this chapter, you learned about a new HTML element called canvas. Using the canvas’s drawing context, we can easily draw rectangles, lines, and circles, with full control over their location, line width, color, and so on.
In the next chapter, we’ll learn how to animate our drawings, using some of the techniques we learned in Chapter 9.

Programming Challenges
Try these challenges to practice drawing to the canvas.
#1: A SNOWMAN-DRAWING FUNCTION
Building on your code for drawing a snowman (Figure 13-14), write a function that draws a snowman at a specified location, so that calling this . . .
drawSnowman(50, 50);
would draw a snowman at the point (50, 50).
#2: DRAWING AN ARRAY OF POINTS
Write a function that will take an array of points like this:
var points = [[50, 50], [50, 100], [100, 100], [100, 50], ![]()
[50, 50]];
drawPoints(points);
and draw a line connecting the points. In this example, the function would draw a line from (50, 50) to (50, 100) to (100, 100) to (100, 50) and back to (50, 50).
Now use this function to draw the following points:
var mysteryPoints = [[50, 50], [50, 100], [25, 120], ![]()
[100, 50], [70, 90], [100, 90], [70, 120]];
drawPoints(mysteryPoints);
Hint: You can use points[0][0] to get the first x-coordinate and points[0][1] to get the first y-coordinate.
#3: PAINTING WITH YOUR MOUSE
Using jQuery and the mousemove event, draw a filled circle with a radius of 3 pixels at the mouse position whenever you move your mouse over the canvas. Because this event is triggered by every tiny movement of the mouse, these circles will join into a line as you move the mouse over the canvas.
Hint: Refer to Chapter 10 for a reminder of how to respond to mousemove events.
#4: DRAWING THE MAN IN HANGMAN
In Chapter 7 we created our own version of the game Hangman. Now you can make it closer to the real game by drawing part of a stick man every time the player gets a letter wrong.
Hint: Keep track of the number of times the player has guessed incorrectly. Write a function that takes this number as an argument and draws a different part of the body depending on the number passed in.
All materials on the site are licensed Creative Commons Attribution-Sharealike 3.0 Unported CC BY-SA 3.0 & GNU Free Documentation License (GFDL)
If you are the copyright holder of any material contained on our site and intend to remove it, please contact our site administrator for approval.
© 2016-2026 All site design rights belong to S.Y.A.