Node.js in Action (2014)
Appendix B. Debugging Node
During development, and especially while learning a new language or framework, debugging tools and techniques can be helpful. In this appendix, you’ll learn a number of ways to figure out exactly what’s going on with your Node application code.
B.1. Analyzing code with JSHint
Syntax- and scope-related errors are a common pitfall of development. The first line of defense, when attempting to determine the root of an application problem, is to look at the code. If you look at the source code, however, and don’t immediately see a problem, another thing worth doing is running a utility to check your source code for problems.
JSHint is one such utility. It can alert you to show-stopping errors, such as functions called in code that aren’t defined anywhere, as well as to stylistic concerns, such as not heeding the JavaScript convention of capitalizing class constructors. Even if you never run JSHint, reading over the types of errors it looks for will alert you to possible coding pitfalls.
JSHint is a project based on JSLint, a JavaScript source code analysis tool that has been around for a decade. JSLint, however, is not very configurable, and that’s where JSHint comes in.
JSLint is, in the opinion of many, overly strict in terms of enforcing stylistic recommendations. JSHint, conversely, allows you to tell it what you want it to check for and what you want it to ignore. Semicolons, for example, are technically required by JavaScript interpreters, but most interpreters use automated semicolon insertion (ASI) to insert them where they’re missing. Because of this, some developers omit them in their source code to lessen visual noise, and their code runs without issue. Whereas JSLint would complain that a lack of semicolons is an error, JSHint can be configured to ignore this “error” and check for show-stopping issues.
Installing JSHint makes available a command-line tool called jshint that checks source code. JSHint should be installed globally using npm by executing this command:
npm install -g jshint
Once you’ve installed JSHint, you can check JavaScript files by simply entering something like the following example:
jshint my_app.js
You’ll most likely want to create a configuration file for JSHint that indicates what you want it to check. One way to do so is to copy the default configuration file, available on GitHub (https://github.com/jshint/node-jshint/blob/master/.jshintrc), to your workstation and modify it.
If you name your version of the config file .jshintrc and include it in your application directory, or in any parent directory of your application directory, JSHint will automatically find and use it.
Alternatively, you can run JSHint using the config flag to specify a configuration file location. The following example shows JSHint being told to use a configuration file with a nonstandard filename:
jshint my_app.js --config /home/mike/jshint.json
For details about each specific configuration option, check out the JSHint website: http://www.jshint.com/docs/#options.
B.2. Outputting debugging information
If your code appears to be legitimate, but your application is still behaving unexpectedly, you may want to add debugging output to get a better sense of what’s going on under the hood.
B.2.1. Debugging with the console module
The console module is a built-in Node module that provides functionality useful for console output and debugging.
Outputting application status information
The console.log function is used to output application status information to standard output; console.info is another name for the same function. Arguments can be provided, printf()-style (http://en.wikipedia.org/wiki/Printf):
console.log('Counter: %d', counter);
For outputting warnings and errors, the console.warn and console.error functions operate similarly. The only difference is that instead of printing to standard output, they print to standard error. This enables you to, if desired, redirect warnings and errors to a log file, as the following example shows:
node server.js 2> error.log
The console.dir function will output an object’s contents. The next example output shows what this looks like:
{ name: 'Paul Robeson',
interests: [ 'football', 'politics', 'music', 'acting' ] }
Outputting timing information
The console module includes two functions that, when used together, allow you to time the execution of parts of your code. More than one thing can be timed simultaneously.
To start timing, add the following line to your code at the point you’d like timing to start:
console.time('myComponent');
To end timing, returning the time elapsed since timing started, add this line to your code at the point where timing should stop:
console.timeEnd('myComponent');
The preceding line will display the elapsed time.
Outputting stack traces
A stack trace provides you with information about what functions executed before a certain point in application logic. When Node encounters an error during application execution, for example, it outputs a stack trace to provide information about what led, in the application’s logic, to the error.
At any point during your application, you can output a stack trace, without causing your application to stop, by executing console.trace().
This will produce output similar to the following example stack trace:
Trace:
at lastFunction (/Users/mike/tmp/app.js:12:11)
at secondFunction (/Users/mike/tmp/app.js:8:3)
at firstFunction (/Users/mike/tmp/app.js:4:3)
at Object.<anonymous> (/Users/mike/tmp/app.js:15:3)
...
Note that stack traces display execution in reverse chronological order.
B.2.2. Using the debug module to manage debugging output
Debugging output is useful, but if you’re not actively troubleshooting an issue, it can end up being visual noise. Ideally you could switch debugging output on or off.
One way to toggle debugging output is to use an environmental variable. T.J. Holowaychuk’s debug module provides a handy tool for this, allowing you to manage debugging output using the DEBUG environmental variable. Chapter 13 details the use of the debug module.
B.3. Node’s built-in debugger
For debugging needs beyond adding simple debugging output, Node comes with a built-in command-line debugger. The debugger is invoked by starting your application using the debug keyword, like this:
node debug server.js
When running a Node application this way, you’ll be shown the first few lines of your application and presented with a debugger prompt, as shown in figure B.1.
Figure B.1. Starting the built-in Node debugger
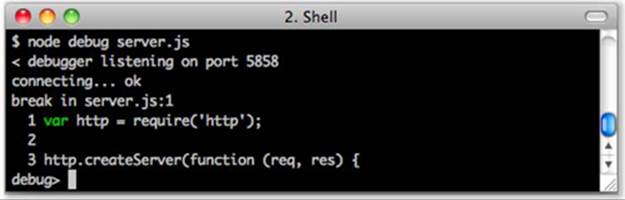
The “break in server.js:1” line means that the debugger has stopped before executing the first line.
B.3.1. Debugger navigation
At the debugger prompt, you can control the execution of your application. You could enter next (or just n) to execute the next line; alternatively, you could enter cont (or just c) to have it execute until interrupted.
The debugger can be interrupted by the termination of the application or by what are called breakpoints. Breakpoints are points where you want the debugger to stop execution so you can examine application state.
One way to add a breakpoint is by adding a line to your application where you want to put the breakpoint. This line should contain the statement debugger;, as listing B.1 shows. The debugger; line won’t do anything while running Node normally, so you can leave it and there will be no ill effects.
Listing B.1. Adding a breakpoint programmatically
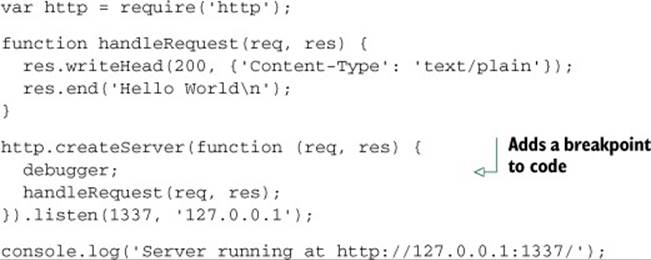
If you run listing B.1 in debug mode, it’ll first break at line 1. If you then enter cont into the debugger, it’ll proceed to create the HTTP server, awaiting a connection. If you create a connection by visiting http://127.0.0.1:1337 with a browser, you’ll see that it breaks at the debugger; line.
Enter next to continue to the next line of code. The current line will now be a function call to handleRequest. If you again enter next to continue to the next line, the debugger won’t descend into each line of handleRequest. But if you enter step, the debugger will descend into thehandleRequest function, allowing you to troubleshoot any issues with this particular function. If you change your mind about wanting to debug handleRequest, you can enter out (or o) to step out of the function.
Breakpoints can be set from within the debugger in addition to being specified in source code. To put a breakpoint in the current line in the debugger, enter set-Breakpoint() (or sb()) into the debugger. It’s possible to set a breakpoint at a specific line (sb(line)) or when a specific function is being executed (sb('fn()')).
When you want to unset a breakpoint, there’s the clearBreakpoint() function (cb()). This function takes the same arguments as the setBreakpoint() function, only it does the inverse.
B.3.2. Examining and manipulating state in the debugger
If you want to keep an eye on particular values in the application, you can add what are called watchers. Watchers inform you of the value of a variable as you navigate through code.
For example, when debugging the code in listing B.1, you could enter watch ("req.headers['user-agent']") and, for each step, you’d see what type of browser made the request. To see a list of watchers, you’d enter the watchers command. To remove a watcher, you’d use theunwatch command; unwatch("req .headers['user-agent']"), for example.
If at any point during debugging, you want to be able to fully examine, or manipulate, the state, you can use the repl command to enter a Read-Eval-Print-Loop (REPL). This allows you to enter any JavaScript expression and have it evaluate. To exit the REPL and return to the debugger, press Ctrl-C.
Once you’re done debugging, you can exit the debugger by pressing Ctrl-C twice, by pressing Ctrl-D, or by entering the .exit command.
These are the basics of debugger use. For more information on what can be done with the debugger, visit the official Node page: http://nodejs.org/api/debugger.html.
B.4. Node Inspector
Node Inspector is an alternative to Node’s built-in debugger. It uses a WebKit-based browser such as Chrome or Safari, rather than the command line, as an interface.
B.4.1. Starting Node Inspector
Before you begin debugging, Node Inspector should be installed globally with the following npm command. After installation, the node-inspector command will be available on your system:
npm install -g node-inspector
To debug a Node application, start it using the --debug-brk command-line option:
node --debug-brk server.js
Using the --debug-brk option causes the debugging to insert a breakpoint before the first line of your application. If this isn’t desired, you can use the --debug option instead.
Once your application is running, start Node Inspector:
node-inspector
Node Inspector is interesting because it uses the same code as WebKit’s Web Inspector, but plugged into Node’s JavaScript engine instead, so web developers should feel right at home using it.
Once Node Inspector is running, navigate to http://127.0.0.1:8080/debug?port=5858 in your WebKit browser, and you should see the Node Inspector. If you ran Node Inspector using the --debug-brk option, it will immediately show the first script in your application, as in figure B.2. If you used the --debug option, you’ll have to use the script selector, indicated by the script name “step.js” in figure B.2, to select the script you’d like to debug.
Figure B.2. The Node Inspector
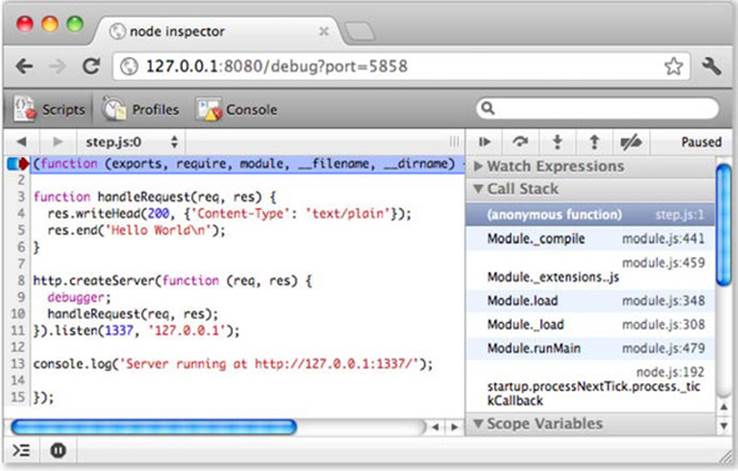
A red arrow is shown to the left of the line of code that will execute next.
B.4.2. Node Inspector navigation
To step to the next function call in your application, click the button that looks like a small circle with an arrow arcing over it. Node Inspector, like the command-line Node debugger, allows you to step into functions as well. When the red arrow is to the left of a function call, you can descend into the function by clicking the small circle with an arrow pointing down at it. To step out of the function, click the small circle with an arrow pointing up. If you’re using Node core or community modules, the debugger will switch to script files for these modules as you step through your application. Don’t be alarmed: it will at some point return to your application’s code.
To add breakpoints while running Node Inspector, click the line number to the left of any line of a script. If you’d like to clear all breakpoints, click the button to the right of the step-out button (arrow pointing up).
Node Inspector also has the interesting feature of allowing you to change code as your application runs. If you’d like to change a line of code, simply double-click on it, edit it, and then click out of the line.
B.4.3. Browsing state in Node Inspector
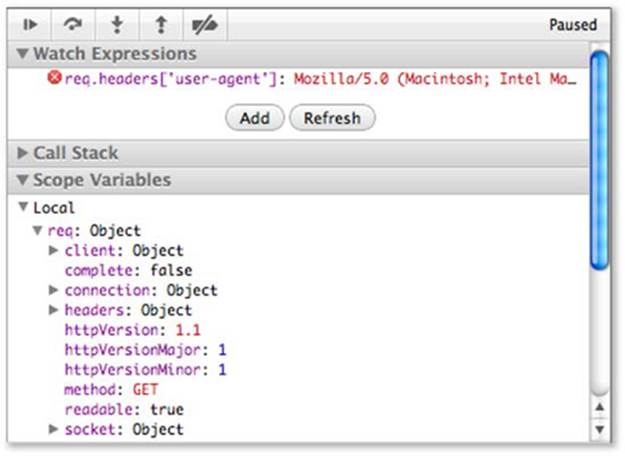
As you debug your application, you can inspect state using the collapsible panes under the buttons that allow you to navigate in the debugger, as shown in figure B.3. These allow you to inspect the call stack and variables in the scope of code currently being executed. Variables can be manipulated by double-clicking on them and changing their values. You can also, as with Node’s built-in command-line debugger, add watch expressions that will display as you step through your application.
Figure B.3. Browsing application state using Node Inspector
For more details about how to get the most out of Node Inspector, visit its GitHub project page: https://github.com/dannycoates/node-inspector/.
When in doubt, refresh
If you run into any odd behavior while using Node Inspector, refreshing the browser may help. If that doesn’t work, try restarting both your Node application and Node Inspector.