Java in a Nutshell, 6th Edition (2015)
Part II. Working with the Java Platform
Chapter 13. Platform Tools and Profiles
This chapter discusses the tools that ship with the Oracle and OpenJDK version of the Java platform. The tools covered mostly comprise command-line tools, but we also discuss the GUI tool jvisualvm. If you are using a different version of Java, you may find similar but different tools as part of your distribution instead.
Later in the chapter, we also discuss Java 8 profiles, which are cut-down installations of Java that nevertheless satisfy the language and virtual machine specifications.
Command-Line Tools
The command-line tools we cover are the most commonly used tools, and those of greatest utility—they are not a complete description of every tool that is available. In particular, tools concerned with CORBA and the server portion of RMI are not covered in detail.
NOTE
In some cases, we need to discuss switches that take filesystem paths. As elsewhere in the book, we use Unix conventions for such cases.
The tools we discuss are:
§ javac
§ java
§ jar
§ javadoc
§ jdeps
§ jps
§ jstat
§ jstatd
§ jinfo
§ jstack
§ jmap
§ javap
javac
Basic usage
javac some/package/MyClass.java
Description
javac is the Java source code compiler—it produces bytecode (in the form of .class files) from .java source files.
For modern Java projects, javac is not often used directly, as it is rather low-level and unwieldy, especially for larger codebases. Instead, modern integrated development environments (IDEs) either drive javac automatically for the developer or have built-in compilers for use while code is being written. For deployment, most projects will make use of a separate build tool, such as Maven, Ant, or Gradle. Discussion of these tools is outside the scope of this book.
Nevertheless, it is useful for developers to understand how to use javac as there are cases when compiling small codebases by hand is preferable to having to install and manage a production-grade build tool such as Maven.
Common switches
-classpath
Supplies classes we need for compilation.
-d some/dir
Tells javac where to output class files.
@project.list
Load options and source files from the file project.list.
-help
Help on options.
-X
Help on nonstandard options.
-source <version>
Control the Java version that javac will accept.
-target <version>
Control the version of class files that javac will output.
-profile <profile>
Control the profile that javac will use when compiling the application. See later in this chapter for more detail on Compact Profiles.
-Xlint
Enable detail about warnings.
-Xstdout
Redirect output of compilation run to a file.
-g
Add debug information to class files.
Notes
javac has traditionally accepted switches (-source and -target) that control the version of the source language that the compiler would accept, and the version of the class file format that was used for the outputted class files.
This facility introduces additional compiler complexity (as multiple language syntaxes must be supported internally) for some small developer benefit. In Java 8, this capability has begun to be slightly tidied up and placed on a more formal basis.
From JDK 8 onward, javac will only accept source and target options from three versions back. That is, only the formats from JDK 5, 6, 7, and 8 will be accepted by javac. This does not affect the java interpreter—any class file from any Java version will still work on the JVM shipped with Java 8.
C and C++ developers may find that the -g switch is less helpful to them than it is in those other languages. This is largely due to the widespread use of IDEs in the Java ecosystem—integrated debugging is simply a lot more useful, and easier to use, than additional debug symbols in class files.
The use of the lint capability remains somewhat contraversial among developers. Many Java developers produce code that triggers a large number of compilation warnings, which they then simply ignore. However, experience on larger codebases (especially on the JDK codebase itself) suggests that in a substantial percentage of cases, code that triggers warnings is code in which subtle bugs may lurk. Use of the lint feature, or static analysis tools (such as FindBugs), is strongly recommended.
java
Basic usage
java some.package.MyClass java -jar my-packaged.jar
Description
java is the executable that starts up a Java virtual machine. The initial entry point into the program is the main() method that exists on the named class, and that has the signature:
public static void main(String[] args);
This method is run on the single application thread that is created by the JVM startup. The JVM process will exit once this method returns (and any additional nondaemon application threads that were started have terminated).
If the form takes a JAR file rather than a class (the executable jar form), the JAR file must contain a piece of metadata that tells the JVM which class to start from.
This bit of metadata is the Main-Class: attribute, and it is contained in the MANIFEST.MF file in the META-INF/ directory. See the description of the jar tool for more details.
Common switches
-cp <classpath>
Define the classpath to read from.
-X, -?, -help
Provide help about the java executable and its switches.
-D<property=value>
Sets a Java system property that can be retrieved by the Java program. Any number of such properties can be specified this way.
-jar
Run an executable JAR (see the entry for jar).
-Xbootclasspath(/a or /p)
Run with an alternative system classpath (very rarely used).
-client, -server
Select a HotSpot JIT compiler (see “Notes” for this entry).
-Xint, -Xcomp, -Xmixed
Control JIT compilation (very rarely used).
-Xms<size>
Set the minimum committed heap size for the JVM.
-Xmx<size>
Set the maximum committed heap size for the JVM.
-agentlib:<agent>, -agentpath:<path to agent>
Specify a JVM Tooling Interface (JVMTI) agent to attach to the process being started. Agents are typically used for instrumentation or monitoring.
-verbose
Generate additional output, sometimes useful for debugging.
Notes
The HotSpot VM contains two separate JIT compilers—known as the client (or C1) compiler and the server (or C2) compiler. These were designed for different purposes, with the client compiler offering more predictable performance and quicker startup, at the expense of not performing aggressive code optimization.
Traditionally, the JIT compiler that a Java process used was chosen at process startup via the -client or -server switch. However, as hardware advances have made compilation ever cheaper, a new possibility has become available—to use the client compiler early on, while the Java process is warming up, and then to switch to the high-performance optimizations available in the server compiler when they are available. This scheme is called Tiered Compilation, and it is the default in Java 8. Most processes will no longer need explicit -client or -server switches.
On the Windows platform, a slightly different version of the java executable is often used—javaw. This version starts up a Java Virtual Machine, without forcing a Windows console window to appear.
In older Java versions, a number of different legacy interpreters and virtual machine modes were supported. These have now mostly been removed, and any remaining should be regarded as vestigial.
Switches that start with -X were intended to be nonstandard switches. However, the trend has been to standardize a number of these switches (particularly -Xms and -Xmx). In parallel, Java versions have introduced an increasing number of -XX: switches. These were intended to be experimental and not for production use. However, as the implementations have stabilized, some of these switches are now suitable for some advanced users (even in production deployments).
In general, a full discussion of switches is outside the scope of this book. Configuration of the JVM for production use is a specialist subject, and developers are urged to take care, especially when modifying any switches related to the garbage collection subsystem.
jar
Basic usage
jar cvf my.jar someDir/
Description
The jar utility is used to manipulate Java Archive (.jar) files. These are ZIP format files that contain Java classes, additional resources, and (usually) metadata. The tool has five major modes of operation—Create, Update, Index, List, and Extract—on a .jar file.
These are controlled by passing a command option character (not a switch) to jar. Only one command character can be specified, but optional modifier characters can also be used.
Command options
c
Create a new archive
u
Update archive
i
Index an archive
t
List an archive
x
Extract an archive
Modifiers
v
Verbose mode
f
Operate on a named file, rather than standard input
0
Store, but do not compress, files added to the archive
m
Add the contents of the specified file to the jar metadata manifest
e
Make this jar executable, with the specified class as the entry point
Notes
The syntax of the jar command is intentionally very similar to that of the Unix tar command. This similarity is the reason why jar uses command options, rather than switches (as the other Java platform commands do).
When creating a .jar file, the jar tool will automatically add a directory called META-INF that contains a file called MANIFEST.MF—this is metadata in the form of headers paired with values. By default, MANIFEST.MF contains just two headers:
Manifest-Version: 1.0
Created-By: 1.8.0 (Oracle Corporation)
By using the m option, additional metadata can be added into MANIFEST.MF at JAR creation time. One frequently added piece is the Main-Class: attribute, which indicates the entry point into the application contained in the JAR. A JAR with a specified Main-Class: can be directly executed by the JVM, via java -jar.
The addition of the Main-Class: attribute is so common that jar has the e option to create it directly in MANIFEST.MF, rather than having to create a separate text file for this purpose.
javadoc
Basic usage
javadoc some.package
Description
javadoc produces documentation from Java source files. It does so by reading a special comment format (known as Javadoc comments) and parsing it into a standard documentation format, which can then be output into a variety of document formats (although HTML is by far the most common).
For a full description of Javadoc syntax, refer to Chapter 7.
Common switches
-cp <classpath>
Define the classpath to use
-D <directory>
Tell javadoc where to output the generated docs
-quiet
Suppress output except for errors and warnings
Notes
The platform API docs are all written in Javadoc.
javadoc is built on top of the same classes as javac, and uses some of the source compiler infrastructure to implement Javadoc features.
The typical way to use javadoc is to run it against a whole package, rather than just a class.
javadoc has a very large number of switches and options that can control many aspects of its behavior. Detailed discussion of all the options is outside the scope of this book.
jdeps
The jdeps tool is a static analysis tool for analyzing the dependencies of packages or classes. The tool has a number of usages, from identifying developer code that makes calls into the internal, undocumented JDK APIs (such as the sun.misc classes), to helping trace transitive dependencies.
jdeps can also be used to confirm whether a JAR file can run under a Compact Profile (see later in the chapter for more details on Compact Profiles).
Basic usage
jdeps com.me.MyClass
Description
jdeps reports dependency information for the classes it is asked to analyze. The classes can be specified as any class on the classpath, a file path, a directory, or a JAR file.
Common switches
-s, -summary
Prints dependency summary only.
-v, -verbose
Prints all class-level dependencies.
-verbose:package
Prints package-level dependencies, excluding dependencies within the same archive.
-verbose:class
Prints class-level dependencies, excluding dependencies within the same archive.
-p <pkg name>, -package <pkg name>
Finds dependencies in the specified package. You can specify this option multiple times for different packages. The -p and -e options are mutually exclusive.
-e <regex>, -regex <regex>
Finds dependencies in packages matching the specified regular expression pattern. The -p and -e options are mutually exclusive.
-include <regex>
Restricts analysis to classes matching pattern. This option filters the list of classes to be analyzed. It can be used together with -p and -e.
-jdkinternals
Finds class-level dependences in JDK internal APIs (which may change or disappear in even minor platform releases).
-apionly
Restricts analysis to APIs—for example, dependencies from the signature of public and protected members of public classes including field type, method parameter types, returned type, and checked exception types.
-R, -recursive
Recursively traverses all dependencies.
-h, -?, -help
Prints help message for jdeps.
Notes
While Project Jigsaw did not ship as part of Java 8, jdeps is a first step toward making developers aware of their dependencies on the JRE not as a monolithic environment, but as something more modular.
jps
Basic usage
jps jps <remote URL>
Description
jps provides a list of all active JVM processes on the local machine (or a remote machine, if a suitable instance of jstatd is running on the remote side).
Common switches
-m
Output the arguments passed to the main method
-l
Output the full package name for the application’s main class (or the full path name to the application’s JAR file)
-v
Output the arguments passed to the JVM
Notes
This command is not strictly necessary as the standard Unix ps command could suffice. However, it does not use the standard Unix mechanism for interrogating the process, so there are circumstances where a Java process stops responding (and looks dead to jps) but is still listed as alive by the operating system.
jstat
Basic usage
jstat <pid>
Description
This command displays some basic statistics about a given Java process. This is usually a local process, but can be located on a remote machine, provided the remote side is running a suitable jstatd process.
Common switches
-options
Reports a list of report types that jstat can produce
-class
Report on classloading activity to date
-compiler
JIT compilation of the process so far
-gcutil
Detailed GC report
-printcompilation
More detail on compilation
Notes
The general syntax jstat uses to identify a process (which may be remote) is:
[<protocol>://]<vmid>[@hostname][:port][/servername]
The general syntax is used to specify a remote process (which is usually connected to via JMX over RMI), but in practice, the local syntax is far more common, which simply uses the VM ID, which is the operating system process ID on mainstream platforms (such as Linux, Windows, Unix, Mac, etc.).
jstatd
Basic usage
jstatd <options>
Description
jstatd provides a way of making information about local JVMs available over the network. It achieves this using RMI, and can make these otherwise-local capabilities accessible to JMX clients. This requires special security settings, which differ from the JVM defaults. To start jstatd, first we need to create the following file and name it jstatd.policy:
grant codebase "file:${java.home}../lib/tools.jar {
permission java.security.AllPermission
}
This policy file grants all security permissions to any class loaded from the JDK’s tools.jar file.
To launch jstatd with this policy, use this command line:
jstatd -J-Djava.security.policy=<path to jstat.policy>
Common switches
-p <port>
Look for an existing RMI registry on that port, and create one if not found
Notes
It is recommended that jstatd is always switched on in production environments, but not over the public Internet. For most corporate and enterprise environments, this is nontrivial to achieve and will require the cooperation of Operations and Network Engineering staff. However, the benefits of having telemetry data from production JVMs, especially during outages, are difficult to overstate.
A full discussion of JMX and monitoring techniques is outside the scope of this book.
jinfo
Basic usage
jinfo <process ID> jinfo <core file>
Description
This tool displays the system properties and JVM options for a running Java process (or a core file).
Common switches
-flags
Display JVM flags only
-sysprops
Display system properties only
Notes
In practice, this is very rarely used—although it can occasionally be useful as a sanity check that the expected program is actually what is executing.
jstack
Basic usage
jstack <process ID>
Description
The jstack utility produces a stack trace for each Java thread in the process.
Common switches
-F
Force a thread dump
-l
Long mode (contains additional information about locks)
Notes
Producing the stack trace does not stop or terminate the Java process. The files that jstack produces can be very large, and some post-processing of the file is usually necessary.
jmap
Basic usage
jmap <process>
Description
jmap provides a view of memory allocation for a running Java process.
Common switches
-histo
Produces a histogram of the current state of allocated memory.
-histo:live
This version of the histogram only displays information for live objects.
-heap
Produces a heap dump from the running process.
Notes
The histogram forms walk the JVMs allocation list. This includes both live and dead (but not yet collected) objects. The histogram is organized by the type of objects using memory, and is ordered from greatest to least number of bytes used by a particular type. The standard form does not pause the JVM.
The live form ensures that it is accurate, by performing a full, stop-the-world (STW) garbage collection before executing. As a result, it should not be used on a production system at a time when a full GC would appreciably impact users.
For the -heap form, note that the production of a heap dump can be a time-consuming process, and is STW. Note that for many processes, the resulting file may be extremely large.
javap
Basic usage
javap <classname>
Description
javap is the Java class disassembler—effectively a tool for peeking inside class files. It can show the bytecode that Java methods have been compiled into, as well as the “constant pool” information (which contains information similar to that of the symbol table of Unix processes).
By default, javap shows signatures of public, protected, and default methods. The -p switch will also show private methods.
Common switches
-c
Decompile bytecode
-v
Verbose mode (include constant pool information)
-p
Include private methods
Notes
The javap tool will work with any class file, provided javap is from a JDK version the same as (or later) than the one that produced the file.
NOTE
Some Java language features may have surprising implementations in bytecode. For example, as we saw in Chapter 9, Java’s String class has effectively immutable instances and the JVM implements the string concatenation operator + by instantiating a new StringBuilder object from the orginal string, mutating it and finally calling toString() on the resulting (new) instance. This is clearly visible in the disassembled bytecode shown by javap.
VisualVM
JVisualVM (often referred to as VisualVM) is a graphical tool, based on the Netbeans platform. It is used for monitoring JVMs and essentially acts as an equivalent, graphical aggregate of many of the tools featured in “Command-Line Tools”.
NOTE
jvisualvm is a replacement for the jconsole tool common in earlier Java versions. The compatability plug-in available for visualvm obsoletes jconsole; all installations using jconsole should migrate.
VisualVM was introduced with Java 6, and is contained in the Java distribution package. However, generally, the standalone version of VisualVM is more up to date and a better choice for serious work. You can download the latest version from http://visualvm.java.net/.
After downloading, ensure that the visualvm binary is added to your PATH or you’ll get the JRE default binary.
The first time you run VisualVM, it will calibrate your machine, so make sure that you aren’t running any other applications while calibration is being performed. After calibration, VisualVM will open to a screen like that shown in Figure 13.1.
To attach VisualVM to a running process, there are slightly different approaches depending on whether the process is local or remote.
Local processes are listed down the left-hand side of the screen. Double-click on one of the local processes and it will appear as a new tab on the right-hand pane.
For a remote process, enter the hostname and a display name that will be used on the tab. The default port to connect to is 1099, but this can be changed.
In order to connect to a remote process, jstatd must be running on the remote host (see the entry for jstatd in “Command-Line Tools” for more details). If you are connecting to an application server, you may find that the app server vendor provides an equivalent capability to jstatddirectly in the server, and that jstatd is unnecessary.
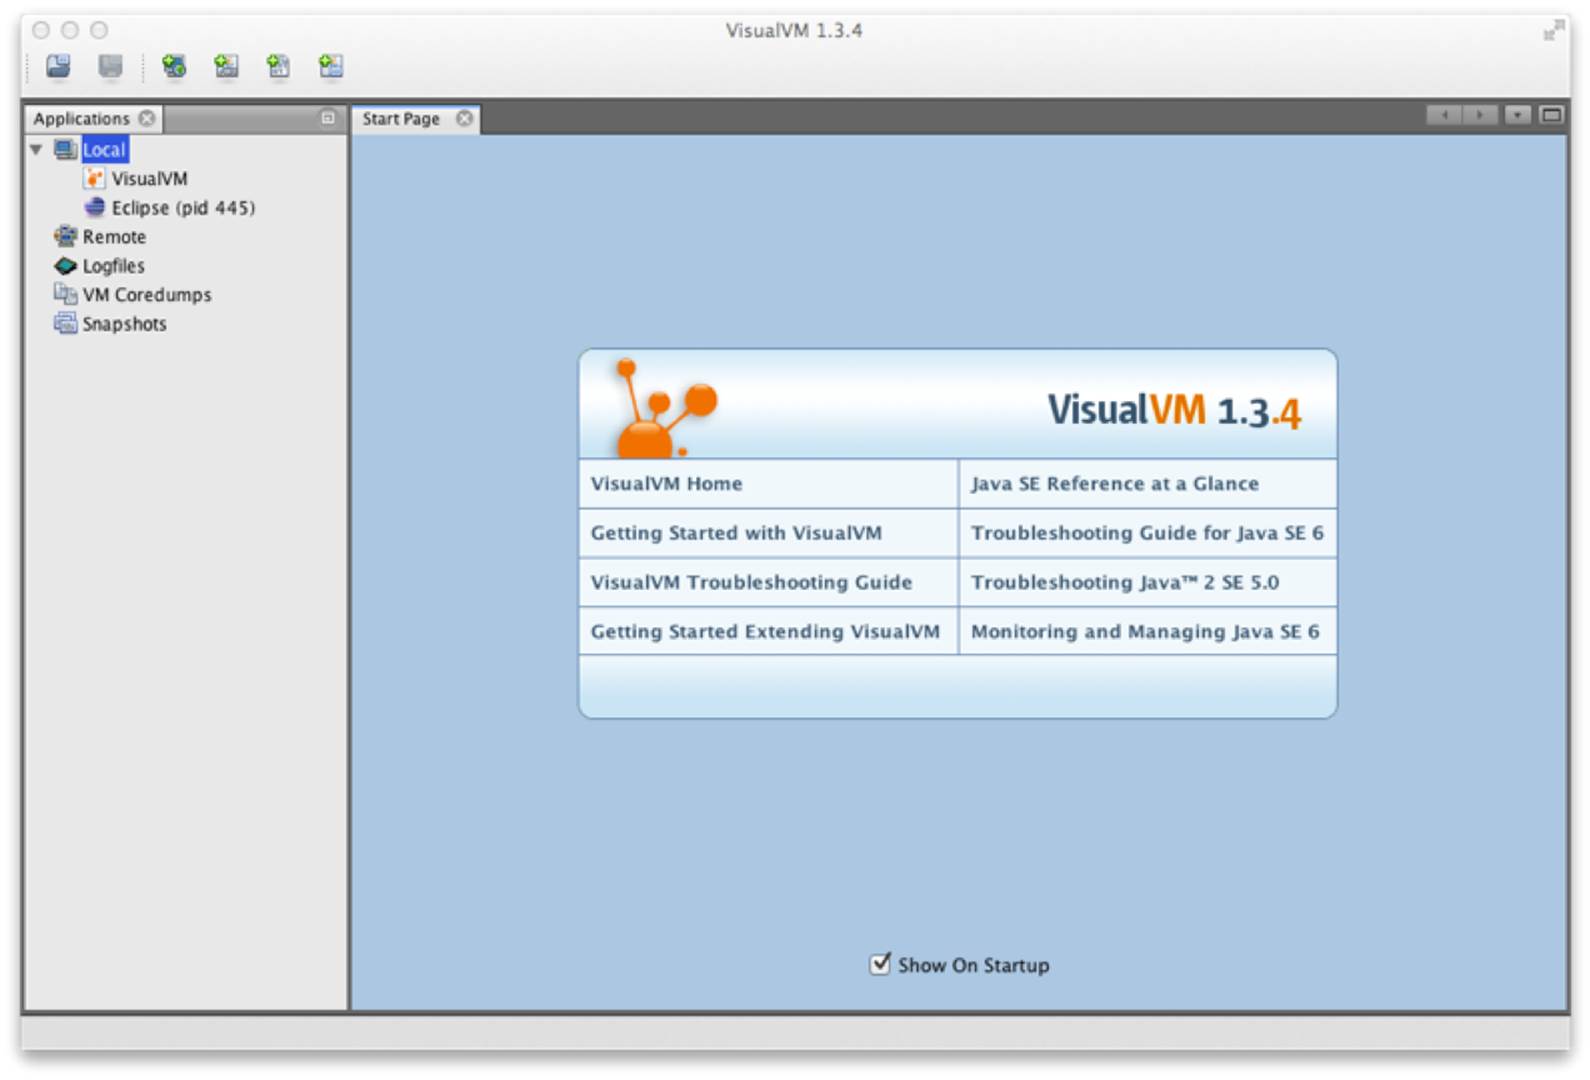
Figure 13-1. VisualVM welcome screen
The Overview tab (see Figure 13-2) provides a summary of information about your Java process. This includes the flags and system properties that were passed in, and the exact Java version being executed.
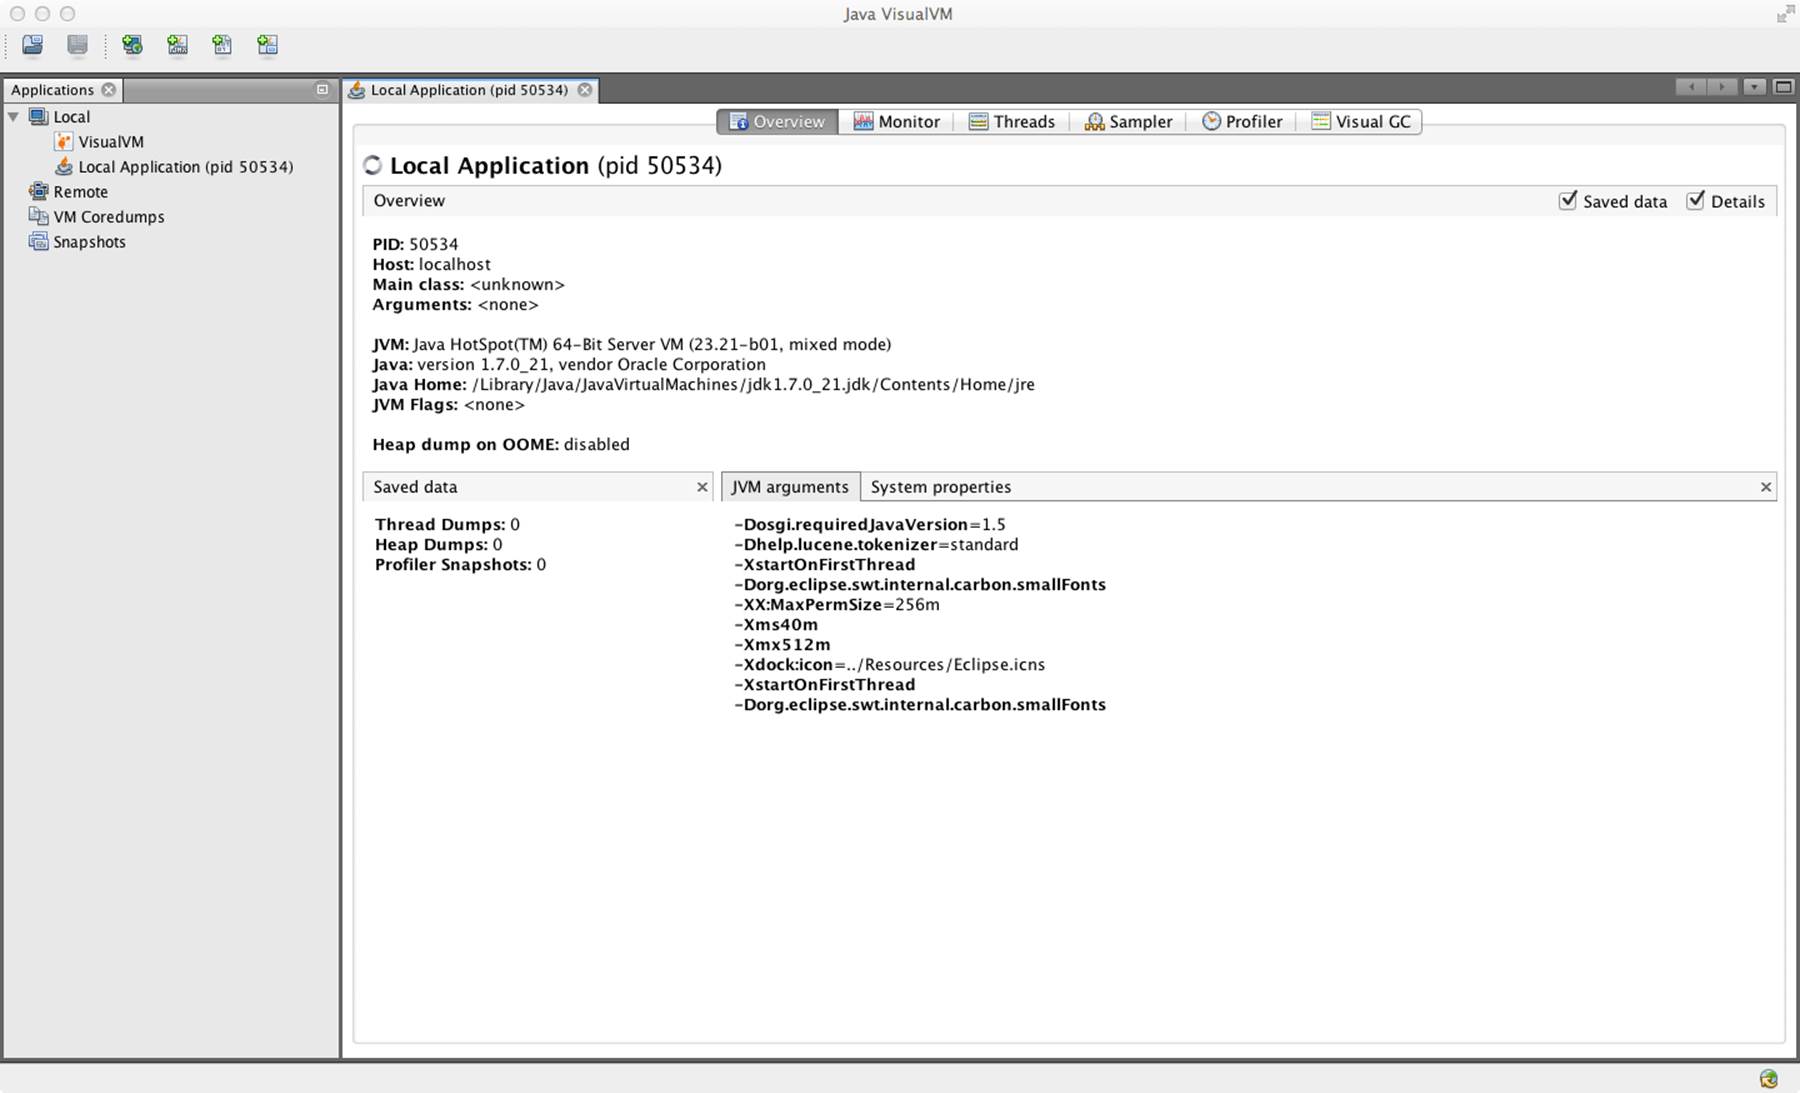
Figure 13-2. Overview tab
In the Monitor tab, as shown in Figure 13-3, graphs and data about the active parts of the JVM system are displayed. This is essentially high-level telemetry data for the JVM—including CPU usage and how much CPU is being used for GC.
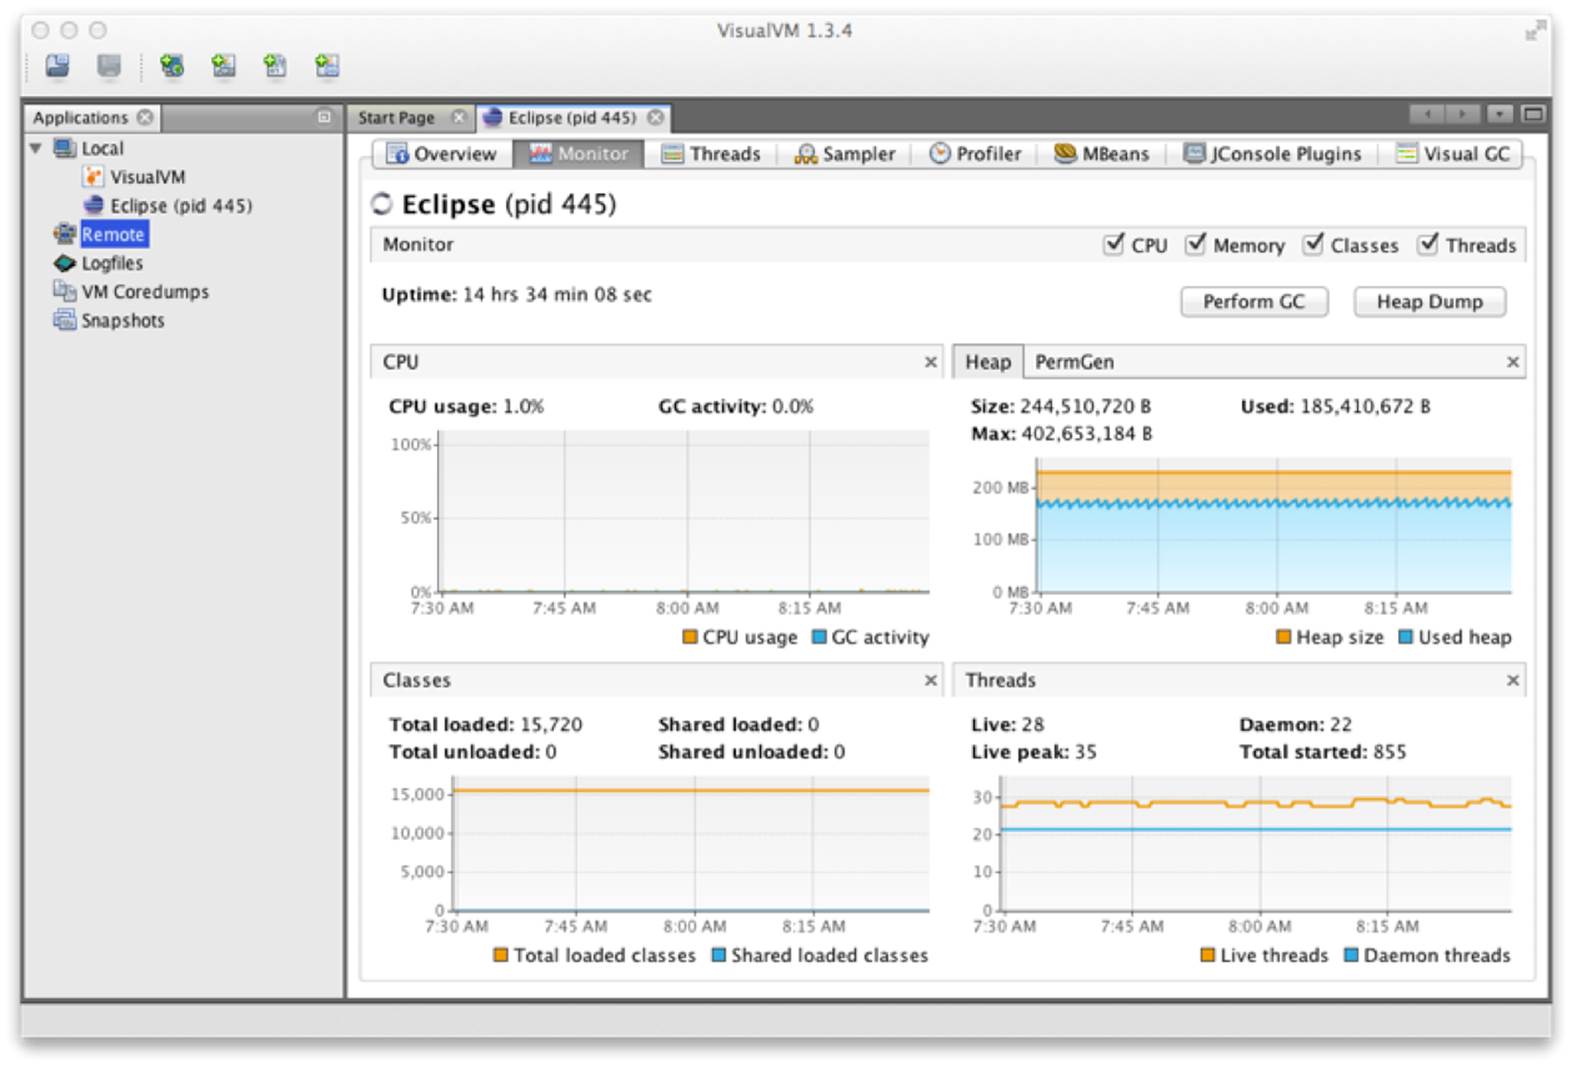
Figure 13-3. Monitor tab
Other information displayed includes the number of classes loaded and unloaded, basic heap memory information, and an overview of the numbers of threads running.
From this tab, it is also possible to ask the JVM to produce a heap dump, or to perform a full GC—although in normal production operation, neither are recommended.
Figure 13-4 shows the Threads tab, which displays data on actively running threads in the JVM. This is displayed as a continuous timeline, with the ability to inspect individual thread details and perform thread dumps for deeper analysis.
This presents a similar view to jstack, but with better abilities to diagnose deadlocks and thread starvation. Note that the difference between synchronized locks (i.e., operating system monitors) and the user-space lock objects of java.util.concurrent can be clearly seen here.
Threads that are contending on locks backed by operating system monitors (i.e., synchronized blocks) will be placed into the BLOCKED state. This shows up as red in VisualVM.
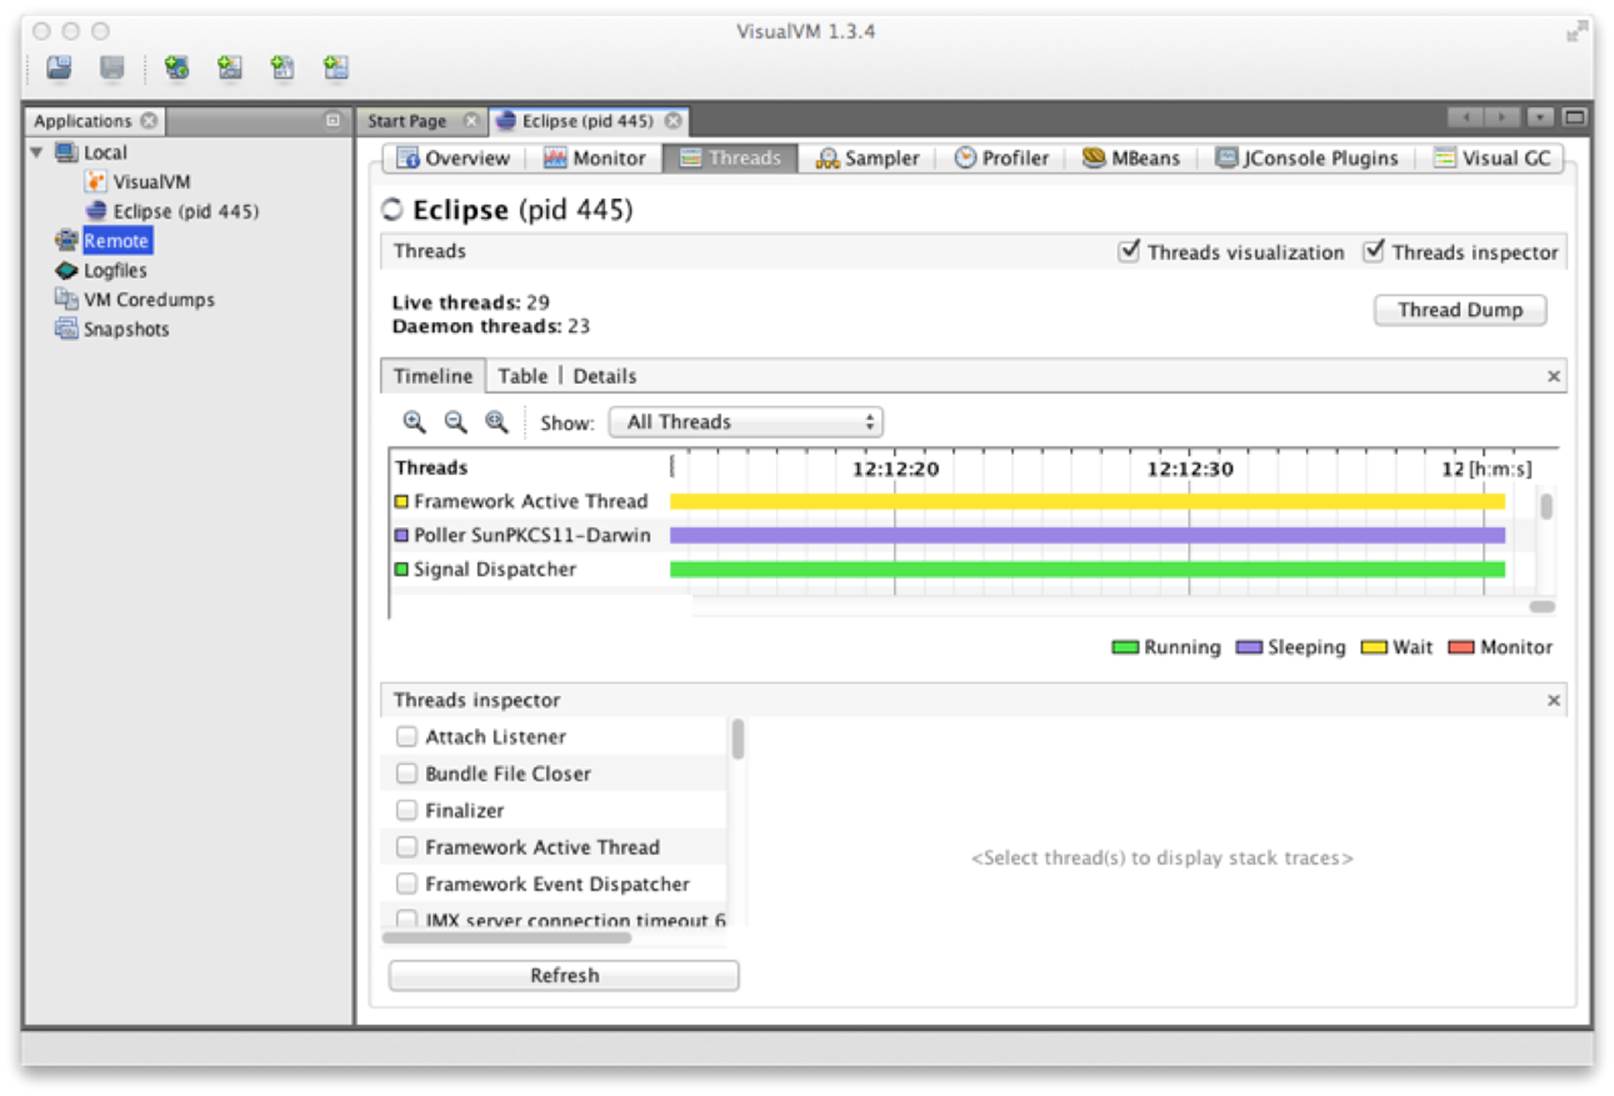
Figure 13-4. Threads tab
WARNING
Locked java.util.concurrent lock objects place their threads into WAITING (yellow in VisualVM). This is because the implementation provided by java.util.concurrent is purely user space and does not involve the operating system.
The Sampler tab, as shown in Figure 13-5, samples either memory or CPU. In the memory mode, it samples object creation—either overall, or JVM only, or even on a per-thread basis.
This enables the developer to see what the most common objects are—in terms of bytes and instances (in a manner similar to jmap -histo).
The objects displayed on the Metaspace submode are typically core Java/JVM constructs.16 Normally, we need to look deeper into other parts of the system, such as classloading to see the code responsible for creating these objects.
jvisualvm has a plug-in system, which can be used to extend the functionality of the framework by downloading and installing extra plug-ins. We recommend always installing the MBeans plugin (shown in Figure 13-6) and the VisualGC plugin (discussed next, and shown in Figure 13-7), and usually the JConsole compatibility plugin, just in case.
The MBeans tab allows the operator to interact with Java management servies (essentially MBeans). JMX is a great way to provide runtime control of your Java/JVM applications, but a full discussion is outside the scope of this book.
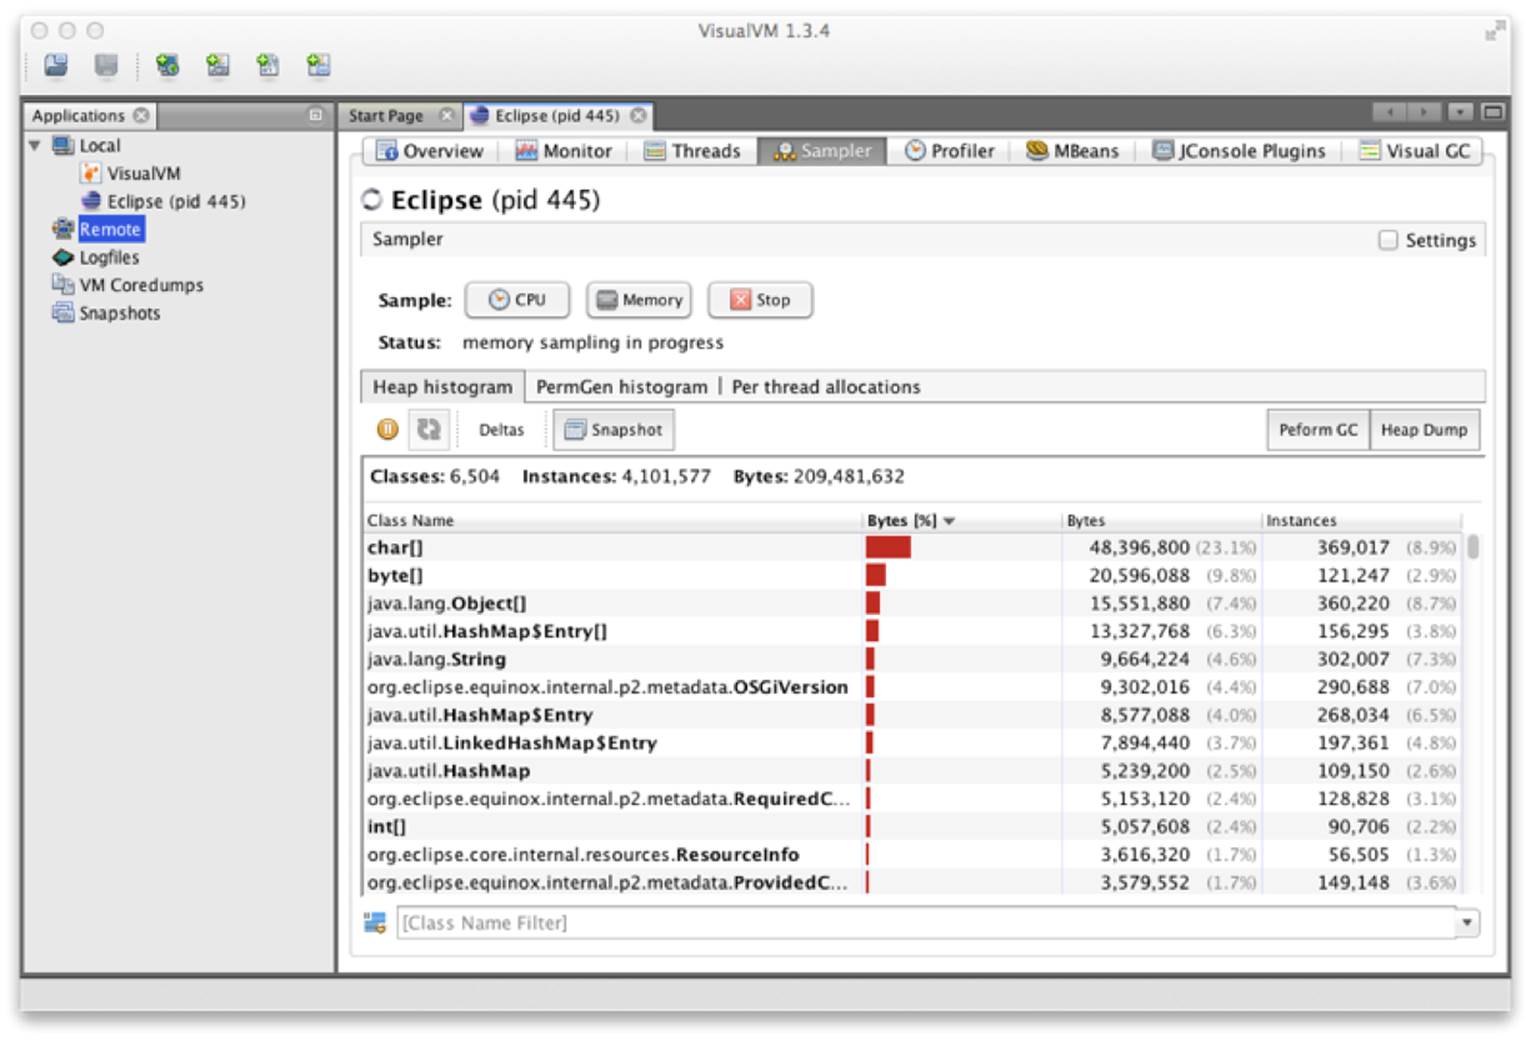
Figure 13-5. Sampler tab
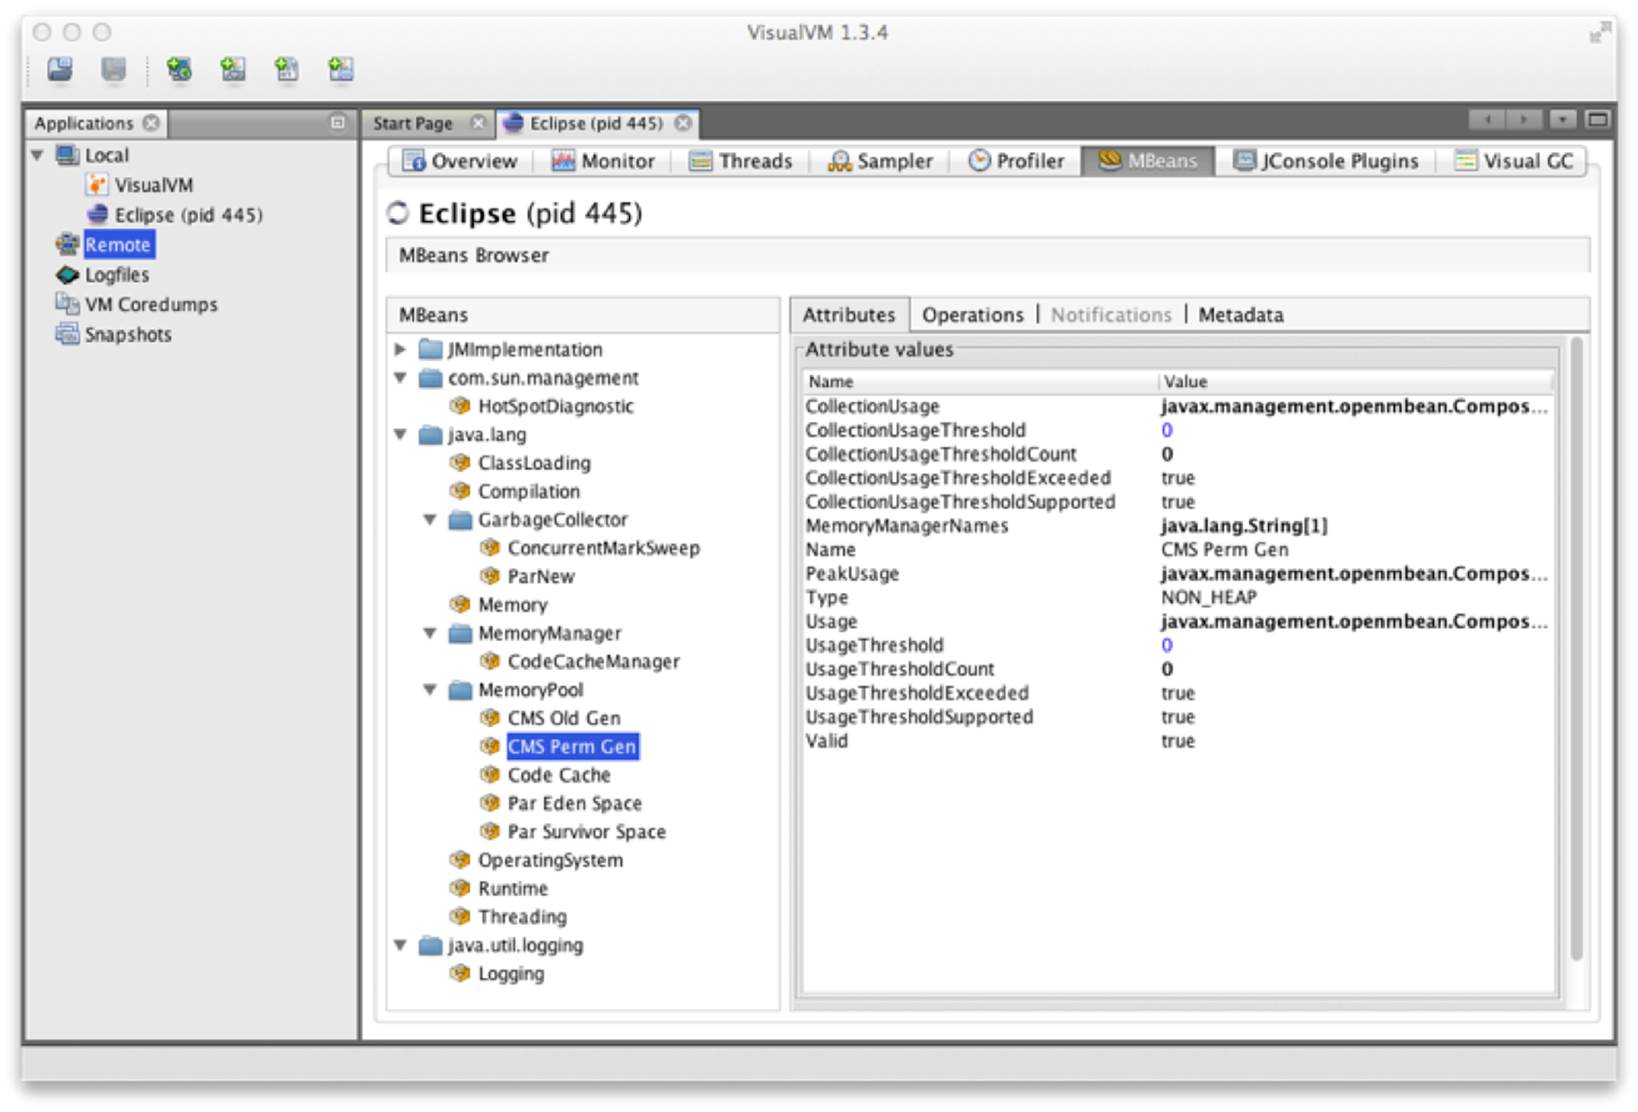
Figure 13-6. MBeans plug-in
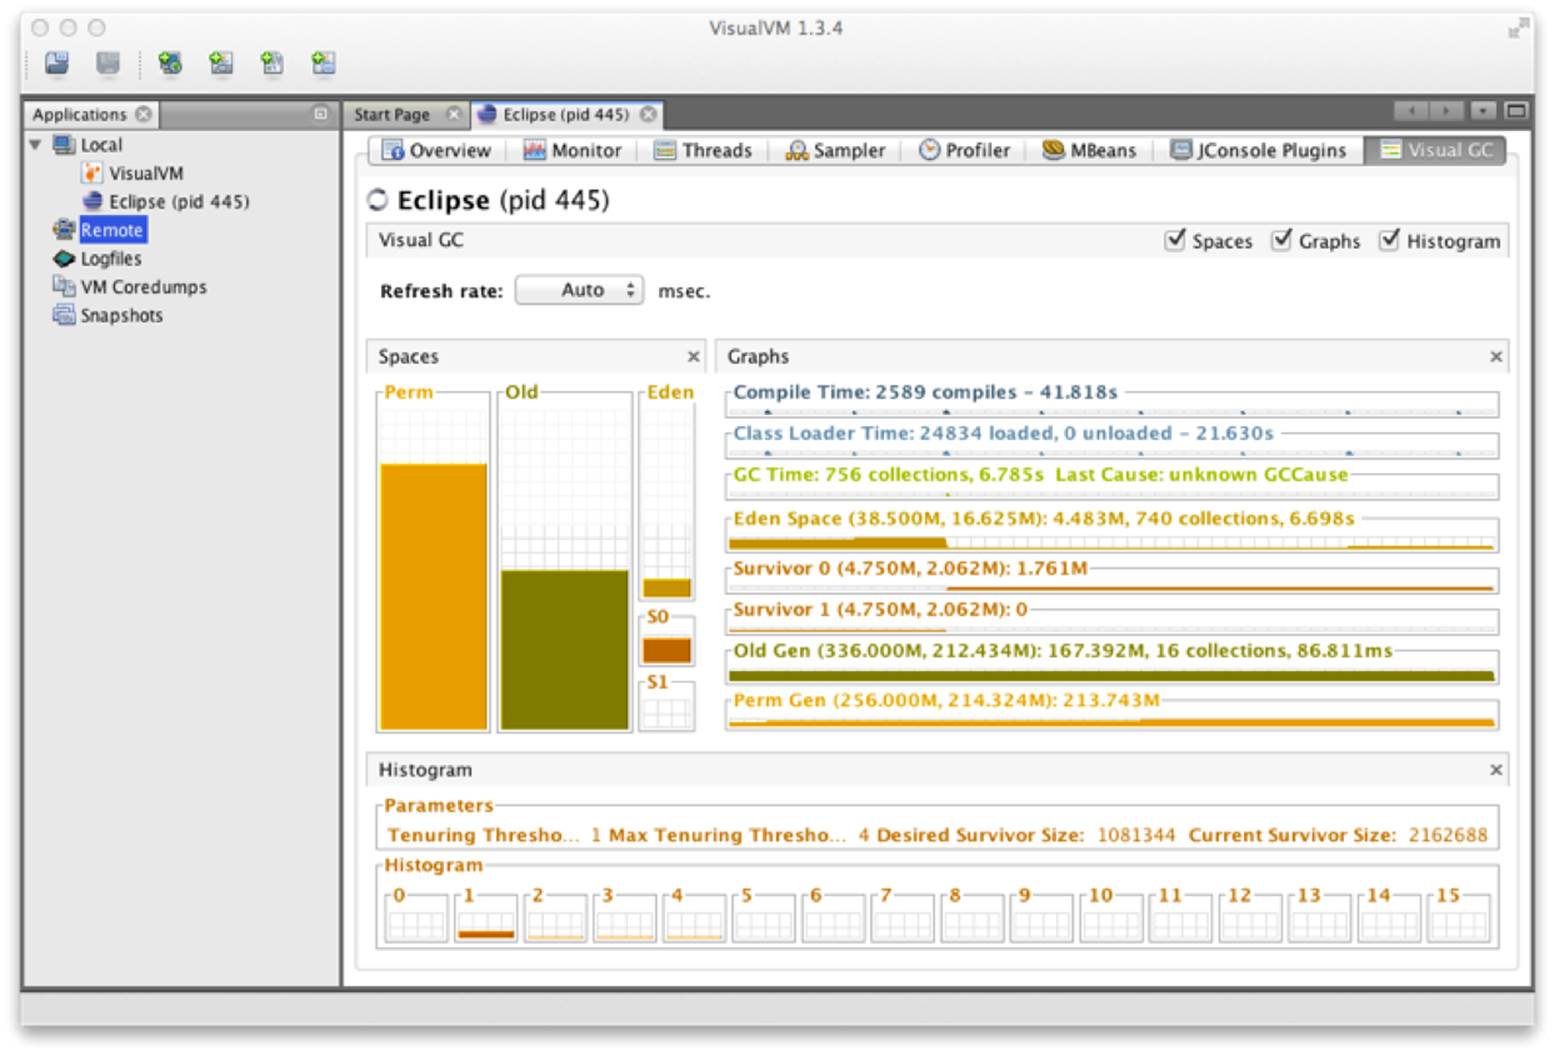
Figure 13-7. VisualGC plug-in
The VisualGC plug-in, shown in Figure 13-7, is one of the simplest and best initial GC debugging tools available. As mentioned in Chapter 6, for serious analysis, GC logs are to be preferred to the JMX-based view that VisualGC provides. Having said that, VisualGC can be a good way to start to understand the GC behavior of an application, and to inform deeper investigations. It provides a near real-time view of the memory pools inside HotSpot, and allows the developer to see how GC causes objects to flow from space to space over the course of GC cycles.
Java 8 Profiles
The original roadmap for Java 8 included Project Jigsaw, a full-featured modularity solution that included a modularization of the platform itself and a move away from a single, monolithic rt.jar.
However, the constraints of the Java 8 release cycle meant that this work could not be completed in time for the intended launch date. Rather than delay the release of Java 8, the project team opted to put off the modularization of the platform until Java 9.
Motivation
Instead of full modularity, Java 8 was updated to include Profiles. These are reduced versions of Java SE, which must satisfy these requirements:
§ They must completely implement the JVM specification.
§ They must completely implement the Java language specification.
§ Profiles are lists of packages. Profiles should usually be identical to the package of the same name in the full Java SE platform, and any exceptions (which should be very rare) must be explicitly called out.
§ A Profile may declare that it is larger than another package. In this case, it must be a strict superset of that Profile.
As a consequence of the second requirement, all Profiles must include all classes and packages that are explicitly mentioned in the Java language specification.
The general purpose of Profiles is to reduce the size of rt.jar. This is helpful for reduced capability platforms, which may not need the full features of Java SE (such as the Swing/AWT graphical toolkits).
Profiles can be seen, in this light, as a step toward modernizing the Java ME platform and harmonizing (or even unifying) it with Java SE. However, it is also possible to conceive of using a Profile as the basis for a server application or other environment, where deploying unnecessary capability is seen as undesirable.
Finally, it is worth noting that a large number of Java’s security vulnerabilities in recent years have been connected to Java’s graphical client features, as implemented in Swing and AWT. By not deploying the packages that implement such features, a modest amount of additional security for server applications is achieved.
Let’s move on to discuss each of the three standard profiles (the Compact Profiles) that Java 8 ships with.
Compact Profiles
Compact 1 is the smallest set of packages that it is feasible to deploy an application on. It contains the packages:
§ java.io
§ java.lang
§ java.lang.annotation
§ java.lang.invoke
§ java.lang.ref
§ java.lang.reflect
§ java.math
§ java.net
§ java.nio
§ java.nio.channels
§ java.nio.channels.spi
§ java.nio.charset
§ java.nio.charset.spi
§ java.nio.file
§ java.nio.file.attribute
§ java.nio.file.spi
§ java.security
§ java.security.cert
§ java.security.interfaces
§ java.security.spec
§ java.text
§ java.text.spi
§ java.time
§ java.time.chrono
§ java.time.format
§ java.time.temporal
§ java.time.zone
§ java.util
§ java.util.concurrent
§ java.util.concurrent.atomic
§ java.util.concurrent.locks
§ java.util.function
§ java.util.jar
§ java.util.logging
§ java.util.regex
§ java.util.spi
§ java.util.stream
§ java.util.zip
§ javax.crypto
§ javax.crypto.interfaces
§ javax.crypto.spec
§ javax.net
§ javax.net.ssl
§ javax.script
§ javax.security.auth
§ javax.security.auth.callback
§ javax.security.auth.login
§ javax.security.auth.spi
§ javax.security.auth.x500
§ javax.security.cert
NOTE
It is important to understand that any profile must at least ship the transitive closure of types referred to by Object. Figure 11-1 shows a partial piece of this graph, and Compact 1 is as close to this minimum bootstrap set as is realistic.
Compact 2 comprises all of Compact 1 plus these additional packages:
§ java.rmi
§ java.rmi.activation
§ java.rmi.dgc
§ java.rmi.registry
§ java.rmi.server
§ java.sql
§ javax.rmi.ssl
§ javax.sql
§ javax.transaction
§ javax.transaction.xa
§ javax.xml
§ javax.xml.datatype
§ javax.xml.namespace
§ javax.xml.parsers
§ javax.xml.stream
§ javax.xml.stream.events
§ javax.xml.stream.util
§ javax.xml.transform
§ javax.xml.transform.dom
§ javax.xml.transform.sax
§ javax.xml.transform.stax
§ javax.xml.transform.stream
§ javax.xml.validation
§ javax.xml.xpath
§ org.w3c.dom
§ org.w3c.dom.bootstrap
§ org.w3c.dom.events
§ org.w3c.dom.ls
§ org.xml.sax
§ org.xml.sax.ext
§ org.xml.sax.helpers
§ javax.xml.crypto.dsig
§ javax.xml.crypto.dsig.dom
§ javax.xml.crypto.dsig.keyinfo
§ javax.xml.crypto.dsig.spec
§ org.ietf.jgss
Compact 3 is the most comprehensive of the Profiles that ships with Java 8. It comprises all of Compact 2 plus these additional packages:
§ java.lang.instrument
§ java.lang.management
§ java.security.acl
§ java.util.prefs
§ javax.annotation.processing
§ javax.lang.model
§ javax.lang.model.element
§ javax.lang.model.type
§ javax.lang.model.util
§ javax.management
§ javax.management.loading
§ javax.management.modelmbean
§ javax.management.monitor
§ javax.management.openmbean
§ javax.management.relation
§ javax.management.remote
§ javax.management.remote.rmi
§ javax.management.timer
§ javax.naming
§ javax.naming.directory
§ javax.naming.event
§ javax.naming.ldap
§ javax.naming.spi
§ javax.security.auth.kerberos
§ javax.security.sasl
§ javax.sql.rowset
§ javax.sql.rowset.serial
§ javax.sql.rowset.spi
§ javax.tools
§ javax.xml.crypto
§ javax.xml.crypto.dom
Despite not being the complete modularity solution we might have wished for, Profiles are a significant step towards our future goals—both for capability-restricted devices and for server-side developers.
Having Profiles actively deployed as part of Java 8 will help inform the conversation around modularity and provide feedback into the development process of Java 9.
Conclusion
Java has changed a huge amount over the last 15+ years, and yet, the platform and community remain vibrant. To have achieved this, while retaining a recognizable language and platform, is no small accomplishment.
Ultimately, the continued existence and viability of Java depends upon the individual developer. On that basis, the future looks bright, and we look forward to the next wave, Java’s 25th birthday, and beyond.
16 Before Java 8, a construct called PermGen was used instead of Metaspace.