Sams Teach Yourself Java in 24 Hours, 7th Edition (2014)
Part VI: Writing Internet Applications
Hour 23. Creating Java2D Graphics
THIS HOUR’S TO-DO LIST:
![]() Set the font and color of text.
Set the font and color of text.
![]() Set up a container’s background color.
Set up a container’s background color.
![]() Draw lines, rectangles, and other shapes.
Draw lines, rectangles, and other shapes.
![]() Draw GIF and JPEG graphics.
Draw GIF and JPEG graphics.
![]() Draw filled and unfilled shapes.
Draw filled and unfilled shapes.
During this hour, you learn how to turn Swing containers—the plain gray panels and frames that hold graphical user interface (GUI) components—into an artistic canvas on which you can draw fonts, colors, shapes, and graphics.
Using the Font Class
Colors and fonts are represented in Java by the Color and Font classes in the java.awt package. With these classes, you can present text in different fonts and sizes and change the color of text and graphics. Fonts are created with the Font(String, int, int) constructor, which takes three arguments:
![]() The typeface of the font as either a generic name (“Dialog,” “DialogInput,” “Monospaced,” “SanSerif,” or “Serif”) or an actual font name (“Arial Black,” “Helvetica,” or “Courier New”)
The typeface of the font as either a generic name (“Dialog,” “DialogInput,” “Monospaced,” “SanSerif,” or “Serif”) or an actual font name (“Arial Black,” “Helvetica,” or “Courier New”)
![]() The style as one of three class variables: Font.BOLD, Font.ITALIC, or Font.PLAIN
The style as one of three class variables: Font.BOLD, Font.ITALIC, or Font.PLAIN
![]() The size of the font in points
The size of the font in points
The following statement creates a 12-point italic Serif Font object:
Font current = new Font("Serif", Font.ITALIC, 12);
If you use a specific font rather than one of the generic ones, it must be installed on the computer of users running your program. You can combine the font styles by adding them together, as in the following example:
Font headline = new Font("Courier New", Font.BOLD + Font.ITALIC, 72);
When you have a font, you call the Graphics2D component’s setFont(Font) method to designate it as the current font. All subsequent drawing operations use that font until another one is set. Statements in the following example create a “Comic Sans” font object and designate it as the current font before drawing text:
public void paintComponent(Graphics comp) {
Graphics2D comp2D = (Graphics2D) comp;
Font font = new Font("Comic Sans", Font.BOLD, 15);
comp2D.setFont(font);
comp2D.drawString("Potrzebie!", 5, 50);
}
Java supports antialiasing to draw fonts and graphics more smoothly and less blocky in appearance. To enable this functionality, you must set a rendering hint in Swing. A Graphics2D object has a setRenderingHint(int, int) method that takes two arguments:
![]() The key of the rendering hint
The key of the rendering hint
![]() The value to associate with that key
The value to associate with that key
These values are class variables in the RenderingHints class of java.awt. To activate antialiasing, call setRenderingHint() with two arguments:
comp2D.setRenderingHint(RenderingHints.KEY_ANTIALIASING,
RenderingHints.VALUE_ANTIALIAS_ON);
The comp2D object in this example is the Graphics2D object that represents a container’s drawing environment.
Using the Color Class
Colors in Java are represented by the Color class, which includes the following constants as class variables: black, blue, cyan, darkGray, gray, green, lightGray, magenta, orange, pink, red, white, and yellow.
In a container, you can set the background color of the component using these constants by calling the setBackground(Color) method like this:
setBackground(Color.orange);
The current color, like the current font, must be set before drawing takes place using the setColor(Color) method. The following code includes a statement to set the current color to orange and draw text in that color:
public void paintComponent(Graphics comp) {
Graphics2D comp2D = (Graphics2D) comp;
comp2D.setColor(Color.orange);
comp2D.drawString("Go, Buccaneers!", 5, 50);
}
Unlike the setBackground() method, which you can call directly on a container, you must call the setColor() method on a Graphics2D object.
Creating Custom Colors
You can create custom colors in Java by specifying their Standard Red Green Blue (sRGB) value. sRGB defines a color by the amount of red, green, and blue present in the color. Each value ranges from 0 (none of that color) to 255 (the maximum amount).
The constructor Color(int, int, int) takes arguments representing the red, green, and blue values. The following code draws a panel that displays light orange text (230 red, 220 green, 0 blue) on a dark red (235 red, 50 green, 50 blue) background:
import java.awt.*;
import javax.swing.*;
public class GoBucs extends JPanel {
Color lightOrange = new Color(230, 220, 0);
Color darkRed = new Color(235, 50, 50);
public void paintComponent(Graphics comp) {
Graphics2D comp2D = (Graphics2D) comp;
comp2D.setColor(darkRed);
comp2D.fillRect(0, 0, 200, 100);
comp2D.setColor(lightOrange);
comp2D.drawString("Go, Buccaneers!", 5, 50);
}
}
Note
sRGB values enable the creation of 16.5 million possible combinations, although most computer monitors offer only a close approximation for most of them. For guidance on whether burnt-midnight blue goes well with medium-faded-baby green, read Sams Teach Yourself Color Sense While Waiting in Line at This Bookstore.
This example calls the fillRect() method of Graphics2D to draw a filled-in rectangle using the current color.
Drawing Lines and Shapes
Drawing shapes such as lines and rectangles is as easy in a Java program as displaying text. All you need is a Graphics2D object to define the drawing surface and objects that represent things to draw.
The Graphics2D object has methods used to draw text with a command such as the following:
comp2D.drawString("Draw, pardner!", 15, 40);
This draws the text “Draw, pardner!” at the coordinates (15,40). Drawing methods use the same (x,y) coordinate system as text. The (0,0) coordinate is at the upper-left corner of the container, x values increase to the right, and y values increase as you go down. You can determine the maximum (x,y) value you can use in a frame or another container with the following statements:
int maxXValue = getSize().width;
int maxYValue = getSize().height;
With the exception of lines, shapes you draw can be filled or unfilled. A filled shape is drawn with the current color completely filling the space taken up by the shape. Unfilled shapes draw a border with the current color.
Drawing Lines
A 2D drawing of an object is created and represents the shape that is being drawn.
The objects that define shapes belong to the java.awt.geom package of classes.
The Line2D.Float class creates a line connecting a beginning (x,y) point and an ending (x,y) point. The following statement creates a line from the point (40,200) to the point (70,130):
Line2D.Float line = new Line2D.Float(40F, 200F, 70F, 130F);
The arguments are followed by the letter F to indicate they are floating-point values. If this was omitted, Java would treat them as integers.
Note
Line2D.Float has a period in the middle of its class name, which differs from most classes you’ve worked with before. That’s because Float is an inner class of the Line2D class, a subject covered in Hour 20, “Using Inner Classes and Closures.”
All shapes except for lines are drawn by calling a method of the Graphics2D class: draw() for outlines and fill() for filled shapes.
The following statement draws the line object created in the previous example:
comp2D.draw(line);
Drawing Rectangles
Rectangles can be filled or unfilled and have rounded or square corners. They are created using the Rectangle2D.Float(int, int, int, int) constructor with these arguments:
![]() The x coordinate at the upper left of the rectangle
The x coordinate at the upper left of the rectangle
![]() The y coordinate at upper left
The y coordinate at upper left
![]() The width of the rectangle
The width of the rectangle
![]() The height
The height
The following statement draws an unfilled rectangle with square corners:
Rectangle2D.Float box = new Rectangle2D.Float(245F, 65F, 20F, 10F);
This statement creates a rectangle with its upper-left corner at the (x,y) coordinate (245,65) with a width of 20 pixels and a height of 10. To draw this rectangle as an outline, you could use the following statement:
comp2D.draw(box);
If you want to make the rectangle filled in, use the fill() method instead:
comp.fill(box);
You can create rectangles with rounded corners instead of square ones by using the RoundRectangle2D.Float class.
The constructor to this class starts with the same four arguments as the Rectangle2D.Float class and adds the following two arguments:
![]() A number of pixels in the x direction away from the corner of the rectangle
A number of pixels in the x direction away from the corner of the rectangle
![]() A number of pixels in the y direction away from the corner
A number of pixels in the y direction away from the corner
These distances are used to determine where the rounding of the rectangle’s corner should begin.
The following statement creates a rounded rectangle:
RoundRectangle2D.Float ro = new RoundRectangle2D.Float(
10F, 10F,
100F, 80F,
15F, 15F);
This rectangle has its upper-left corner at the (10,10) coordinate. The third and fourth arguments specify how wide and tall the rectangle should be. In this case, it should be 100 pixels wide and 80 pixels tall.
The last two arguments to drawRoundRect() specify that all four corners should begin rounding 15 pixels away from the corner at (10,10).
Drawing Ellipses and Circles
You can create ellipses and circles with the same class, Ellipse2D.Float, which takes four arguments:
![]() The x coordinate of the ellipse
The x coordinate of the ellipse
![]() The y coordinate of the ellipse
The y coordinate of the ellipse
![]() Its width
Its width
![]() Its height
Its height
The (x,y) coordinates do not indicate a point at the center of the ellipse or circle, as you might expect. Instead, the (x,y) coordinates, width, and height describe an invisible rectangle inside which the ellipse fits. The (x,y) coordinate is the upper-left corner of this rectangle. If it has the same width and height, the ellipse is a circle.
The following statement creates a circle inside the rectangle at the (245,45) coordinate with a height and width of 5 pixels each:
Ellipse2D.Float cir = new Ellipse2D.Float(
245F, 45F, 5F, 5F);
Drawing Arcs
Another circular shape you can draw in Java is an arc, a partial ellipse or circle. Arcs are created using the Arc2D.Float class, which has a constructor method with many of the same arguments. You draw the arc by specifying an ellipse, the portion of the ellipse that should be visible (in degrees), and the place the arc should begin on the ellipse.
To create an arc, specify the following integer arguments to the constructor:
![]() The x coordinate of the invisible rectangle that the ellipse fits into
The x coordinate of the invisible rectangle that the ellipse fits into
![]() The y coordinate of the rectangle
The y coordinate of the rectangle
![]() The width of the rectangle
The width of the rectangle
![]() The height of the rectangle
The height of the rectangle
![]() The point on the ellipse where the arc should begin (in degrees from 0 to 359)
The point on the ellipse where the arc should begin (in degrees from 0 to 359)
![]() The size of the arc (also in degrees)
The size of the arc (also in degrees)
![]() The type of arc it is
The type of arc it is
The arc’s starting point and size range from 0 to 359 degrees in a counterclockwise direction, beginning with 0 degrees at the 3 o’clock position, as shown in Figure 23.1.
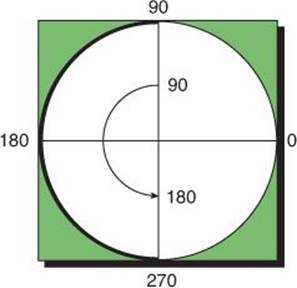
FIGURE 23.1 How arcs are defined in degrees.
The type of arc is specified using class variables: PIE for pie graph slices, CLOSED if the endpoints are connected with a straight line, and OPEN if the endpoints should not be connected.
The following statement draws an open arc at (100,50) that is 120 degrees long, begins at the 30-degree mark, and has a width of 65 and a height of 75:
Arc2D.Float smile = new Arc2D.Float(100F, 50F, 65F, 75F,
30F, 120F, Arc2D.Float.OPEN);
Baking a Pie Graph
To draw this hour to a close, you create PiePanel, a GUI component that displays a pie graph. This component is a subclass of JPanel, a simple Swing container that’s useful as a place to draw something.
One way to begin creating a class is to define the way objects of the class are created. Programs that use the PiePanel class must undertake the following steps:
![]() Create a PiePanel object by using the constructor method PiePanel(int). The integer specified as an argument is the number of slices the pie graph contains.
Create a PiePanel object by using the constructor method PiePanel(int). The integer specified as an argument is the number of slices the pie graph contains.
![]() Call the object’s addSlice(Color, float) method to give a slice the designated color and value.
Call the object’s addSlice(Color, float) method to give a slice the designated color and value.
The value of each slice in PiePanel is the quantity represented by that slice.
For example, Table 23.1 displays data about the status of student loan repayments in the United States for the first 38 years of the program, according to the Office of Postsecondary Education.

TABLE 23.1 U.S. Student Loan Repayments
You could use PiePanel to represent this data in a pie graph with the following statements:
PiePanel loans = new PiePanel(4);
loans.addSlice(Color.green, 101F);
loans.addSlice(Color.yellow, 68F);
loans.addSlice(Color.blue, 91F);
loans.addSlice(Color.red, 25F);
Figure 23.2 shows the result in an application frame that contains one component: a PiePanel created with the student loan data.
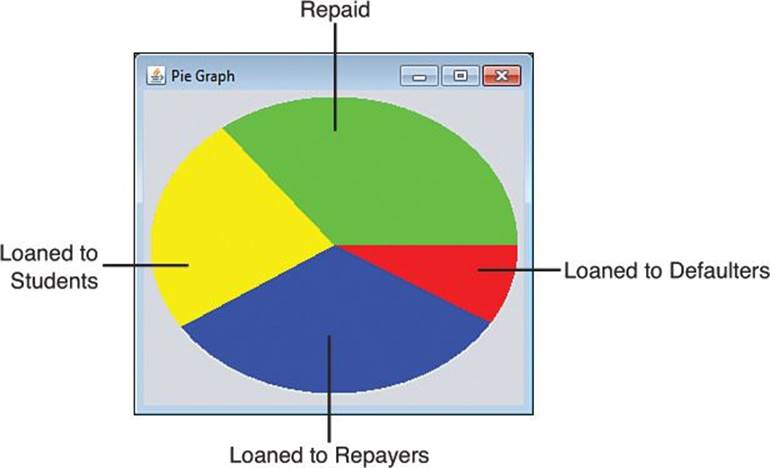
FIGURE 23.2 Displaying student loan data on a pie graph.
When a PiePanel object is created, the number of slices is specified in the constructor. You need to know three more things to be able to draw each slice:
![]() The color of the slice, represented by a Color object
The color of the slice, represented by a Color object
![]() The value represented by each slice
The value represented by each slice
![]() The total value represented by all slices
The total value represented by all slices
A new helper class, PieSlice, is used to represent each slice in the pie graph:
import java.awt.*;
class PieSlice {
Color color = Color.lightGray;
float size = 0;
PieSlice(Color pColor, float pSize) {
color = pColor;
size = pSize;
}
}
Each slice is constructed by calling PieSlice(Color, float). The combined value of all slices is stored as a private instance variable of the PiePanel class, totalSize. There also are instance variables for the panel’s background color (background) and a counter used to keep track of slices (current):
private int current = 0;
private float totalSize = 0;
private Color background;
Now that you have a PieSlice class to work with, you can create an array of PieSlice objects with another instance variable:
private PieSlice[] slice;
When you create a PiePanel object, none of the slices have an assigned color or size. The only things that you must do in the constructor are define the size of the slice array and save the background color of the panel:
public PiePanel(int sliceCount) {
slice = new PieSlice[sliceCount];
background = getBackground();
}
Use the addSlice(Color, float) method to add a slice of the pie to the panel:
public void addSlice(Color sColor, float sSize) {
if (current <= slice.length) {
slice[current] = new PieSlice(sColor, sSize);
totalSize += sSize;
current++;
}
}
The current instance variable is used to put each slice into its own element of the slice array. The length variable of an array contains the number of elements the array has been defined to hold; as long as current is not larger than slice.length, you can continue adding slices to the panel.
The PiePanel class handles all graphical operations in its paintComponent() method, as you might expect. The trickiest thing about this task is drawing the arcs that represent each slice of the pie.
This is handled in the following statements:
float start = 0;
for (int i = 0; i < slice.length; i++) {
float extent = slice[i].size * 360F / totalSize;
comp2D.setColor(slice[i].color);
Arc2D.Float drawSlice = new Arc2D.Float(
xInset, yInset, width, height, start, extent,
Arc2D.Float.PIE);
start += extent;
comp2D.fill(drawSlice);
}
The start variable keeps track of where to start drawing an arc, and extent keeps track of the size of an arc. If you know the total size of all pie slices and the size of a specific slice, you can figure out extent by multiplying the arc’s size by 360 and dividing that by the total of all slices.
All the arcs are drawn in a for loop: After each arc’s extent is calculated, the arc is created and then extent is added to start. This causes each slice to begin right next to the last one. A call to the Graphics2D method fill() draws the arc.
To bring all this together, create a new empty Java file named PiePanel and enter into it the full text from Listing 23.1.
LISTING 23.1 The Full Text of PiePanel.java
1: package com.java24hours;
2:
3: import java.awt.*;
4: import javax.swing.*;
5: import java.awt.geom.*;
6:
7: public class PiePanel extends JPanel {
8: private PieSlice[] slice;
9: private int current = 0;
10: private float totalSize = 0;
11: private Color background;
12:
13: public PiePanel(int sliceCount) {
14: slice = new PieSlice[sliceCount];
15: background = getBackground();
16: }
17:
18: public void addSlice(Color sColor, float sSize) {
19: if (current <= slice.length) {
20: slice[current] = new PieSlice(sColor, sSize);
21: totalSize += sSize;
22: current++;
23: }
24: }
25:
26: public void paintComponent(Graphics comp) {
27: super.paintComponent(comp);
28: Graphics2D comp2D = (Graphics2D) comp;
29: int width = getSize().width - 10;
30: int height = getSize().height - 15;
31: int xInset = 5;
32: int yInset = 5;
33: if (width < 5) {
34: xInset = width;
35: }
36: if (height < 5) {
37: yInset = height;
38: }
39: comp2D.setColor(background);
40: comp2D.fillRect(0, 0, getSize().width, getSize().height);
41: comp2D.setColor(Color.lightGray);
42: Ellipse2D.Float pie = new Ellipse2D.Float(
43: xInset, yInset, width, height);
44: comp2D.fill(pie);
45: float start = 0;
46: for (int i = 0; i < slice.length; i++) {
47: float extent = slice[i].size * 360F / totalSize;
48: comp2D.setColor(slice[i].color);
49: Arc2D.Float drawSlice = new Arc2D.Float(
50: xInset, yInset, width, height, start, extent,
51: Arc2D.Float.PIE);
52: start += extent;
53: comp2D.fill(drawSlice);
54: }
55: }
56: }
57:
58: class PieSlice {
59: Color color = Color.lightGray;
60: float size = 0;
61:
62: PieSlice(Color pColor, float pSize) {
63: color = pColor;
64: size = pSize;
65: }
66: }
Listing 23.1 defines a PiePanel class in lines 1–56 and a PieSlice helper class in lines 58–66. The PiePanel class can be used as a component in any Java program’s GUI. To test PiePanel, you need to create a class that uses it.
Listing 23.2 contains an application that uses these panels, PieFrame. Create a new empty Java file and enter the source code for this class from the listing.
LISTING 23.2 The Full Text of PieFrame.java
1: package com.java24hours;
2:
3: import javax.swing.*;
4: import java.awt.*;
5:
6: public class PieFrame extends JFrame {
7: Color uneasyBeingGreen = new Color(0xCC, 0xCC, 0x99);
8: Color zuzusPetals = new Color(0xCC, 0x66, 0xFF);
9: Color zootSuit = new Color(0x66, 0x66, 0x99);
10: Color sweetHomeAvocado = new Color(0x66, 0x99, 0x66);
11: Color shrinkingViolet = new Color(0x66, 0x66, 0x99);
12: Color miamiNice = new Color(0x33, 0xFF, 0xFF);
13: Color inBetweenGreen = new Color(0x00, 0x99, 0x66);
14: Color norwegianBlue = new Color(0x33, 0xCC, 0xCC);
15: Color purpleRain = new Color(0x66, 0x33, 0x99);
16: Color freckle = new Color(0x99, 0x66, 0x33);
17:
18: public PieFrame() {
19: super("Pie Graph");
20: setLookAndFeel();
21: setSize(320, 290);
22: setDefaultCloseOperation(JFrame.EXIT_ON_CLOSE);
23: setVisible(true);
24:
25: PiePanel pie = new PiePanel(10);
26: pie.addSlice(uneasyBeingGreen, 1350);
27: pie.addSlice(zuzusPetals, 1221);
28: pie.addSlice(zootSuit, 316);
29: pie.addSlice(sweetHomeAvocado, 251);
30: pie.addSlice(shrinkingViolet, 201);
31: pie.addSlice(miamiNice, 193);
32: pie.addSlice(inBetweenGreen, 173);
33: pie.addSlice(norwegianBlue, 164);
34: pie.addSlice(purpleRain, 143);
35: pie.addSlice(freckle, 127);
36: add(pie);
37: }
38:
39: private void setLookAndFeel() {
40: try {
41: UIManager.setLookAndFeel(
42: "com.sun.java.swing.plaf.nimbus.NimbusLookAndFeel"
43: );
44: } catch (Exception exc) {
45: // ignore error
46: }
47: }
48:
49: public static void main(String[] arguments) {
50: PieFrame pf = new PieFrame();
51: }
52: }
The PieFrame class is a simple graphical user interface that contains one component: a PiePanel object created in line 25. The object’s addSlice() method is called 10 times in lines 26–35 to add slices to the pie graph.
When you run the application, PieFrame displays a pie graph showing the population of the 10 most populated countries (in millions), using figures from a December 2013 U.S. Census International Data Base report. In order, they are China (1.350 billion), India (1.221 billion), United States (316 million), Indonesia (251 million), Brazil (201 million), Pakistan (193 million), Nigeria (173 million), Bangladesh (164 million), Russia (143 million), and Japan (127 million).
Because Java only has a few colors defined in the Color class, 10 new ones are created for use here and given descriptive names. The colors are expressed as hexadecimal values—in Java, hexadecimal numbers are preceded by 0x—but they also could have been specified as decimal values in each Color() constructor.
Figure 23.3 shows this application running.
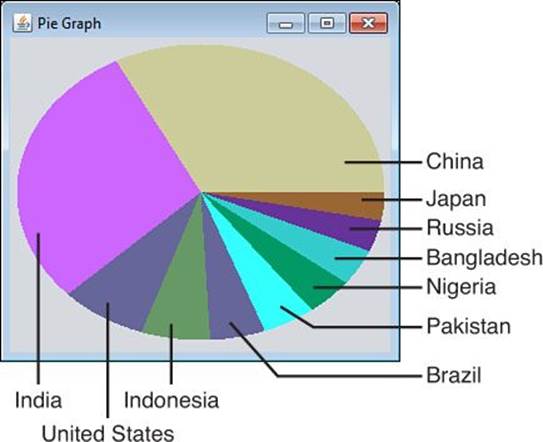
FIGURE 23.3 Displaying population figures in a pie graph.
Note
You can find the current U.S. Census world population figures by visiting www.cadenhead.org/census.
Summary
By using fonts, colors and graphics, you can draw more attention to elements of your programs and make them more compelling for users.
Drawing something using the shapes available with Java might seem like more trouble than it’s worth. However, graphics depicted with polygons have two advantages over graphics that are loaded from image files:
![]() Speed—Even a small graphic, such as an icon, would take longer to load and display than a series of polygons.
Speed—Even a small graphic, such as an icon, would take longer to load and display than a series of polygons.
![]() Scaling—You can change the size of an entire image that uses polygons simply by changing the values to create it. For example, you could add a function to the Sign class that multiplies all (x,y) points in each shape by two before they are created, and it would result in an image twice as large. Polygon images scale much more quickly than image files and produce better results.
Scaling—You can change the size of an entire image that uses polygons simply by changing the values to create it. For example, you could add a function to the Sign class that multiplies all (x,y) points in each shape by two before they are created, and it would result in an image twice as large. Polygon images scale much more quickly than image files and produce better results.
Workshop
Q&A
Q. How can I draw arcs that go clockwise rather than counterclockwise?
A. You can accomplish this by specifying the size of the arc as a negative number. The arc begins at the same point but goes in the opposite direction in an elliptical path. For example, the following statement draws an open arc at (35,20) that is 90 degrees long, begins at the 0 degree mark, goes clockwise, and has a height of 20 and a width of 15:
Arc2D.Float smile = new Arc2D.Float(35F, 20F, 15F, 20F,
0F, -90F, Arc2D.Float.OPEN);
Q. Ellipses and circles don’t have corners. What are the (x,y) coordinates specified with the Ellipses.Float constructor method?
A. The (x,y) coordinates represent the smallest x value and smallest y value of the oval or circle. If you drew an invisible rectangle around it, the upper-left corner of the rectangle would be the x and y coordinates used as arguments to the method.
Q. How can I use XRender with Java?
A. Java supports drawing Java2D graphics with the XRender rendering engine in X11-based environments, typically on Linux. This functionality is off by default and must be turned on using a command-line option: -Dsun.java2d.xrender=true. XRender enables Java programs to employ the capabilities of modern graphics processing units (GPUs).
In NetBeans, you can set these options by choosing Run, Set Project Configuration, Customize. Use the VM Options field to set this option and click OK.
Q. Why do photographers ask you to say “cheese”?
A. The word cheese forces your mouth into a smile, as do the words whiskey, breeze, and money. Words that end with a long “e” generally cause the sides of your lips to curl upwards and your teeth to show.
Another word that photographers sometimes use is grin. Though it doesn’t end in an “e,” it contorts the mouth and the meaning makes people smile.
Quiz
Test whether your font and color skills are MAH-ve-lous by answering the following questions.
1. Which one of the following is not a constant used to select a color?
A. Color.cyan
B. Color.teal
C. Color.magenta
2. When you change the color of something and redraw it on a container, what must you do to make it visible?
A. Use the drawColor() method.
B. Use the repaint() statement.
C. Do nothing.
3. What do the initials RGB stand for?
A. Roy G. Biv
B. Red Green Blue
C. Lucy in the Sky with Diamonds
Answers
1. B. The primary color of the Jacksonville Jaguars, teal, has gone unrepresented in Color.
2. B. The call to repaint() causes the paintComponent() method to be called manually.
3. B. If C. were the right answer, you could use colors that would only be visible years later during flashbacks.
Activities
To further explore the spectrum of possibilities when using fonts and color in your programs, do the following activities:
![]() Create a version of the PieFrame class that takes color values and pie slice values as command-line arguments instead of including them in the source code of the application.
Create a version of the PieFrame class that takes color values and pie slice values as command-line arguments instead of including them in the source code of the application.
![]() Create an application that draws a stop sign on a panel using colors, shapes, and fonts.
Create an application that draws a stop sign on a panel using colors, shapes, and fonts.
To see Java programs that implement these activities, visit the book’s website at www.java24hours.com.