JavaScript and jQuery for Data Analysis and Visualization (2015)
PART I The Beauty of Numbers Made Visible
Chapter 1 The World of Data Visualization
What's in This Chapter
· Overview of chart design options
· Comparison of different business applications for data visualization
· Rundown of technological advancements that have made data visualization what it is today
When thinking about data visualization, it's hard to resist the comparison to natural metamorphosis. Consider raw data as the caterpillar: functional, multi-faceted, able to get from here to there, but a little ungainly and really appreciated only by a select few. After data is transformed via visualization, it becomes the butterfly: sleek, agile, and highly recognizable to the point of inspiring and evoking an emotional response. The world of data visualization is an ecosystem unto itself, constantly spawning new nodes of details that—under the proper nourishing conditions—evolve into relatable depictions that consolidate concepts into an understandable, and hopefully compelling, form.
And where does the web professional fit in this metaphor? Why, they are the spinners and caretakers of the cocoon that transforms raw numbers into meaningful representation, of course. Putting the linguistic paraphrasing aside, web designers and developers are a vital component in visualizing data. Naturally, the current and evolving technological landscape has made this role possible—and increasingly efficient.
Overall, JavaScript and jQuery for Data Analysis and Visualization serves as a practical field guide to the robust world of data visualization, from the acquisition and nurturing of data to its transfiguration into the optimal visual format. This chapter is intended to provide an overview of the present environment, highlighting its capabilities and limitations and discussing how you, the web professional, are a key player in visualizing data.
Bringing Numbers to Life
Appreciating numeric data can be a challenge. Data visualization with relational graphics and evocative imagery helps make raw data meaningful. But before you can transform the data into a meaningful representation, you have to get it first.
Acquiring the Data
The data sphere is enormous and growing dramatically, if not exponentially, every day. Data is streaming in from everywhere—and when you consider that the Mars Rover, Curiosity, continually sends its data findings back to Earth, you understand that “everywhere” is no exaggeration.
With the tremendous amount of data already available, its acquisition is often just a matter of logistics. If the information is in a non-digital form—that is, written records—it will need to be transcribed into the proper format. Should the desired data be accessible digitally, it may need to be converted from its current structure to one compatible with the display or visualization application.
When your information is in the proper format, you next need to ensure it is exactly the data you need and nothing more. The wealth of data available today makes targeting your data selection, typically through a process known as filtering, pretty much a requirement in all situations. Even when organizations fine-tune their data input from the beginning, changes in the sample or desired output over time will force a filtering adjustment.
Why is it so important to restrict your data stream? One clear reason is processing efficiency. Working with an overload of unnecessary information increases application execution time—which corresponds directly to increased bandwidth and, thus, costs. Additionally, filtering makes raw data more meaningful. Focused information is easier to analyze and also more easily digested by end users.
Visualizing the Data
In a sense, the most difficult aspect of data visualization is deciding exactly how the information should be depicted. The web designer must select the optimum representation that communicates the data in the clearest, most desired manner with the highest degree of impact. More importantly, the representation should be a discovery tool that leads the user to meaningful insights. Here's an incomplete list of available formats:
· Area chart
· Bar chart
· Bubble chart
· Candlestick chart
· Gauge chart
· Geographic chart
· Heat map
· Hierarchical edge bundling
· Infographics
· Line chart
· Marimekko chart
· Network node map
· OLHC (Open-high-low-close) chart
We've really just scratched the surface with ways data can be presented. Most of these formats can be shown in either 2D or 3D. You can include interactive elements and animation to add dimensions to the data. But be careful to balance these bells and whistles with meaningful data. No amount of eye candy is worth compromising the representation of information.
NOTE It's important to realize that a key factor in visualization is intent. Raw data on almost every subject can be interpreted in any number of ways. What message is intended to be communicated should be among the first decisions made when beginning the process of representing data visually.
There are other primary options to consider as well. Do you expose the underlying data or not? If so, are the numbers always visible or are they visible only when some interaction occurs, such as when the viewer's mouse hovers over a data point? Is the initial visualization all there, or does the online version allow the user to drill down for more details? Is animation used to represent a dynamic change? Is there other interactivity available, such as horizontal scrolling along a timeline or zooming into it?
Then, of course, there is styling. With simple bar and pie charts, you'll not only need to decide which colors represent which elements, but also the size, color, style, and font to be applied for labels and legends, if any—yet another choice. Many such selections will be governed by other factors, such as the creating organization's branding or in-house standards; however, just as many will have no such foundation to work from, and the designer's vision will become paramount.
Moving beyond the basics of charting primitives, the visualization designer can choose to include graphics. Not only can background images frame a presentation—both literally and thematically—but symbols can be used as data points, like logos pinned in a map of third-quarter sales. An entire field of data visualization—infographics—is devoted to the combination of information and visual imagery.
The truth is that the web professional's current options for depicting data are a bounty of riches. Although the possibilities may appear to be overwhelming, it's up to the visualization designer to identify the optimum representation and bring it into reality.
Simultaneous Acquisition and Visualization
The world of data visualization doesn't just consume existing data: New data is constantly being added to the stores, even in real time. Information can be collected directly through an HTML form on a website and incorporated into the representation programmatically. One of the most common examples of this is an online poll, such as the one shown in Figure 1.1. After a site visitor has chosen his or her desired response and clicked Vote, the current relative standing of all entries, including the one just entered, is displayed.
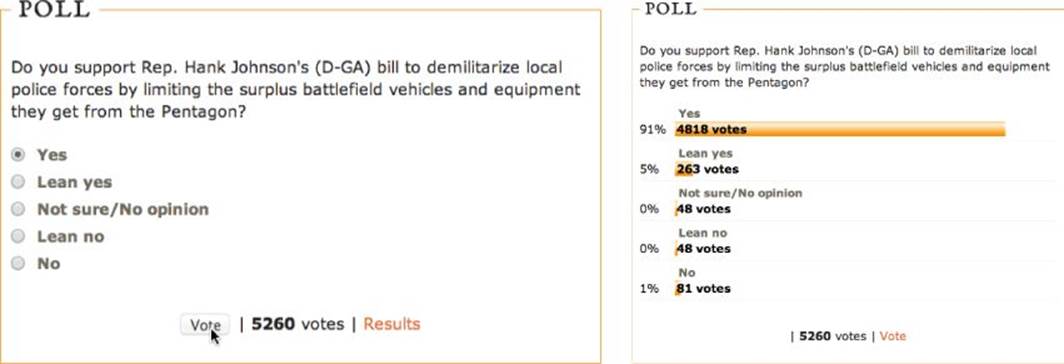
Figure 1.1 Some polls allow the user to instantly see the current results.
Source: www.dailykos.com/story/2014/08/18/1322337/-Cheers-and-Jeers-Monday
Collecting live data has a number of challenges, but the recent advances made by the widespread acceptance of HTML5 have ameliorated many of them. When combined with a few key JavaScript libraries, it is now possible to use advanced form elements, such as slider controls, across the full spectrum of modern browsers.
Acquiring the data in real time is just the first step. The web developer is also responsible for validating and standardizing the data. Validation is critical in two ways: first, to ensure that all required information is supplied, and second, to verify that the data is in the proper format. Naturally, if you're trying to find out where your clientele is based, you can't if the requested postal code is left blank. Likewise, if the postal code is in the wrong format, such as a four-digit entry for a U.S. address, the data is worthless. Both of these issues can be corrected by proper validation, whether handled on the client-side with JavaScript, server-side via PHP or another server language, or some combination of the two.
Standardized data is just as important and typically applies to time and date details. There are numerous ways to enter a date: March 10, 2011 could be 03/10/11, 10/03/11, or 11/03/10 depending on whether you're in the United States, Australia, or China, respectively. To make sure the intended date is collected correctly, the entered information will need to be standardized to a format the visualization application recognizes before it is saved. Read Chapter 6 for more information about data validation.
Applications of Data Visualization
So there's all this wonderful data out there, just waiting to be brought to life by this almost magical transformative process. But why should it? The question really is cui bono? Who benefits? In a sense, the answer is everyone. Whenever information is made clearer and more understandable, it's better for all. But the web professional doesn't get paid by “everyone,” so let's narrow the scope and focus on the key groups who stand the most to gain from data visualization.
Uses in the Public Sector
Groups in the public sector include all levels of government (those in it and those trying to get in it), as well as police, military, transportation agencies, and educational and healthcare facilities. Just a few folks, right? Oh, and let's add philanthropy and philanthropic projects, a.k.a. charities, into the mix, just for fun.
All these organizations have a key interest in discovering what is happening (the data) and then conveying that information internally to others in their own group and/or externally to the broader public (the visual). Many such efforts are mandated and essential to the organization's existence. Take, for example, the U.S. census. The data is collected on a massive scale every 10 years—by law—and then impacts multiple facets of American life such as state and regional funding and, of course, congressional representation. The U.S. Census Bureau maintains a treasure trove of the aggregate data, now visually accessible to everyone through its online presence at www.census.gov. Not only are there government-sanctioned representations of the collected census information, like the map inFigure 1.2, but the site also makes APIs available (api.census.gov) for public web developer access.
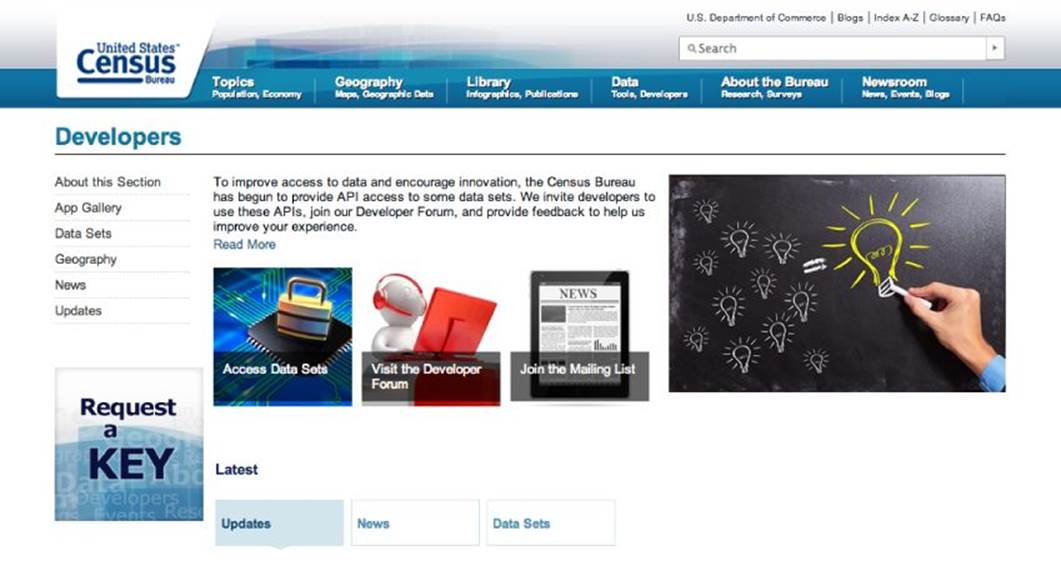
Figure 1.2 You'll need to request a no-charge digital key to access the APIs from api.census.gov.
Business-to-Business and Intrabusiness Uses
If the business of business is business, how do you do business? Mostly through marketing, whether you're a vendor targeting another company or one department lobbying internally for increased resources. And the heart of marketing is persuasion—which is often bolstered, if not solely accomplished, by making your case through the compelling presentation of data.
As with the public sector, many such presentations are required. Look through any annual report to see the latest encapsulation of the company's standing, graphically depicted in quickly graspable charts. Today, creating an online report is standard practice. Similar data visualizations are undertaken daily in department and division meetings to plot sales progress, reveal public reaction to products, and adjust business direction.
There are significant data visualization opportunities for the web designer within the business-to-business arena. Most of this type of work, like other website or intranet work, will be handled by an internal team. Cultivating such skills would definitely add value to any web professional's resume.
Additionally, a wide variety of data visualizations are used internally within organizations. These tools help businesses grapple with and understand their own data.
Business-to-Consumer Uses
Obviously, marketing plays as big a role in the business-to-consumer realm as it does in business to business, if not more. Sharp, effective advertising, as well as other forms of marketing, are pretty much required for a company's message to cut through the omnipresent media noise. Often a clearly defined representation of data can make the difference.
Although there are plenty of uses for pie charts, stock charts and other fundamental data representations in business-to-consumer communications, infographics are seen far more frequently. Infographics combine data and information in a visually engaging manner. Sometimes, the data is represented straightforwardly, such as the percentage values shown in the infographic from HealthIT.gov (see Figure 1.3), or more graphically, as shown in the infographic from the CDC (see Figure 1.4).
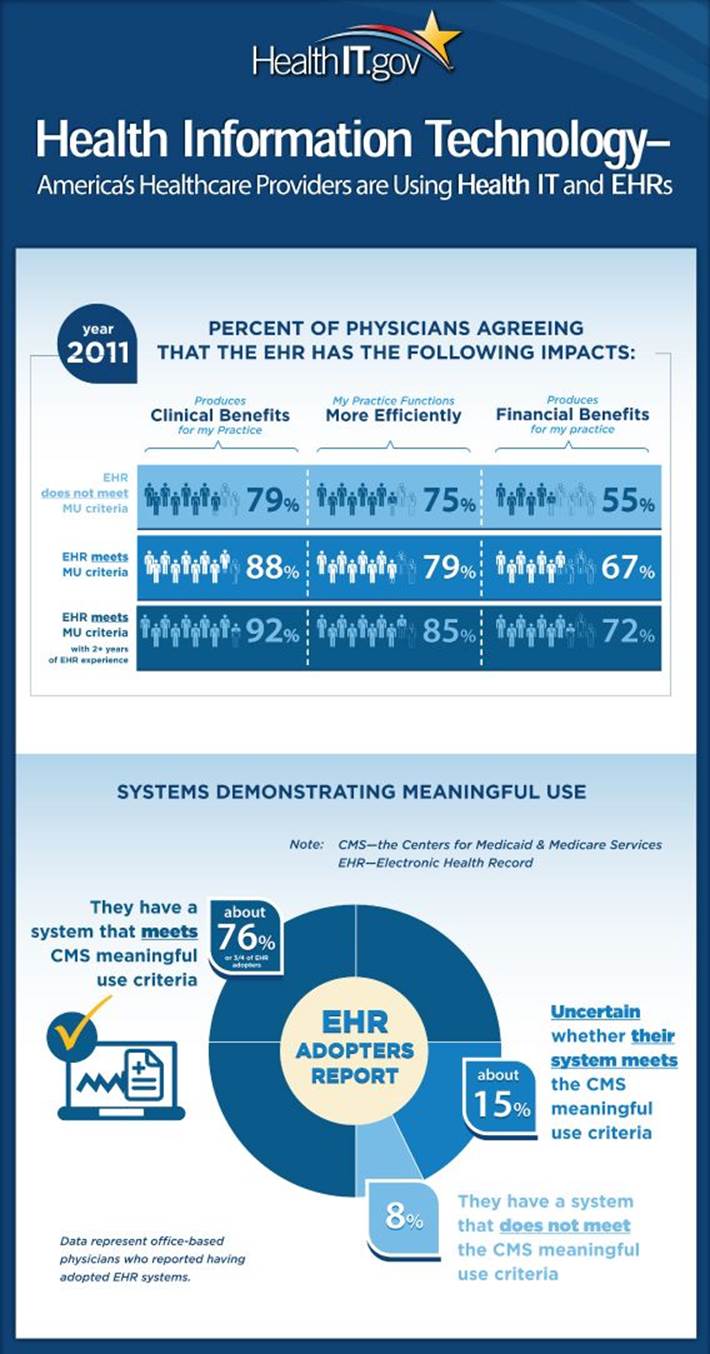
Figure 1.3 The icons in this infographic graphically reinforce the numeric percentages.
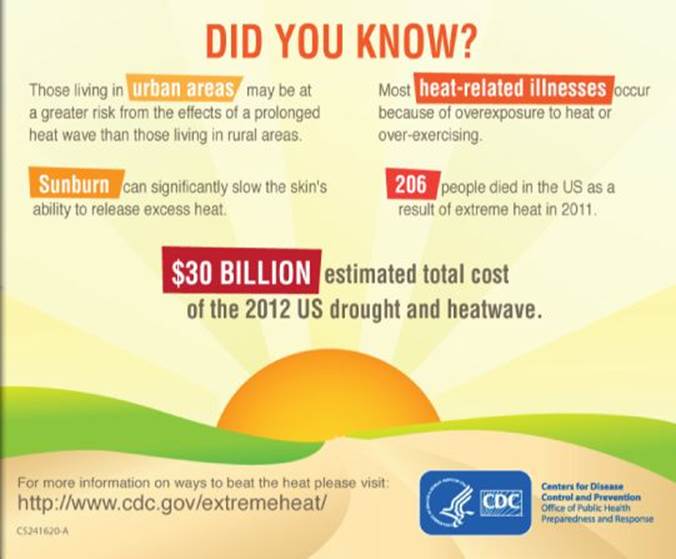
Figure 1.4 Infographics are adept at combining highlighted key terms, such as “urban areas” and “heat-related illnesses” with numeric data, as shown in this infographic from the CDC.
Infographics is a tremendously rich area with an almost endless range of possibilities; because of the openness of the format, it can be a designer's playground. To learn more about creating this particular type of data visualization, see Chapter 16.
Web Professionals: In the Thick of It
As noted in this chapter's introduction, web professionals are at the heart of data visualization. Consider that it first takes someone with web savvy to access and translate the data into a usable form. Then, if the data collection is to be ongoing, one or more forms have to be set up correctly online to make sure the needed data is acquired, valid, and—where necessary—standardized. Finally, someone with a working knowledge of browser-compatible languages must create the visual display of the data so that it can be viewed on the Internet.
Control of Presentation
Web professionals—across the spectrum of their functionality—are responsible for this growing sphere of communication. Let's break down the process from their perspective:
· A web developer with server-side skills is needed to handle the back-end processing of data to make it accessible.
· A JavaScript coder is responsible for filtering, sorting, and manipulating the data to prepare it for representation. This role could also be handled server-side or in combination with client-side technology.
· An HTML coder builds any required forms to allow interactive data addition, often with JavaScript libraries for validation.
· One or more web designers create the look-and-feel of all data-related pages, including styling the output of the visualized data.
· A web coder, leveraging his or her own knowledge of JavaScript, combined with core frameworks and data visualization libraries, displays the data in a representational format.
Although all the described tasks could possibly be fulfilled by a single individual, it's just as likely that these tasks are handled by a group working closely together. Whether it's done by one (very busy) person or a networked team spread around the world, the important take-away is that web professionals own the data visualization process from top to bottom.
TIP Curious as to what other web professionals have been doing in the field of data visualization? There are a number of sites online that provide a bevy of examples. One of the best that we've found is at http://visualizing.org/, which not only has compelling galleries but also a robust community dedicated to data and design.
What Tech Brings to the Table
Web professionals are dependent on robust web software to accomplish any aspect of their work, but the need for power tools is particularly vital to properly handle data visualization. Recent years have witnessed a sea change in online technology that has greatly expanded the possibilities for representing data. Although there are many contributing factors, the following discussion focuses on three key ones:
· Faster, more efficient JavaScript engines in browsers
· The rapid proliferation of HTML5 compatible browsers
· The increased availability of JavaScript frameworks and libraries
Faster and Better JavaScript Processing
For the last several years, browser makers have identified JavaScript processing as a key battleground and have pursued faster JavaScript engines with great vigor. The bar graph in Figure 1.5 compares runs of the SunSpider benchmark, created and maintained byWebKit.org, for older browsers (Internet Explorer 7 and Safari 3) against the latest—as of this writing—browsers, Internet Explorer 10 and Safari 6. In this chart, smaller is better, and you can see there has been a radical shift in browser efficiency. The values for the earlier browser versions come from a June 2008 article that appeared on ZDNet (http://www.zdnet.com/blog/hardware/sunspider-javascript-benchmark-and-acid-3-compatibility-charts-firefox-3-0-rc-3-and-opera-9-50-added/2090); we ran the benchmarks on the newer browsers ourselves.
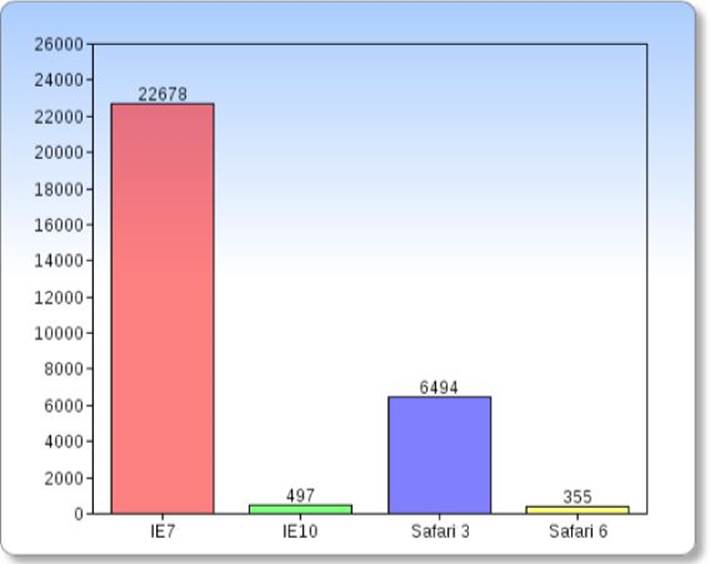
Figure 1.5 The lesser values indicate faster and more desirable processing times by JavaScript engines.
The increase in JavaScript processing functionality has had a direct effect on the realm of data visualization, in both the analysis and the rendering phase. The JavaScript engine handles raw numeric computations as well as on-screen drawing, either directly or in conjunction with the hardware renderer. This combination greatly increases the viability of direct browser data visualization, without resorting to a third-party plug-in, like Adobe Flash.
Rise of HTML5
A faster engine isn't much good without fuel to run it—luckily, a load of high-octane HTML5 was delivered just in time. The roots of HTML5 can be traced back to 2004 and the Web Hypertext Application Technology (WHAT) Working Group—but adoption was glacially slow. At one point, the W3C had actually slated the web language for final recommendation status in 2022! The introduction of smartphones, most notably Apple's iPhone, changed all that. The device's embrace of HTML5 in lieu of Flash triggered a feature adoption race among all major browsers, with HTML5 becoming the current standard for mobile devices.
Why is HTML5 so important to data visualization? First, let me clarify that this latest version of the web's primary language brings along two closely knit partners: CSS3 and advanced JavaScript APIs. The enhanced capabilities brought by these three related technologies have truly revolutionized web design and development overall. The following are a few key features that have been especially beneficial for data visualization:
· The <canvas> tag: Include a seemingly blank <canvas> element on your HTML5 page and suddenly you have access to the full palette of graphics—including primitives (such as circles and rectangles), plotted points with connected lines, gradients, text, imported images, and much more—all drawn by JavaScript, live. What's more, you have the option to make whatever you put on your canvas interactive, capable of being changed by the user (see Figure 1.6).
Figure 1.6 HTML5 brings support for advanced functionality such as the <canvas> tag, which opens the door to interactive charting among many other data visualization benefits.
· SVG: Although we've had limited SVG support for some time, its usage has greatly expanded with HTML5. This canvas alternative also enables you to create rich graphics on the web.
· Web fonts: After being limited to a handful of system fonts common to PC and Mac, web designers everywhere were hungry for the possibilities brought by browser support for web fonts. Now, designers can use an ever-growing family of decorative and other font faces to give the impact their infographics and other data visualizations need—while remaining search engine compatible and screen reader friendly.
· Advanced form elements: Because we were sick and tired of working with the extremely limited set of form elements, this one was pretty high on our personal wish list. HTML5 brings a great number of new input types (such as email, tel, and url) that makes it much easier for users to correctly enter the proper data, especially on mobile devices. In addition, new form controls such as the range slider bring an enhanced user experience into play. Browser support for these elements is not quite at the same level as some of the other HTML5 features, but it does seem to get better with each version release.
TIP Perhaps the best resource for checking whether HTML5 specifics can be incorporated into a web page is http://caniuse.com/. This site tracks each of the HTML5, CSS, and JavaScript API features and their current (as well as past and future) browser version support. We consider Can I Use an essential stop in the planning stage of any new site or application.
Lowering the Implementation Bar
To complete our car metaphor, let's agree that we have now have a powerful vehicle (our highly efficient JavaScript engine) and a super fuel (widely supported HTML5). Does anyone know how to drive this thing? Thanks to the popularity and ease of use of JavaScript-related libraries, specifically those written in jQuery, the answer for an increasing number of web professionals is a resounding “Yes!”
It's true that anyone with sufficient JavaScript know-how could manage the requisite data acquisition, conversion, and rendering required in the data visualization life cycle. However, armed with core jQuery and targeted libraries, such a process becomes much more efficient and successful.
In fact, if there is a single raison d'etre for this book, it's the existence and proliferation of these JavaScript libraries that will be leveraged throughout this title. In addition to making it easier to bring the real-world data numbers to life in the first place, most sophisticated JavaScript libraries also make it much more straightforward to modify controlling parameters and even the data itself, all on the fly. This added degree of flexibility strengthens the case for taking advantage of code libraries such as Google Charts, D3, Raphaël and jqPlot to name just a few covered in this book and available right now to be put to work.
Summary
Data visualization is the process of acquiring data, analyzing it, and displaying the resulting information in a graphical fashion. The entire procedure itself can run the gamut from the extremely straightforward, such as creating a pie chart from values in a spreadsheet, to the exceedingly complex, as when building a sophisticated infographic distilling reams of census and geographic data. When thinking about the world of data visualization, keep these key points in mind:
· Visualizing data makes it easier for a wider audience to quickly grasp the relative nature of selected data.
· There are a tremendous number of options when it comes to deciding which form of representation your information should take. The job of the visualization designer is to realize the optimum choices for communicating the data's message.
· Data can be collected and displayed visually in real time through the use of HTML forms and JavaScript coding.
· The primary creators of data visualizations are the public sector and the business-to-business, intrabusiness, and business-to-consumer markets.
· Advances in browser JavaScript processing, HTML5 browser support, and the proliferation of related JavaScript libraries lay the technological foundation for data visualization.
All materials on the site are licensed Creative Commons Attribution-Sharealike 3.0 Unported CC BY-SA 3.0 & GNU Free Documentation License (GFDL)
If you are the copyright holder of any material contained on our site and intend to remove it, please contact our site administrator for approval.
© 2016-2026 All site design rights belong to S.Y.A.