WebGL Textures & Vertices: Beginner's Guide (2015)
Crop a Texture Map
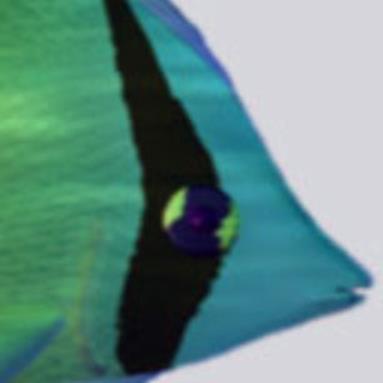
Cropped Butterfly Fish
Cropped Lighthouse
This section demonstrates how to display a specific cropped section of an image, across a mesh. We explain how to convert from pixel crop coordinates to texel crop coordinates. We modify texel coordinates in the vertex texel array. The projects display either the cropped Butterfly fish graphic or the cropped lighthouse photograph. However the information in this section applies to any WebGL acceptable graphic.
Include the JavaScript files GLControl.js, GLEntity.js, and GLSquareCrop.js in a Web page. The file GLSquareCrop.js defines the GLSquareCrop class. The constructor requires two parameters. The first parameter is a String path to an image file. The second parameter is a boolean value.
Class GLSquareCrop declares custom cropping coordinates for either the lighthouse photograph lighthouse.jpg, or the Butterfly fish graphic fish.jpg. Assign the first parameter assets/lighthouse.jpg and the second parameter true to see a cropped version of the lighthouse photograph. Assign the first parameter assets/fish.jpg and the second parameter false to see a cropped close up of the fish's face.
The following illustration demonstrates how to convert a cropped section of an image from pixel coordinates to texel coordinates. The black text on white background represent values from the original image. The white text on translucent blue background represent values for the cropped image. The values between parenthesis represent pixels. The values between square brackets represent texels.
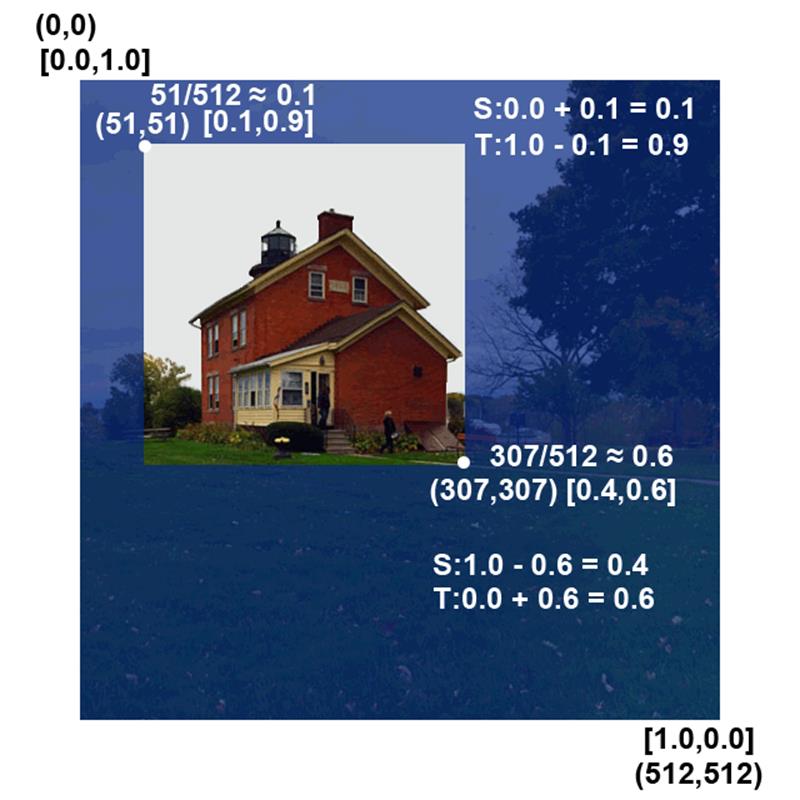
Diagram 8: Convert Crop Pixels to Texels
Convert Pixel Crop Coordinates to Texel Values
Begin with the original dimensions of an image in pixels, and a rectangle to crop. Define the rectangle with pixel coordinates to define the upper left and lower right corners.
To convert crop coordinates from pixels to texels, load the graphic into an image editing program. We loaded each image into Photoshop then selected a square area of the graphic to crop. Display the info window and select the eye dropper tool. Place the eye dropper over the upper left corner of the crop area, and save the X and Y coordinates. The lighthouse example's top left cropped coordinates equal (51,51). Place the eye dropper over the bottom right corner of the crop area, and save the X and Y coordinates. The lighthouse example's bottom right cropped coordinates equal (307,307).
Top Left Crop Texels
The lighthouse photograph's dimensions are 512 x 512 pixels. Divide the cropping coordinate by the pixel dimension. The quotient represents the texel offset from texel values of [0.0]. The lighthouse example's top left crop coordinates equal (51,51). 51/512 ≈ 0.1. The lighthouse example's top left quotient equals approximately 0.1. The top left S texel for the full image equals 0.0. Add the quotient 0.1 to the original S texel coordinate 0.0, to find thecropped S texel coordinate for the top left corner. 0.0 + 0.1 = 0.1. The top left corner's cropped S texel coordinate equals 0.1.
To find the top right cropped T texel coordinate subtract the crop quotient from 1.0. The top left T texel for the full image equals 1.0. The top left corner's cropped T texel coordinate equals 0.9, because 1.0 - 0.1 = 0.9. The top left cropping texels equal [0.1,0.9].
Bottom Right Crop Texels
The lighthouse photograph's dimensions are 512 x 512 pixels. Divide the cropping coordinate by the pixel dimension. The quotient represents the texel offset from texel values of [0.0]. The lighthouse example's bottom right crop coordinates equal (307,307). 307/512 ≈ 0.6. The lighthouse example's bottom right cropped quotient equals approximately 0.6. The bottom right T texel for a full image equals 0.0. Therefore the bottom right corner's T texel coordinate equals 0.6.
To find the bottom right S texel coordinate subtract the crop quotient from 1.0. A full image's bottom right S texel equals 1.0. The bottom right corner's S cropped texel coordinate equals 0.4, because 1.0 - 0.6 = 0.4. The bottom right cropping texels equal [0.6,0.4].
The following listing demonstrates assigning the texel cropping coordinates to variables for use within our vertex texel array. The coordinates apply to the cropped lighthouse photograph. Follow the same process for the cropped Butterfly fish except the top left texels equal [0.5,0.25] and the bottom right texels equal [1.0,0.75].
nXLeft = Number(0.1);
nYTop = Number(0.9);
nXRight = Number(0.6);
nYBottom = Number(0.4);
Listing 9: Lighthouse Cropping Texels
Initialize arrays for the cropped examples nearly identical to arrays prepared for the Lighthouse Texture Map. The only difference involves changing texel values. The vertex coordinates and index element array remain the same. The following listing demonstrates creating a vertex texel array with customized cropping coordinates.
var aVertices = new Float32Array(
[
// left top front
// index 0.
// X,Y,Z:
-1.0, 1.0, 0.0,
// S,T:
nXLeft,nYTop,
// right top front
// index 1.
// X,Y,Z:
1.0, 1.0, 0.0,
// S,T:
nXRight, nYTop,
// right bottom front
// index 2.
// X,Y,Z;
1.0, -1.0, 0.0,
// S,T:
nXRight, nYBottom,
// left bottom front
// index 3.
// X,Y,Z:
-1.0, -1.0, 0.0,
// S,T:
nXLeft, nYBottom,
]
);
Listing 10: Customized Cropping Coordinates
Crop a Texture Map Summary
This section demonstrated how to display a specific cropped section of an image, across a mesh. We illustrate how to convert from pixel crop coordinates to texel crop coordinates. We explain how to modify texel coordinates in the vertex texel array. The projects display either the cropped Butterfly fish graphic or the cropped lighthouse photograph. However the information in this section applies to any WebGL acceptable graphic. See the GLSquareCropconstructor.
Tile a Texture Map
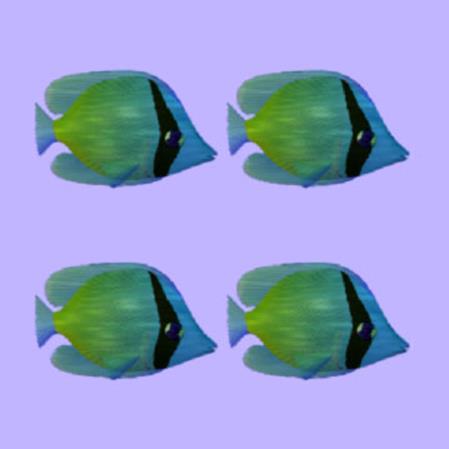
Tiled Butterfly Fish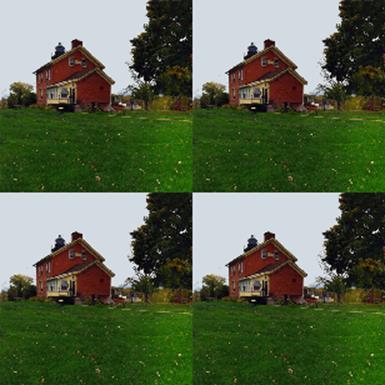
Tiled Lighthouse
The tiled projects display either the tiled Butterfly fish graphic or the tiled lighthouse photograph. However the information in this section applies to any WebGL acceptable graphic.
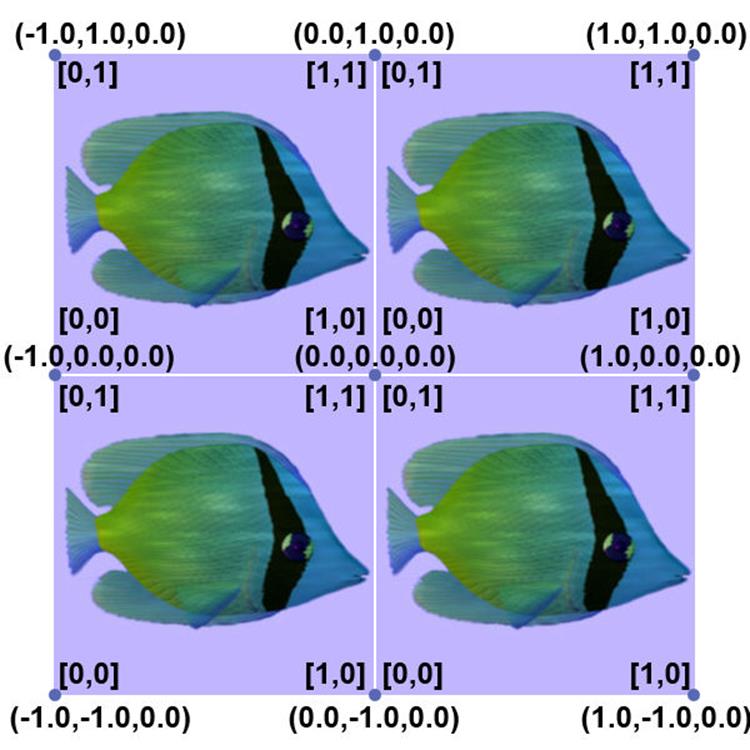
The following section demonstrates how to tile graphics on a square plane manually. We add vertices and texels, dividing the plane into quadrants, or four sections. We added center vertices to each edge of the plane. The exact center of the plane includes a vertex at coordinate (0,0,0), as well.
The new vertices receive more than one mapping coordinate. Extend the array of vertices with interleaved texels. Repeat every vertex which maps to multiple texels. For example if one vertex maps to two texels, then repeat the vertex twice in the Float32Array. Fortunately the original corner vertices continue to use one set of texel coordinates.
The following diagram illustrates the new vertices and texels. Vertex coordinates appear in parenthesis. Texel coordinates appear in brackets. Small blue dots symbolize vertices. For those with black and white displays, small medium gray dots symbolize vertices.
The center vertex references four texels [1,0],[0,0],[1,1],[0,1]. Each corner of the fish graphic maps to the center vertex. Additionally the midpoint of each edge references two texels.
The following listing demonstrates a tiled array of vertices and texels. With interleaved arrays each new texel needs a copy of vertex coordinates. Easier methods exist to copy textures across the surface. For example the next project demonstrates repeating a texture across one surface with the WebGL API method texParameteri(target, wrap mode, repeat type).
var aVertices = new Float32Array(
[
// Top left quadrant:
-1.0, 1.0, 0.0,
0.0,1.0,
0.0, 1.0, 0.0,
1.0, 1.0,
0.0, 0.0, 0.0,
1.0, 0.0,
-1.0, 0.0, 0.0,
0.0, 0.0,
//Top right quadrant:
0.0, 1.0, 0.0,
0.0,1.0,
1.0, 1.0, 0.0,
1.0, 1.0,
1.0, 0.0, 0.0,
1.0, 0.0,
0.0, 0.0, 0.0,
0.0, 0.0,
//Bottom right quadrant:
0.0, 0.0, 0.0,
0.0,1.0,
1.0, 0.0, 0.0,
1.0, 1.0,
1.0, -1.0, 0.0,
1.0, 0.0,
0.0, -1.0, 0.0,
0.0, 0.0,
//Bottom left quadrant:
-1.0, 0.0, 0.0,
0.0,1.0,
0.0, 0.0, 0.0,
1.0, 1.0,
0.0, -1.0, 0.0,
1.0, 0.0,
-1.0, -1.0, 0.0,
0.0, 0.0,
]
);
Listing 11: Tiled Array of Vertices and Texels
The following listing demonstrates the element index array for the tiled examples.
var aIndices = new Uint16Array([
// upper left quadrant
3,2,0,
0,2,1,
// upper right quadrant
7,6,4,
4,6,5,
// lower right quadrant
11,10,8,
8,10,9,
// lower left quadrant
15,14,12,
12,14,13,
]);
Listing 12: Tiled Element Index Array
Tile a Texture Map Summary
This section demonstrated how to tile graphics on a square plane manually. We added vertices and texels, dividing the plane into quadrants, or four sections. We added center vertices to each edge of the plane. The exact center of the plane includes a vertex at coordinate (0,0,0), as well. The next section Display Repeating Graphic demonstrates an easier method to tile graphics across a mesh. See the GLSquareTile constructor.
All materials on the site are licensed Creative Commons Attribution-Sharealike 3.0 Unported CC BY-SA 3.0 & GNU Free Documentation License (GFDL)
If you are the copyright holder of any material contained on our site and intend to remove it, please contact our site administrator for approval.
© 2016-2026 All site design rights belong to S.Y.A.