RHCSA & RHCE Red Hat Enterprise Linux 7: Training and Exam Preparation Guide (EX200 and EX300), Third Edition (2015)
Part II. RHCE Section
Chapter 18. Tuning Kernel Parameters, Reporting System Usage, and Logging Remotely
This chapter describes the following major topics:
· Understand kernel parameters
· Overview of run-time and boot-time parameters
· Modify run-time and boot-time parameters
· Report system resource usage with sysstat and dstat toolsets
· Overview of remote system logging
· Set up a system as a loghost server
· Set up a system as a loghost client
RHCE Objectives:
59. Use /proc/sys and sysctl to modify and set kernel runtime parameters
62. Produce and deliver reports on system utilization (processor, memory, disk, and network)
64. Configure a system to log to a remote system
65. Configure a system to accept logging from a remote system
The behavior of the default kernel installed during the installation process may be changed by modifying the values of one or more of its parameters. There are several kernel parameters that may be tuned for a smooth installation and proper operation of certain applications and database software during runtime. Moreover, a system may be booted with specific boot-time parameters supplied to the kernel.
Monitoring and reporting utilization of processors, memory, disks, and network interface resources is a key in determining bottlenecks in the system. Monitoring helps identify any potential performance issues and the monitored data can be stored for auditing or analysis.
Logs generated on one system may be forwarded to and stored on a remote system. This makes the remote system a central repository for all messages generated on that system. The remote system may be configured to receive forwarded messages from several clients.
Understanding and Tuning Kernel Parameters
We discussed the Linux kernel in Chapter 07 “Booting RHEL7, Updating Kernel, and Logging Messages” at length. We also looked at modules that added support for software and hardware components to the kernel. There is another element that controls the behavior of the kernel, and it is called a kernel parameter. We will discuss kernel parameters and look at how to tune and use them to alter the kernel conduct both during the normal system operational state and at boot.
Run-Time Parameters
Run-time parameters control the kernel behavior while the system is operational. The default parameter values are typically acceptable for normal system operation; however, one or more of them must be modified in order to meet the requirements for smooth installation and proper operation of certain applications, such as database or ERP software.
RHEL7 has over a thousand runtime kernel parameters with more added as new modules and applications are installed on the system. These parameters are set automatically during kernel loading. The current list of active runtime parameters may be viewed with the sysctl command as follows:
# sysctl –a
abi.vsyscall32 = 1
crypto.fips_enabled = 0
debug.exception-trace = 1
debug.kprobes-optimization = 1
dev.hpet.max-user-freq = 64
dev.mac_hid.mouse_button2_keycode = 97
dev.mac_hid.mouse_button3_keycode = 100
dev.mac_hid.mouse_button_emulation = 0
…… . .
vm.scan_unevictable_pages = 0
vm.stat_interval = 1
vm.swappiness = 30
vm.user_reserve_kbytes = 29940
vm.vfs_cache_pressure = 100
vm.zone_reclaim_mode = 0
Runtime values for these parameters are stored in various files located under sub-directories in the /proc/sys directory and can be altered on the fly by changing associated files. This change remains in effect until either the value is re-adjusted or the system is rebooted. This temporary change can be accomplished with the sysctl or the echo command. To make the change survive across system reboots, the value must be defined either directly in the /etc/sysctl.conf file or in a file under the /etc/sysctl.d directory.
By default, sysctl.conf contains only a few comments. There is another file, /usr/lib/sysctl.d/00-system.conf, that stores system default settings. The contents of this file are captured from server1 and displayed below:
# cat /usr/lib/sysctl.d/00-system.conf
# Disable netfilter on bridges.
net.bridge.bridge-nf-call-ip6tables = 0
net.bridge.bridge-nf-call-iptables = 0
net.bridge.bridge-nf-call-arptables = 0
# Controls the maximum shared segment size, in bytes
kernel.shmmax = 4294967295
# Controls the maximum number of shared memory segments, in pages
kernel.shmall = 268435456
The five uncommented lines in the above output indicate the setting of five parameters through this file, and this can be verified with the sysctl command. The following greps for the kernel.shmmax parameter for confirmation:
# sysctl –a | grep kernel.shmmax
kernel.shmmax = 4294967295
The output confirms that the value for the parameter in the runtime kernel as well as in the /usr/lib/sysctl.d/00-system.conf file is identical.
Exercise 18-1: Tune Run-Time Kernel Parameters
This exercise should be done on server1.
In this exercise, you will set the value of sunrpc.tcp_fin_timeout parameter to 18 and ensure that this change takes effect right away. Reboot the system and observe the value of this parameter. You will change this parameter value again to 16 and making sure that it is persistent. Reboot the system again and observe the result.
1. Display the current value of sunrpc.tcp_fin_timeout parameter using either of the following:
# sysctl sunrpc.tcp_fin_timeout
sunrpc.tcp_fin_timeout = 15
# cat /proc/sys/sunrpc/tcp_fin_timeout
15
2. Change the value from 15 to 18 instantly with either of the following:
# sysctl –w sunrpc.tcp_fin_timeout=18
sunrpc.tcp_fin_timeout = 18
# echo 18 > /proc/sys/sunrpc/tcp_fin_timeout
3. Reboot the system and check the value of the parameter again. You will observe that the value is reset to 15.
# sysctl sunrpc.tcp_fin_timeout
sunrpc.tcp_fin_timeout = 15
4. Change the value to 16 persistently by appending an entry to the /etc/sysctl.conf file:
sunrpc.tcp_fin_timeout=18
5. Load the new value from the /etc/sysctl.conf file:
# sysctl –p
sunrpc.tcp_fin_timeout = 16
EXAM TIP: To store kernel parameter values persistently, add them to the /etc/sysctl.conf file.
At this point, you can reboot the system and then check to ensure that the new value has survived the reboot.
Boot-Time Parameters
Boot-time parameters, also referred to as command-line options, affect the boot behavior of the kernel. Their purpose is to pass any hardware-specific information that the kernel would otherwise not be able to determine automatically, or to override random values that the kernel would detect by itself. Boot-time parameters are supplied to the kernel via the GRUB2 interface.
The entire boot string along with the command-line options can be viewed after the system has booted up and it is in operational state. This information is gathered and stored in the /proc/cmdline file, and can be viewed with the cat command as follows:
# cat /proc/cmdline
BOOT_IMAGE=/vmlinuz-3.10.0-123.el7.x86_64 root=UUID=04801120-a151-46c2-90b7-437770c61af2 ro rd.lvm.lv=vg00/swap vconsole.font=latarcyrheb-sun16 crashkernel=auto vconsole.keymap=us rd.lvm.lv=vg00/root rhgb quiet LANG=en_CA.UTF-8
The output shows the kernel name, version, UUID of the root file system, and several other boot-time parameters that were passed to the kernel by default at the last system boot. This information is stored in the /boot/grub2/grub.cfg file on x86 systems.
EXAM TIP: Make a copy of the grub.cfg file before attempting to modify it manually. If the original file becomes inconsistent, you can boot the system into single user and put the copy back on the original file.
There are two options to supply boot-time parameters to the kernel. We can either modify the grub.cfg file and add the required parameters to the default kernel boot string or specify them at boot-time by interacting with GRUB2. With the first option, the change will be permanent and it will be applied each time the system is rebooted. The second option is effective for one particular boot only.
Exercise 18-2: Tune Boot-Time Kernel Parameters
This exercise should be done on server1.
In this exercise, you will modify the default kernel boot entry and append a kernel parameter called kernstack with value 1 to it. You will ensure that this change is persistent. You will reboot the system and display the file contents of /proc/cmdline to verify the presence of the parameter.
1. Check the kernel boot string that was used at the last system boot:
# cat /proc/cmdline
BOOT_IMAGE=/vmlinuz-3.10.0-123.el7.x86_64 root=UUID=04801120-a151-46c2-90b7-437770c61af2 ro rd.lvm.lv=vg00/swap vconsole.font=latarcyrheb-sun16 crashkernel=auto vconsole.keymap=us rd.lvm.lv=vg00/root rhgb quiet LANG=en_CA.UTF-8
2. Open the /boot/grub2/grub.cfg file and navigate to the “BEGIN /etc/grub.d/10_linux” section. Add “kernstack=1” to the linux16 directive under the first menuentry item as highlighted in bolded text below:
### BEGIN /etc/grub.d/10_linux ###
menuentry 'Red Hat Enterprise Linux Server, with Linux 3.10.0-123.el7.x86_64' --class red --class gnu-linux --class gnu --class os --unrestricted $menuentry_id_option 'gnulinux-3.10.0-123.el7.x86_64-advanced-04801120-a151-46c2-90b7-437770c61af2' {
load_video
set gfxpayload=keep
insmod gzio
insmod part_msdos
insmod xfs
set root='hd0,msdos1'
if [ x$feature_platform_search_hint = xy ]; then
search --no-floppy --fs-uuid --set=root --hint='hd0,msdos1' 2d9d642b-fe71-4afe-ad39-90c73c4aabb1
else
search --no-floppy --fs-uuid --set=root 2d9d642b-fe71-4afe-ad39-90c73c4aabb1
fi
linux16 /vmlinuz-3.10.0-123.el7.x86_64 root=UUID=04801120-a151-46c2-90b7-437770c61af2 ro rd.lvm.lv=vg00/swap vconsole.font=latarcyrheb-sun16 crashkernel=auto vconsole.keymap=us rd.lvm.lv=vg00/root rhgb quiet LANG=en_CA.UTF-8 kernstack=1
initrd16 /initramfs-3.10.0-123.el7.x86_64.img
}
3. Reboot the system for testing.
4. Display the file contents of /proc/cmdline again, and check to confirm that the kernel did boot with the kernstack option:
# cat /proc/cmdline
BOOT_IMAGE=/vmlinuz-3.10.0-123.el7.x86_64 root=UUID=04801120-a151-46c2-90b7-437770c61af2 ro rd.lvm.lv=vg00/swap vconsole.font=latarcyrheb-sun16 crashkernel=auto vconsole.keymap=us rd.lvm.lv=vg00/root rhgb quiet LANG=en_CA.UTF-8 kernstack = 1
Generating System Usage Reports
Monitoring system resources and reporting their utilization are important system administration tasks. System resources include CPU, memory, disk, and network. There are several tools available and their use is dependent on what report you wish to generate. RHEL comprises of sysstat and dstat software packages that include tools to monitor the performance and usage of these resources, and generate reports. Moreover, numerous native tools in RHEL are available for monitoring and reporting resource utilization to ascertain where, if any, bottlenecks exist. These tools include df for viewing disk and file system utilization, vmstat for viewing virtual memory statistics, top for realtime viewing of CPU, memory, swap, and processes, and so on. See chapters in the RHCSA section for details on these tools.
The sysstat Toolset
The sysstat toolset includes several additional monitoring and performance reporting commands such as cifsiostat, iostat, mpstat, nfsiostat, pidstat, sadf, and sar. These commands are described in Table 18-1.
|
Command |
Description |
|
cifsiostat |
Reports read and write operations on CIFS file systems. |
|
iostat |
Reports CPU, device, and partition statistics. |
|
mpstat |
Reports activities for each available CPU. |
|
nfsiostat |
Reports read and write operations on NFS file systems. |
|
pidstat |
Reports statistics for running processes. |
|
sa1 |
Captures and stores binary data in sadd (system activity daily data) files located in the /var/log/sa directory. |
|
sa2 |
Captures and stores daily reports in sardd (system activity reporter daily data) files located in the /var/log/sa directory. |
|
sadc |
System activity data reporter. Samples and writes binary data in sadd files located in the /var/log/sa directory at a specified number of times with a specified interval. |
|
sadf |
Displays data gathered by the sar command in various formats. |
|
sar |
System activity reporter. Gathers and reports system activities, and stores the data in binary format. |
|
dstat |
Reports CPU, disk, network, paging, and system statistics. More powerful and versatile than the vmstat and iostat commands combined. |
Table 18-1 sysstat Performance and Reporting Commands
You may need to install the sysstat package on the system. Run the following to install it:
# yum –y install sysstat
The sysstat service references two configuration files, sysstat and sysstat.ioconf, which are located in the /etc/sysconfig directory. The sysstat file defines three directives: HISTORY, COMPRESSAFTER, and SADC_OPTIONS, by default, as shown below:
# grep –v ^# /etc/sysconfig/sysstat | grep –v ^$
HISTORY=28
COMPRESSAFTER=31
SADC_OPTIONS="–S DISK"
The first directive sets a limit on the number of days (default is 28) to keep the log files, the second directive determines the age (default is 31) of the log files after which they are compressed, and the third directive defines the arguments to be passed to the sadc command when it is executed. Thesysstat.ioconf file directs how to gather disk I/O information, and this file is normally left intact.
In addition to the two configuration files, a cron job file /etc/cron.d/sysstat is available with two default entries as shown below:
*/10 * * * * root /usr/lib64/sa/sa1 1 1
53 23 * * * root /usr/lib64/sa/sa2 –A
The first entry executes the sa1 command at every ten-minute interval and collects and stores data in sadd files. This command is a front-end to the sadc command, and it is intended to run via cron.
The second cron entry executes the sa2 command every day at 11:53 p.m., and captures statistical data and writes it in the /var/log/sa/sardd files. This command is the front-end to the sar command, and it is intended to run via cron as well.
The raw data collected with the sa1, sa2, and sar commands can be read and extracted with the sadf command. Let’s first review some of the key options available with sadf. Table 18-2 describes them.
|
Option |
Description |
|
–d |
Generates a report in a database-friendly format. |
|
–D |
Generates a report in a database-friendly format with the time expressed in seconds since the epoch time. |
|
–e |
Expresses the end time in the twenty-four hour format. |
|
–p |
Generates a report in the awk-friendly format. |
|
–s |
Expresses the start time in the twenty-four hour format. |
|
–x |
Generates a report in the XML-friendly format. |
Table 18-2 sadf Command Options
Let’s use some of these options in the following example to generate a report with data extracted between 9:00 a.m. and 5:00 p.m. on the fifteenth of the month:
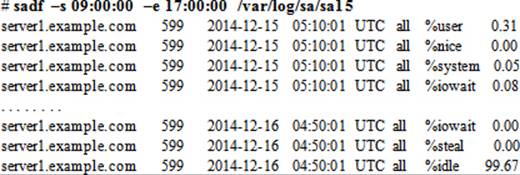
You may redirect the above output to a file for future review.
The following example produces a database-friendly report on CPU (–u), memory (–r), disk (–d), and network interfaces (–n) by running the sar command using data from the twentieth of the month:
# sadf –d /var/log/sa/sa20 -- –urd –n DEV
# hostname;interval;timestamp;CPU;%user;%nice;%system;%iowait;%steal;%idle
server1.example.com;599;2014-12-20 05:10:01 UTC;-1;0.35;0.00;0.06;0.00;0.00;99.59
server1.example.com;599;2014-12-20 05:20:01 UTC;-1;0.36;0.00;0.05;0.00;0.00;99.59
server1.example.com;599;2014-12-20 05:30:01 UTC;-1;0.33;0.00;0.04;0.00;0.00;99.63
…… . .
In the above example, the options specified after the two hyphen characters are actually the sar command options. Table 18-3 lists and describes some of the key sar switches.
|
Option |
Description |
|
–d |
Reports block devices. |
|
–n |
Reports network devices. |
|
–P |
Reports the specified number of CPU. |
|
–r |
Reports memory usage. |
|
–S |
Reports swap space utilization statistics. |
|
–u |
Reports CPU usage. |
Table 18-3 sar Command Options
There are more options available to the sar command. Check the man pages for details.
The dstat Tool
The dstat package includes a single monitoring and reporting tool, which is called dstat. This tool is versatile and it is a replacement for the vmstat, iostat, and ifstat commands with enhanced features and extra counters. It displays real-time system resource utilization. This tool may be used during system performance testings and for troubleshooting. You may need to install the dstat package on the system using the following:
# yum –y install dstat
Run the dstat command with the –cdmn options to view the utilization for CPU (–c), disk (–d), memory (–m), and network (–n):
# dstat –cdmn
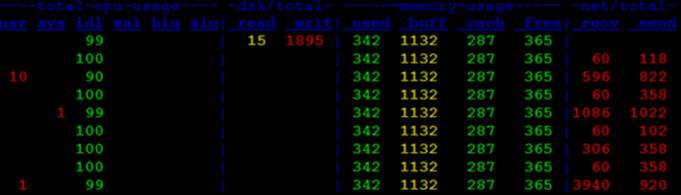
For each resource, dstat reports statistics in multiple columns. This report can be written to a CSV file and imported in Excel to view the statistics in graphs.
In addition to the cdmn options used in the above example, Table 18-4 describes a few more switches that can be used for additional statistics in the output.
|
Option |
Description |
|
–g |
Reports paging. |
|
–y |
Reports system statistics. |
|
–p |
Reports process statistics. |
|
–r |
Reports read and write request statistics. |
|
–s |
Reports swap space statistics. |
Table 18-4 dstat Command Options
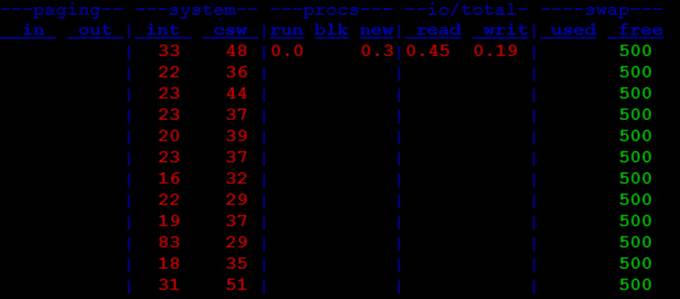
For instance, run dstat with all the options listed in Table 18-4.
# dstat –gyprs
As mentioned earlier, the dstat command is versatile. It has more options available. Check the man pages for details.
Logging System Messages Remotely
We discussed local system logging in detail via the rsyslogd service in Chapter 07 “Booting RHEL7, Updating Kernel, and Logging Messages”. Capturing and logging local messages on the system is the default behavior of this service. However, there may be circumstances that demand for consolidation of all local logs on to a central system for reasons such as audit or ease of system management.
EXAM TIP: Remote logging has recently been removed from the official exam objectives list for RHCE. I have left this topic here just in case Red Hat decides to re-add it.
The same rsyslogd service supports network logging as well. We set up a central system (server1), called loghost, to receive and log messages generated on remote clients. We then configure the remote clients (server2 and host1) to forward their messages to the loghost for storage. See Figure 18-1.
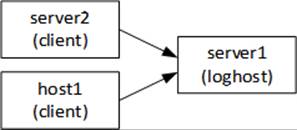
Figure 18-1 Remote System Logging
For both server and client configurations, we need to modify the same configuration file—/etc/rsyslog.conf—that was analyzed in Chapter 07 for local logging. Only a few changes are needed in this file on the server and the clients to establish the setup for storing and forwarding all client messages. We can configure the clients to forward logs for one or more specific rules, or just about every rule that exists in the rsyslog.conf file. The rsyslogd service supports both TCP and UDP protocols; however, we prefer to use TCP, as it is more reliable and connection-oriented. If you prefer to use UDP, simply add one @ sign as a prefix to the loghost name in the rsyslog.conf file. See the usage below:
*.* @@remote-host:514
*.* @remote-host:514
The first entry above identifies the use of TCP and the second entry implies the use of UDP. These entries also show the default well-known port (514) used by the network logging service.
Exercise 18-3: Configure a System as a Loghost
This exercise should be done on server2.
In this exercise, you will configure this system as a loghost to receive forwarded messages from server1 and store them locally. You will use the TCP protocol and allow traffic to pass through port 514 unhindered.
1. Open the /etc/rsyslog.conf file in a text editor and uncomment the following two directives located in the MODULES section:
$ModLoad imtcp
$InputTCPServerRun 514
2. Add TCP port 514 to the default firewalld zone, and load the new rule:
# firewall-cmd --permanent --add-port 514/tcp
success
# firewall-cmd --reload
success
3. Set the correct SELinux port type on TCP port 514:
# semanage port –a –t syslogd_port_t –p tcp 514
4. Set the rsyslog service to autostart at each system reboot:
# systemctl enable rsyslog
5. Restart the rsyslog service and check its operating state:
# systemctl restart rsyslog
# systemctl status rsyslog
rsyslog.service - System Logging Service
Loaded: loaded (/usr/lib/systemd/system/rsyslog.service; enabled)
Active: active (running) since Thu 2015-01-15 07:45:01 MIST; 5s ago
Main PID: 20166 (rsyslogd)
CGroup: /system.slice/rsyslog.service
└─20166 /usr/sbin/rsyslogd -n
This completes the setup for loghost and it is ready to receive remote forwarded messages.
Exercise 18-4: Configure a System as a Loghost Client
This exercise should be done on server1.
In this exercise, you will configure this system to forward all log messages to the loghost configured in the previous exercise. You will generate a custom message on server1 and check for its presence in the /var/log/messages file on the loghost to validate the setup.
1. Open the /etc/rsyslog.conf file in a text editor and add the following to the bottom of the file:
*.* @@192.168.0.120:514
2. Set the rsyslog service to autostart at each system reboot:
# systemctl enable rsyslog
3. Restart the rsyslog service and check its operating state:
# systemctl restart rsyslog
# systemctl status rsyslog
rsyslog.service - System Logging Service
Loaded: loaded (/usr/lib/systemd/system/rsyslog.service; enabled)
Active: active (running) since Wed 2015-01-14 15:56:54 EST; 5s ago
Main PID: 2001 (rsyslogd)
CGroup: /system.slice/rsyslog.service
└─2001 /usr/sbin/rsyslogd -n
4. Generate a custom log message:
# logger –i “This is a test message from root on server1”
5. Log on to the loghost and tail the /var/log/messages file:
# tail /var/log/messages
Jan 14 16:18:13 server1 root[3907]: This is a test message from root on server1
The alert generated on the loghost client is logged to the messages file on the loghost. This completes the setup for a loghost client and confirms the operation of the service as configured.
Chapter Summary
This chapter presented three topics: kernel parameter tuning, system resource usage reporting, and remote system logging.
We discussed run-time and boot-time kernel parameters and demonstrated how to modify their values temporarily and permanently.
Next, we looked at monitoring and reporting system resource utilization. We discussed several tools and saw how to generate and display reports using them. We learned the sa1, sa2, and sar commands for capturing performance data and storing it in files and a different tool to display the stored data.
Finally, we covered the setup of a central logging environment with one loghost and one client after briefly discussing the benefits associated with central logging. We tested the client/server setup by generating and capturing log messages.
Chapter Review Questions
1. What is the default port used by the rsyslog service?
2. Which command is used to display the performance data captured with the sar command?
3. Which temporary file stores the boot string that is used to boot the system?
4. The sar command may be used to display data for a specified time range. True or False?
5. Which command in the dstat package displays real-time performance data for CPU, memory, disk, and network?
6. Why would you need to modify a runtime kernel parameter?
7. Which software package includes the dstat command?
8. What would the command sysctl do with the –p switch?
9. Kernel parameters cannot be modified in multi-user target. True or False?
10. What is the name of the primary file for defining kernel parameters?
11. What two commands can you use to alter a runtime kernel parameter?
12. Where do you store the boot-time parameters persistently?
13. What would the command sysctl –w net.ipv4.tcp_abc=3 do?
14. How would you verify the boot-time parameter supplied to boot the current system?
Answers to Chapter Review Questions
1. The rsyslog service uses port 514 by default.
2. The sadf command is used to display the performance data collected with sar.
3. The /proc/cmdline temporary file stores the boot string used to boot the system.
4. False.
5. The dstat command.
6. We modify a runtime parameter to support the installation and operation of a software driver or application.
7. The dstat software package includes the dstat command.
8. This command will load the kernel parameters defined in the /etc/sysctl.conf file.
9. False.
10. The /etc/sysctl.conf file.
11. You can use either the sysctl or the echo command.
12. Boot-time kernel parameters are stored in the /boot/grub2/grub.cfg file.
13. This command will write the specified kernel parameter and its value to the /etc/sysctl.conf file.
14. By looking at the contents of the /proc/cmdline file.
DIY Challenge Labs
The following labs are useful to strengthen the concepts and topics learned in this chapter. It is expected that you perform these labs without any additional help. A step-by-step guide is not provided, as the implementation of these labs requires the knowledge that has been presented in this chapter. Use defaults or your own thinking for missing information.
Lab 18-1: Modify a Run-Time Kernel Parameter
Modify the value of a kernel parameter kernel.msgmax to 131072 and ensure that the value survives system reboots. Check the value after rebooting the system.
Lab 18-2: Modify a Boot-Time Kernel Parameter
Modify the default kernel and add a boot-time parameter abcd=2. Reboot the system and verify the entry in the /proc/cmdline file.
Lab 18-3: Set Up a Central Loghost System
Set up host1 as a central loghost to receive and store messages from server1. Configure the service to use UDP on port 1050. Test the functionality by generating an alert on server1 and confirming its reception in the /var/log/message file on host1.
All materials on the site are licensed Creative Commons Attribution-Sharealike 3.0 Unported CC BY-SA 3.0 & GNU Free Documentation License (GFDL)
If you are the copyright holder of any material contained on our site and intend to remove it, please contact our site administrator for approval.
© 2016-2026 All site design rights belong to S.Y.A.