CCNP Routing and Switching SWITCH 300-115 Official Cert Guide (2015)
Part V. Monitoring Campus Networks
Chapter 13. Logging Switch Activity
This chapter covers the following topics that you need to master for the CCNP SWITCH exam:
![]() Syslog Messages: This section explains how a switch can maintain a log of important events and send the logging messages to various destinations.
Syslog Messages: This section explains how a switch can maintain a log of important events and send the logging messages to various destinations.
![]() Adding Time Stamps to Syslog Messages: This section discusses ways you can set the internal switch clock and synchronize to an accurate source. The switch can then add time stamps to its logging messages as a record of event history.
Adding Time Stamps to Syslog Messages: This section discusses ways you can set the internal switch clock and synchronize to an accurate source. The switch can then add time stamps to its logging messages as a record of event history.
This chapter discusses the logging methods you can use to monitor Catalyst switches and collect their event logs. Switch messages should be generated with an accurate time stamp so that you can correlate events across devices. The chapter also covers several methods to set the switch clock and keep it accurate.
“Do I Know This Already?” Quiz
The “Do I Know This Already?” quiz allows you to assess whether you should read this entire chapter thoroughly or jump to the “Exam Preparation Tasks” section. If you are in doubt based on your answers to these questions or your own assessment of your knowledge of the topics, read the entire chapter. Table 13-1 outlines the major headings in this chapter and the “Do I Know This Already?” quiz questions that go with them. You can find the answers in Appendix A, “Answers to the ‘Do I Know This Already?’ Quizzes.”
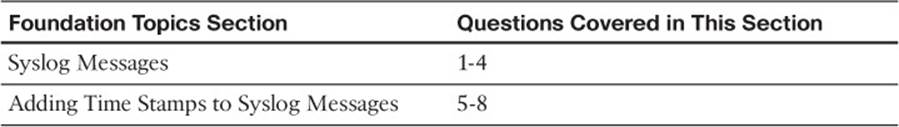
Table 13-1 “Do I Know This Already?” Foundation Topics Section-to-Question Mapping
1. Which one of the following syslog severity levels would generate the most types of logging messages?
a. Emergencies
b. Alerts
c. Critical
d. Warnings
e. Informational
2. The logging trap 0 command sends logging messages to which one of the following destinations?
a. Switch console
b. Internal buffer
c. SNMP server
d. Syslog server
e. Nowhere; logging is disabled
3. If you have configured a switch to send logging messages to an internal buffer, which one of the following commands will let you review the buffer contents?
a. show logging buffer
b. show buffer logging
c. show logging
d. show event log
4. Which one of the following syslog severity levels will generate only messages about the most critical or severe events?
a. 0
b. 1
c. 5
d. 7
e. 10
5. Which one of the following protocols is used to synchronize time between networked devices?
a. TSP
b. NTP
c. STP
d. RTP
6. Which one of the following time servers is considered to be the most accurate?
a. Stratum 0
b. Stratum 1
c. Stratum 10
d. Stratum 100
7. Suppose you configure a switch with the command ntp server 192.168.100.100. Which one of the following is a true statement?
a. The switch will become only an NTP client.
b. The switch will become only an NTP server.
c. The switch will become both an NTP server and an NTP client.
d. The switch will not use NTP until you enter the ntp enable command.
8. Which one of the following answers correctly describes SNTP?
a. Secure Network Time Protocol
b. Simplified Network Time Protocol
c. Syslog Network Time Protocol
d. Switched Network Time Protocol
Foundation Topics
This book presents a variety of features and functions that you can leverage to build a working network and accomplish design goals. How can you stay aware of what is going on inside a switch while it operates? You can use show commands to display various information from time to time, but you may not catch an event as it happens in real time. Suppose, for instance, that a link goes down for some reason. If you do not know about it and are not able to fix it right away, you might miss an opportunity to keep the network functioning properly. Likewise, you might get news of a problem within the network and need to start troubleshooting.
You should leverage the logging system available in each switch so that you can collect messages as they are generated. By doing so, you can monitor the network to detect failures and gather information about switch activity.
Syslog Messages
Catalyst switches can be configured to generate an audit trail of messages describing important events that have occurred. These system message logs (syslog) can then be collected and analyzed to determine what has happened, when it happened, and how severe the event was.
When system messages are generated, they always appear in a consistent format, as shown in Figure 13-1. Each message contains the following fields:
![]() Timestamp: The date and time from the internal switch clock. By default, the amount of time that the switch has been up is used.
Timestamp: The date and time from the internal switch clock. By default, the amount of time that the switch has been up is used.
![]() Facility Code: A system identifier that categorizes the switch function or module that has generated the message; the facility code always begins with a percent sign.
Facility Code: A system identifier that categorizes the switch function or module that has generated the message; the facility code always begins with a percent sign.
![]() Severity: A number from 0 to 7 that indicates how important or severe the event is; a lower severity means the event is more critical.
Severity: A number from 0 to 7 that indicates how important or severe the event is; a lower severity means the event is more critical.
![]() Mnemonic: A short text string that categorizes the event within the facility code.
Mnemonic: A short text string that categorizes the event within the facility code.
![]() Message Text: A description of the event or condition that triggered the system message.
Message Text: A description of the event or condition that triggered the system message.
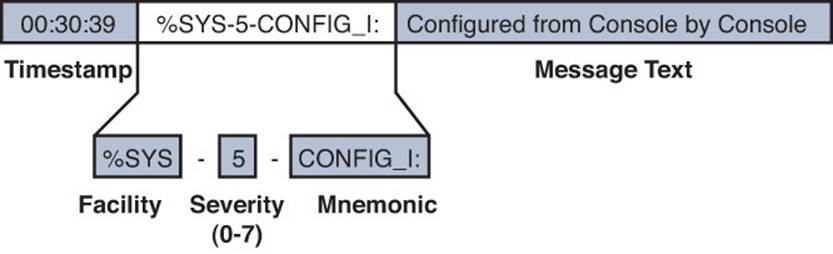
Figure 13-1 Catalyst Switch Syslog Message Format
In Figure 13-1, an event in the System or SYS facility has triggered the system message. The event is considered to be severity level 5. From the mnemonic CONFIG_I, you can infer that something happened with the switch configuration. Indeed, the text description says that the switch was configured by someone connected to the switch console port.
Generally, you should configure a switch to generate syslog messages that are occurring at or above a certain level of importance; otherwise, you might collect too much information from a switch that logs absolutely everything or too little information from a switch that logs almost nothing.
You can use the severity level to define that threshold. Figure 13-2 shows each of the logging severity levels, along with a general list of the types of messages that are generated. Think of the severity levels as concentric circles. When you configure the severity level threshold on a switch, the switch will only generate logging messages that occur at that level or at any other level that is contained within it.

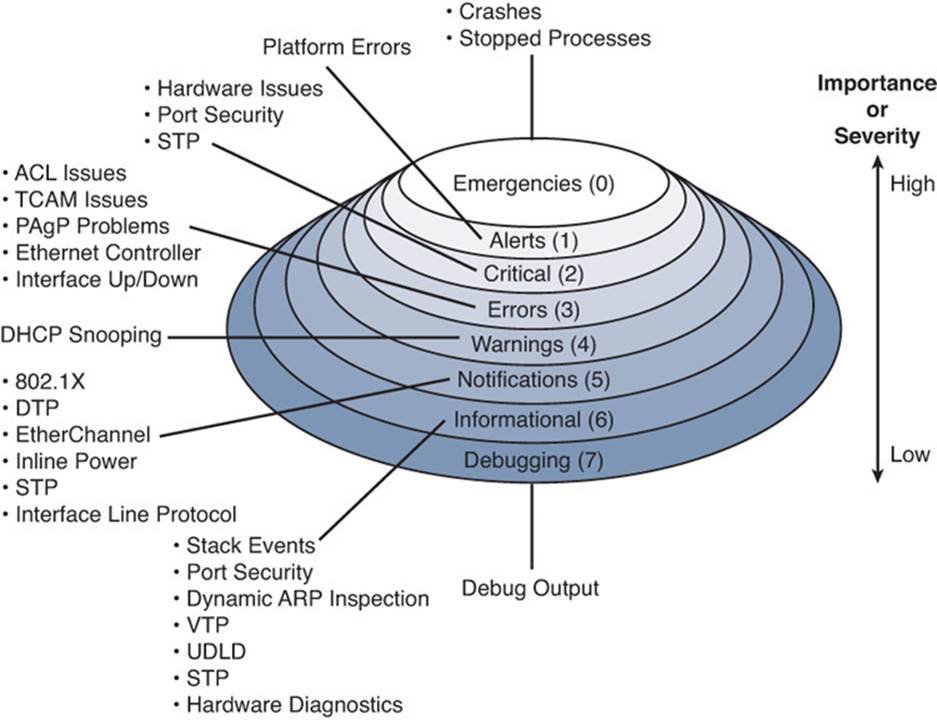
Figure 13-2 Syslog Severity Levels
For example, if the syslog severity level is set to critical (severity level 2), the switch will generate messages in the Critical, Alerts, and Emergencies levels, but nothing else. Notice that the severity levels are numbered such that the most urgent events are reported at level 0 and the least urgent at level 7.
Tip
You should try to have a good understanding of the severity level names and numbers, as well as their order, in case you need to identify them on the exam.
Remember that the severity numbers are opposite of what you might perceive as the actual message importance. If the exam asks about an event that has a “high” or “greater” severity, that means the severity level number will be lower.
System messages can be sent to the switch console, collected in an internal memory buffer, and sent over the network to be collected by a syslog server. The following sections cover the configuration commands for each of these destinations.
Logging to the Switch Console
By default, system messages are sent to the switch console port at the Debugging level. You can change the console severity level with the following command:
Switch(config)# logging console severity
The severity parameter can be either a severity level keyword, such as informational, or the corresponding numeric value (0 to 7).
Remember that syslog information can be seen on the console only when you are connected to the console port. Even then, the console is not a very efficient way to collect and view system messages because of its low throughput. If you are connected to a switch through a Telnet or Secure Shell (SSH) session, you can redirect the console messages to your remote access session by using the terminal monitor command.
Logging to the Internal Buffer
Every Catalyst switch has an internal memory buffer where syslog messages can be collected. The internal buffer is an efficient way to collect messages over time. As long as the switch is powered up, the logging buffer is available.
By default, the internal logging buffer is disabled. To enable it and begin sending system messages into the buffer, you can use the following command:
Switch(config)# logging buffered severity
The severity parameter can be either a severity level keyword, such as informational, or the corresponding numeric value (0 to 7).
The logging buffer has a finite size and operates in a circular fashion. If the buffer fills, the oldest messages roll off as new ones arrive. By default, the logging buffer is 4096 bytes or characters long, which is enough space to collect 50 lines of full-length text. If you depend on the logging buffer to keep a running history of logging messages, you might need to increase its size with the following command:
Switch(config)# logging buffered size
The buffer length is set to size (4096 to 2147483647) bytes. Be careful not to set the length too big because the switch reserves the logging buffer space from the memory it might need for other operations.
To review the internal logging buffer at any time, you can use the show logging command.
Logging to a Remote Syslog Server
Syslog servers provide the most robust method of logging message collection. Messages are sent from a switch to a syslog server over the network using UDP port 514. This means that a syslog server can be located anywhere, as long as it is reachable by the switch. Keep in mind that UDP is not a reliable means of communication because it is not connection-oriented like TCP. Therefore, logging messages are not acknowledged; they are just sent toward a syslog server on a best effort basis.
A syslog server can collect logs from many different devices simultaneously and can archive the logging information for a long period of time. To identify a syslog server and begin sending logging messages to it, you can use the following commands:
Switch(config)# logging host ip-address
Switch(config)# logging trap severity
The syslog server is located at the hostname or IP address specified. You can enter the logging host command more than once if you have more than one syslog server collecting logging information. The syslog server severity level can be either a severity level keyword, such asinformational, or the corresponding numeric value (0 to 7).
Tip
Notice that each of the logging message destinations can have a unique severity level configured. For example, you might collect messages of severity level Debugging into the internal buffer, while collecting severity level Notifications to a syslog server.
Tip
By default, a switch will generate a system message every time it detects an interface going up or down. That sounds like a good thing, until you realize that the syslog server will be receiving news of every user powering their PC on and off each day. Each link state change will generate a message at the Errors (3) severity level, in addition to a line protocol state change at the Notifications (5) severity level. To prevent this from happening with access layer interfaces where end users are connected, you can use the following interface configuration command:
Switch(config-if)# no logging event link-status
Adding Time Stamps to Syslog Messages
If you are watching system messages appear in real time, it is obvious what time those events have occurred; however, if you need to review messages that have been collected and archived in the internal logging buffer or on a syslog server, message time stamps become really important.
By default, Catalyst switches add a simple “uptime” time stamp to logging messages. This is a cumulative counter that shows the hours, minutes, and seconds since the switch has been booted. Suppose that you find an important event in the logs and you want to know exactly when it occurred. With the uptime time stamp, you would have to backtrack and compute the time of the event based on how long the switch has been operating.
Even worse, as time goes on, the uptime time stamp becomes more coarse and difficult to interpret. In the following output, an interface went down 20 weeks and 2 days after the switch was booted. Someone made a configuration change 21 weeks and 3 days after the switch booted. At exactly what date and time did that occur? Who knows!
20w2d: %LINK-3-UPDOWN: Interface FastEthernet1/0/27, changed state to down
21w3d: %SYS-5-CONFIG_I: Configured from console by vty0 (172.25.15.246)
Instead, you can configure the switch to add accurate clock-like time stamps that are easily interpreted. Sometimes you also will need to correlate events in the logs of several network devices. In that case, it is important to synchronize the clocks (and time stamps) across all those devices.
Setting the Internal System Clock
Each Cisco switch has an internal time clock that runs continuously without any intervention. However, do not assume that a switch already has its internal clock set to the correct date and time. You can use the show clock command to find out, as in the following example:
Switch# show clock
*00:54:09.691 UTC Mon Mar 1 1993
Switch#
Here the clock has been set to its default value, and it is March 1, 1993! Clearly, that is not useful at all.
You can use the following commands as a guideline to define the time zone and summer (daylight savings) time and to set the clock:
Switch(config)# clock timezone name offset-hours [offset-minutes]
Switch(config)# clock summer-time name date start-month date year hh:mm
end-month day year hh:mm [offset-minutes]
Or
Switch(config)# clock summer-time name recurring [start-week day month
hh:mm end-week day month hh:mm [offset-minutes]
Switch(config)# exit
Switch# clock set hh:mm:ss
In the following example, the switch is configured for the eastern time zone in the U.S. and the clock is set for 3:23 p.m. If no other parameters are given with the clock summer-time recurring command, U.S. daylight savings time is assumed:
Switch(config)# clock timezone EST -5
Switch(config)# clock summer-time EDT recurring
Switch(config)# exit
Switch# clock set 15:23:00
Using NTP to Synchronize with an External Time Source
To synchronize the clocks across multiple switches in your network from common, trusted time sources, you should use the Network Time Protocol (NTP). Each switch still maintains its own internal clock, but each periodically synchronizes its clock with one or more external time sources. The goal is to synchronize to a source with some level of implied trust that the time is accurate. NTP can also cope with the delay that occurs from the time a source transmits its current time until a switch receives the message.
With NTP, time sources or servers are arranged in a hierarchical fashion, with each layer of time servers synchronizing with other servers in a higher layer. Ideally, a networked device should synchronize its time clock with an authoritative source, or one that offers the most accuracy. Authoritative time sources can use an atomic clock or a GPS receiver to maintain very accurate time. However, it often is not practical or scalable to point every device in your network toward one authoritative source. Instead, the time synchronization process can be distributed so that one layer of NTP servers synchronizes with the authoritative source, then another layer of devices synchronizes with the next highest layer, and so on.
Each layer of the hierarchy is known as a stratum, where the stratum number indicates the number of NTP “hops” needed to reach the top. Authoritative time servers are located in stratum 1. NTP servers that synchronize with stratum 1 servers are designated as stratum 2. The NTP stratums keep incrementing toward the servers that client devices use for their synchronization, as shown in Figure 13-3.
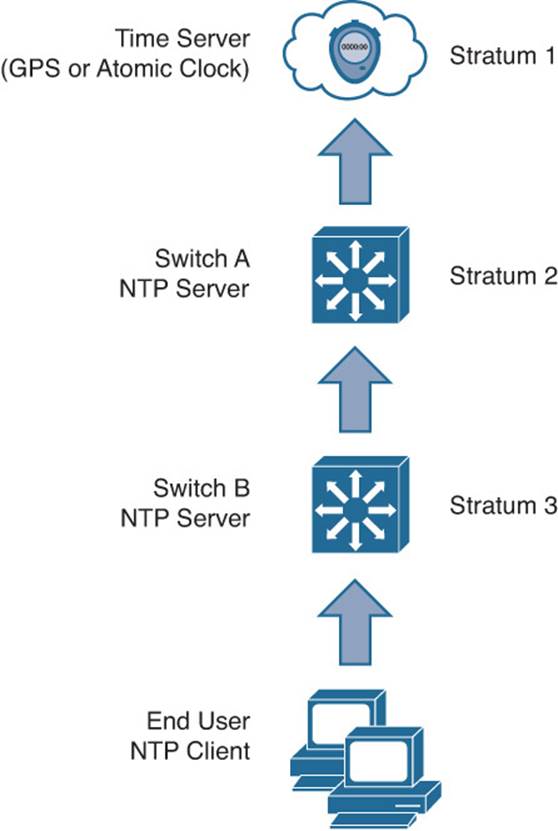
Figure 13-3 The NTP Hierarchy of Stratums
The NTP hierarchy is also flexible. For example, you might have an authoritative time source located somewhere in your network. You can configure all of your switches, routers, firewalls, and clients to synchronize their clocks with your stratum 1 NTP server. For a more scalable solution, you could configure a few centrally located switches as NTP servers and point them toward stratum 1 servers. Your NTP server switches would then become stratum 2 servers. All of your other devices could then synchronize their clocks with the stratum 2 servers.
The NTP stratum numbers also serve as an indicator of time accuracy. For instance, if a device has a choice of synchronizing with a stratum 4 server or a stratum 3 server, it will prefer the stratum 3 server because it is ultimately better synchronized with an authoritative source.
Table 13-2 lists the possible NTP modes that a device can use.
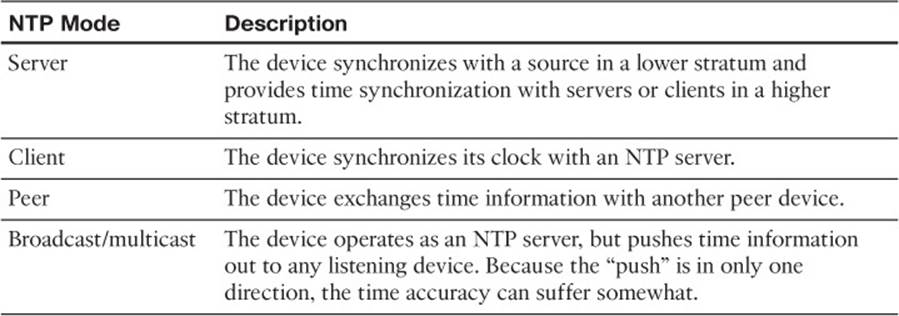
Table 13-2 NTP Modes
To configure NTP on a switch, enter the following command, along with the IP address of an upstream NTP server. You can repeat the ntp server command to specify more than one time source to use. In that case, you can add the prefer keyword to identify which server to prefer over others. By default, NTP Version 3 is used; NTP Version 4 adds IPv6 capability.
Switch(config)# ntp server ip-address [prefer] [version {3 | 4}]
Example 13-1 lists the commands used to enable NTP and use the local NTP server at 192.168.2.168 as an authoritative source. A second server at 24.56.178.140 (time.nist.gov) is added as well.
Example 13-1 Configuring NTP and Identifying Servers
Switch(config)# ntp server 192.168.2.168 prefer
Switch(config)# ntp server 24.56.178.140
After NTP is configured and enabled, you can use the show ntp status command to verify that the switch clock is synchronized to the NTP server. You can also use the show ntp associations command to see a summary of all the NTP relationships a switch has. In Example 13-2, the switch has synchronized its clock with the stratum 1 server at 192.168.2.168. The switch is associated with the server at 192.168.2.168, which uses a GPS receiver as its reference clock, and a server at 24.56.178.140, which uses an atomic clock time source (ACTS).
Example 13-2 Verifying NTP Operation
Switch# show ntp status
Clock is synchronized, stratum 1, reference is 192.168.2.168
nominal freq is 250.0000 Hz, actual freq is 249.9978 Hz, precision is 2**18
reference time is D74EEAB6.8408DB3D (13:15:34.515 EDT Wed Aug 20 2014)
clock offset is -0.0089 msec, root delay is 0.82 msec
root dispersion is 10.45 msec, peer dispersion is 0.03 msec
Switch#
Switch# show ntp associations
address ref clock st when poll reach delay offset disp
*~192.168.2.168 .GPS. 1 335 512 377 3.0 -1.00 0.9
+~24.56.178.140 .ACTS. 1 268 512 377 68.3 -9.90 1.2
* master (synced), # master (unsynced), + selected, - candidate, ~ configured
Switch#
Tip
Be aware that an NTP server can provide accurate time from a global perspective, but it is not able to provide a time zone or seasonal time change information. You should use the clock timezone and clock summer-time commands to configure a switch to reference the NTP time to its local settings.
Securing NTP
Notice that the NTP configurations in the preceding section reference only the IP addresses of NTP servers, implying that time synchronization is open for any device to use. You can take some additional measures to secure NTP in your network.
First, you can enable NTP authentication. The authentication process does not encrypt the NTP data; it is used to authenticate an NTP server so that the NTP client knows it is a trusted source. Without authentication, a client might mistakenly synchronize its clock with an attacker posing as an NTP server.
Use the following global configuration commands to enable NTP authentication. Define an authentication key, then enable authentication, then specify the authentication key number to use when communicating with an NTP server:
Switch(config)# ntp authentication-key key-number md5 key-string
Switch(config)# ntp authenticate
Switch(config)# ntp trusted-key key-number
Switch(config)# ntp server ip-address key key-number
NTP authentication only provides a means to validate the server; it does not limit which IP addresses can synchronize time with the server. In fact, any IP address is permitted to synchronize time, even if an authentication key is configured on the server. You should also consider adding an access list to limit which devices can communicate with a switch using NTP.
Use the following global configuration commands to define an access list and to apply it to NTP operation. Only addresses permitted by the access list are allowed to use NTP services:
Switch(config)# access-list acl-num permit ip-address mask
Switch(config)# ntp access-group {serve-only | serve | peer | query-only} acl-num
For the ntp access-group command, you should use one of the following keywords to specify which type of NTP activity should be permitted:
![]() serve-only: Only synchronization requests are permitted.
serve-only: Only synchronization requests are permitted.
![]() serve: Synchronization and control requests are permitted; the device is not permitted to synchronize its own time clock.
serve: Synchronization and control requests are permitted; the device is not permitted to synchronize its own time clock.
![]() peer: Synchronization and control requests are permitted; the device can synchronize its own time clock.
peer: Synchronization and control requests are permitted; the device can synchronize its own time clock.
![]() query-only: Permit only control queries.
query-only: Permit only control queries.
Using SNTP to Synchronize Time
In the preceding section, you learned that the ntp server command enables NTP so that a switch can synchronize its clock with a specified server. You might be surprised to learn that the command also enables the NTP service on every configured Layer 3 interface so that the switch becomes an NTP server for any other device that tries to synchronize time with it.
As its name implies, the Simplified Network Time Protocol (SNTP) offers a reduced set of NTP functions. When a switch is configured for SNTP, it operates as an NTP client only. In other words, the switch can synchronize its clock with an NTP server, but it cannot allow other devices to synchronize from its own clock. Time synchronization is also simplified, resulting in a slightly less accurate result.
To configure SNTP, use the typical NTP commands and substitute sntp for the ntp keyword. For example, the following SNTP configuration commands correspond to their NTP counterparts:
Switch(config)# sntp authentication-key key-number md5 key-string
Switch(config)# sntp authenticate
Switch(config)# sntp trusted-key key-number
Switch(config)# sntp server ip-address key key-number
Adding Time Stamps to Logging Messages
Finally, you can use the following command to begin using the switch clock as an accurate time stamp for syslog messages:
Switch(config)# service timestamps log datetime [localtime] [show-timezone] [msec]
[year]
Use the localtime keyword to use the local time zone configured on the switch; otherwise, coordinated universal time (UTC) is assumed. Add the show-timezone keyword if you want the time zone name added to the time stamps. Use the msec keyword to add milliseconds and the yearkeyword to add the year to the time stamps.
In the following example, the local time zone and milliseconds have been added into the time stamps of the logging messages shown:
Switch(config)# service timestamps log datetime localtime show-timezone msec
Switch(config)# exit
Switch# show logging
*May 2 02:39:23.871 EDT: %DIAG-SP-6-DIAG_OK: Module 1: Passed Online Diagnostics
*May 2 02:39:27.827 EDT: %HSRP-5-STATECHANGE: Vlan62 Grp 1 state Standby ->
Active
*May 2 02:41:40.431 EDT: %OIR-SP-6-INSCARD: Card inserted in slot 9, interfaces
are now online
*May 3 08:24:13.944 EDT: %IP-4-DUPADDR: Duplicate address 10.1.2.1 on Vlan5,
sourced by 0025.64eb.216f
*May 13 09:55:57.139 EDT: %SYS-5-CONFIG_I: Configured from console by herring on
vty0 (10.1.1.7)
Exam Preparation Tasks
Review All Key Topics
Review the most important topics in the chapter, noted with the Key Topic icon in the outer margin of the page. Table 13-3 lists a reference of these key topics and the page numbers on which each is found.

Table 13-3 Key Topics for Chapter 13
Complete Tables and Lists from Memory
Print a copy of Appendix C, “Memory Tables,” (found on the CD), or at least the section for this chapter, and complete the tables and lists from memory. Appendix D, “Memory Table Answer Key,” also on the CD, includes completed tables and lists to check your work.
Define Key Terms
Define the following key terms from this chapter, and check your answers in the glossary:
NTP
stratum
syslog
syslog severity level
Use Command Reference to Check Your Memory
This section includes the most important configuration and EXEC commands covered in this chapter. It might not be necessary to memorize the complete syntax of every command, but you should remember the basic keywords that are needed.
To test your memory of the port configuration commands, cover the right side of Tables 13-4 and 13-5 with a piece of paper, read the description on the left side, and then see how much of the command you can remember.
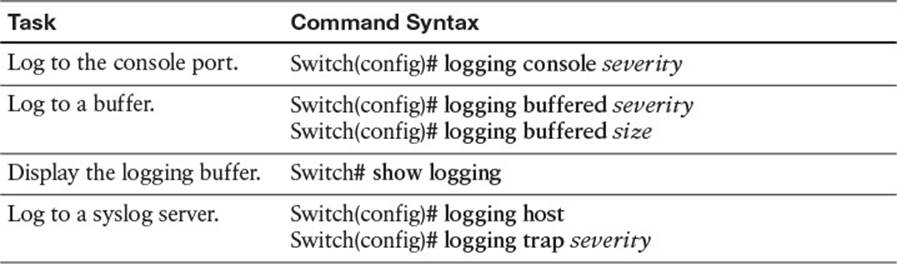
Table 13-4 Switch Logging Configuration Commands
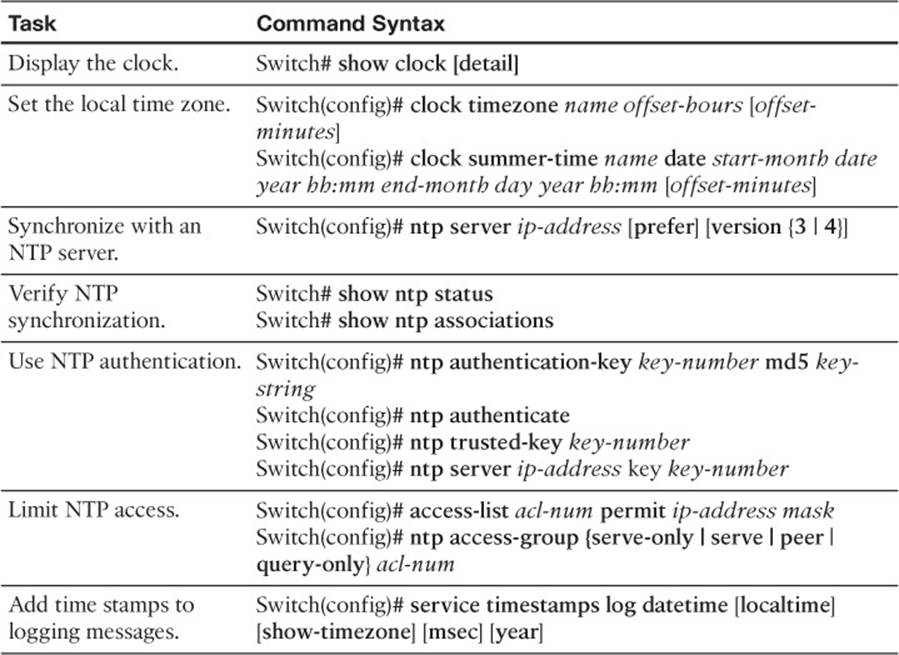
Table 13-5 Time Clock Configuration Commands
Remember that the CCNP exam focuses on practical or hands-on skills that are used by a networking professional. Therefore, you should remember the commands needed to configure and test a switch interface.