PHP, MySQL, JavaScript & HTML5 All-in-One For Dummies (2013)
Book III: JavaScript
Chapter 5: Troubleshooting JavaScript Programs
In This Chapter
![]() Understanding basic troubleshooting techniques
Understanding basic troubleshooting techniques
![]() Installing and using Firebug
Installing and using Firebug
You’ve made it really far in this book and you’ve created a lot of web pages and done some programming too. Everything you’ve learned so far has been teachable. It’s been consistently possible to show an example and explain it. Now you’re going to get into something that doesn’t lend itself to teaching: good troubleshooting techniques.
Sure, certain aspects of troubleshooting are teachable, and this chapter shows and explains them. But even knowing these techniques won’t solve all the problems that you’ll encounter. It’s still up to you to apply the techniques here.
Employing Basic JavaScript Troubleshooting Techniques
The primary technique for troubleshooting technical problems is to stop. Stop what you’re doing and remain calm. We’ve seen countless very smart people falter when things go wrong — and things do go wrong.
 So we repeat: The best piece of advice that we can give for troubleshooting is simply to stop and remain calm.
Once you’ve done that, look at the problem from different angles and reduce it to small parts. For example, you’ll encounter problems with web pages that you’re programming. The problem could be that the page isn’t loading, the page doesn’t look right, or something else. Consider whether the problem is with the database, with the PHP, with the server, with the JavaScript, or none of those — or more than one.
If you think the problem is with the JavaScript, take the JavaScript out of the page entirely. Then slowly add it back in. Another way to troubleshoot JavaScript is by adding the alert() function in various places. As you do your troubleshooting, you can add comments in the code to help with your troubleshooting efforts. Later in this chapter, we show you a plug-in for Firefox that helps immensely when it comes to troubleshooting JavaScript.
Adding alerts
You've seen and used the alert() function throughout the book. A good way to troubleshoot JavaScript is by using the alert() function within the code to show the value of variables or simply to show where you are in the code.
A common occurrence with JavaScript is that you’ll have a long program and you won’t be able to quite figure out why the program isn’t getting all the way through. Adding an alert on line 1 of the program can show you whether or not it’s even getting called. Then adding an alert on line 50 will show if the program is getting that far. If it isn’t, then you know that there must be a problem somewhere between line 1 and line 50.
Adding alerts is an easy and efficient way to help in troubleshooting complex problems. You simply add code like this:
alert("Just executed this code!");
Alternatively, if you need to show the value of a variable named myVariable, you'd do this:
alert(myVariable);
Notice the lack of quotes around the variable name. If you put quotes around the variable name, JavaScript will interpret that as a plain old string and so you’ll only see the name of the variable and not its contents. You could also get fancy and concatenate them:
alert("The value of the variable is: " + myVariable);
That code would show not only friendly text, but also the value of the variable itself.
 Be mindful of using alerts in a loop structure since you need to dismiss each one manually in the browser. Also be sure to remove any alerts prior to releasing the code for production use on your real website. If you don’t, website visitors will find the site really annoying.
Using comments in JavaScript
Comments help with documenting code, which can be greatly helpful when you need to update or change the code later. You can also use comments to help with troubleshooting.
Comments are not only useful for documenting the code, but they can also be helpful for troubleshooting. For example, if you’ve identified a problematic area of the code you can comment that part out temporarily in order to get past the problem.
In JavaScript, comments come in two forms.
![]() //: You can use a double slash as a single line comment.
//: You can use a double slash as a single line comment.
![]() /* and */: You can use the slash-asterisk format for comments that span multiple lines.
/* and */: You can use the slash-asterisk format for comments that span multiple lines.
Here’s an example of the single line comment:
// This is a single line comment.
var myVariable = 77;
In this example, the first line that begins with two slashes will be ignored by the JavaScript interpreter but it will create and assign the variable in the next line because that’s not commented out.
You can comment lines of code out. So in the preceding example, if you wanted to comment out the var myVariable = 77 line, you'd simply add two slashes in front of the line, like this:
// var myVariable = 77;
Anything that appears after the two slashes up to the end of the line is considered a comment and ignored.
If you want to comment out multiple lines or create a multi-line comment, you use a single slash with an asterisk to open the comment block and then an asterisk and single slash to close the block. Anything appearing between these will be ignored. Here’s an example.
/*
Everything within this area is a comment and will be ignored.
This includes normal lines like this and also code lines, like:
if (myVariable = "something") {
return false;
}
*/
In that example, all the code will be ignored because it appears in a comment block.
 It’s important to note when using multi-line comments that you can’t nest them. For example, this is invalid:
/*
Another multi-line comment
/* A comment in a comment */
Ending the comment
*/
Once the JavaScript interpreter encounters the end */ code, it will assume that the comment has ended and therefore won't know what to do with the next */ that it encounters. You can still use the double-slash construction, like this:
/*
Another multi-line comment
// A comment within a comment
Ending the comment
*/
JavaScript can be seen by everyone viewing the source of your web page, so be careful what you display in the comments. Placing sensitive (or offensive) information in the comments of the code can get you in trouble!
Identifying JavaScript Problems with Firebug
Alerts and comments work well as troubleshooting tools in JavaScript. However, an indispensable tool for the JavaScript programmer is a tool called Firebug, which is an add-on to the Firefox web browser. It contains advanced JavaScript debugging tools as well as several other tools related to web development. Firebug identifies problems with JavaScript code as it executes and helps to quickly find solutions.
This section looks at how to install Firebug and then how to use it. We assume that you have Firefox already installed. If you don't, go get it at www.mozilla.org before you continue with the next section.
Firebug isn’t the only tool that can be used for debugging. Internet Explorer has a tool called F12 Developer Tools, and Chrome has its own set of developer tools too. However, Firebug is quite robust and easy to use, so that’s what we cover here.
Installing Firebug
You install Firebug as an add-on for Firefox. Installation is straightforward but does require restarting Firefox afterwards. Follow this procedure to install Firebug.
 Although, this procedure may change slightly by the time you read this, the overall process is the same: Use Firefox to download and install the Firebug add-on. However, the locations and names of links may change.
1. Open Firefox.
2. Navigate to http://getfirebug.com.
3. On the Firebug home page, click Install Firebug (or similar link/button, if the verbiage changes by the time you read this).
4. On the Downloads page, click to download the recommended version of Firebug.
This will usually be the top link for newer versions of Firefox. You initiate the download process by clicking the Download link, which takes you to the Add-ons page.
5. On the Mozilla Add-ons page for Firebug, shown in Figure 5-1, click the Add to Firefox button.
Firebug will download and install.
6. In the Software Installation dialog shown in Figure 5-2, click Install Now.
7. When you are prompted to restart Firefox, click Restart Now.
Firefox will restart and you’ll be shown the Firebug home page again.
Congratulations. Firebug has been installed. Now take a spin around the block with it.
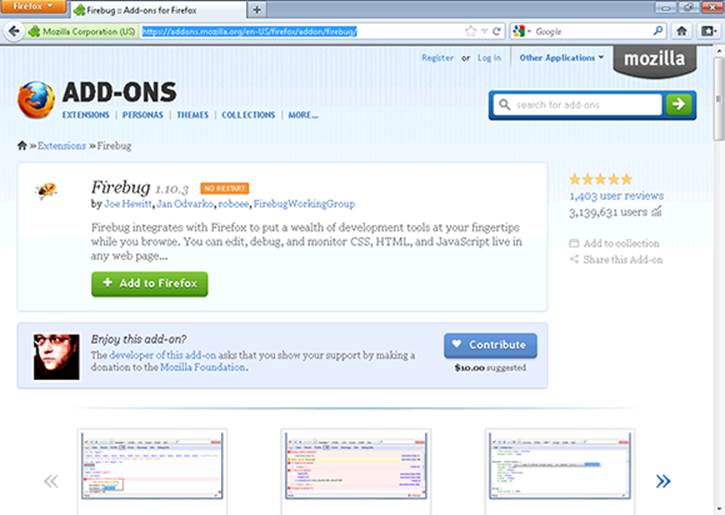
Figure 5-1: The Mozilla Add-ons page for Firebug.
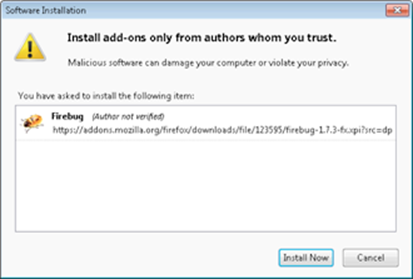
Figure 5-2: Installing the Firebug add-on.
Using Firebug
When Firebug is loaded, it gets put into the toolbar in Firefox. The Firebug icon is typically found in the upper-right corner of Firefox. See Figure 5-3 for an example of what the Firebug icon looks like; we’ve added an arrow to point at the icon.

Figure 5-3: The Firebug icon in Firefox.
Clicking on the Firebug icon reveals the Firebug console, shown in Figure 5-4, for whatever page you’re currently on.
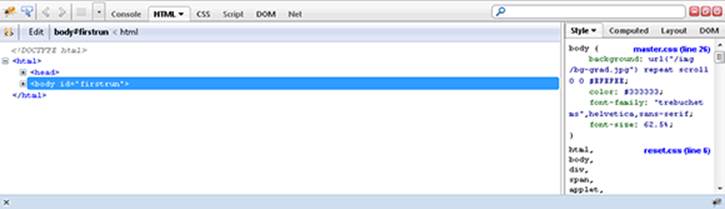
Figure 5-4: The Firebug console.
You can click on the various tabs within the Firebug interface to see some of the options. When debugging JavaScript, you’ll frequently use the Console Panel. However, the Console Panel may be disabled by default, like the one in Figure 5-5.
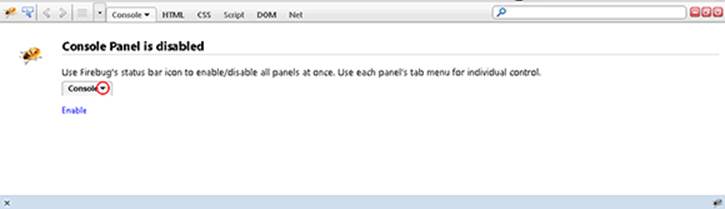
Figure 5-5: The Console Panel is disabled by default in Firebug.
Enabling the Console Panel involves clicking the down arrow next to the word Console and selecting Enabled. When you do so, the Console Panel will be enabled. However, you need to reload the page in order for any errors or other information to show up in the Console Panel. Pressing the Ctrl+R or Command+R key combination reloads the page in Firefox.
The same process is needed to enable other panels in Firebug, such as the Net Panel. The Net Panel shows the retrieval of elements on the page, including all JavaScript, CSS, images, and other elements. It also shows the response code, which can sometimes be helpful to show that a certain file isn’t loading. The Net Panel also shows timing information so you can see how long it took the browser to download the various page elements too. The Net Panel is shown in Figure 5-6.
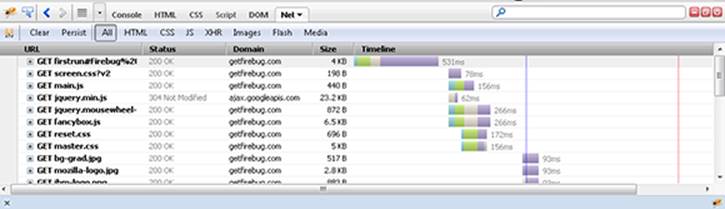
Figure 5-6: The Net Panel in Firebug.
If you’re using Firebug or the Chrome browser, you can also take advantage of another means for troubleshooting, called console.log. Using console.log, the results of whatever you’re debugging are shown within the developer tools area’s Console tab. The console.log feature is used like an alert:
console.log("hello world");
Spend some time with Firebug to get to know its uses and how it can help with your JavaScript programming. Once you get familiar with the tool, it will become indispensable for you!