Apache Flume: Distributed Log Collection for Hadoop, Second Edition (2015)
Chapter 7. Putting It All Together
Now that we've walked through all the components and configurations, let's put together a working end-to-end configuration. This example is by no means exhaustive, nor does it cover every possible scenario you might need, but I think it should cover a couple of common use cases I've seen over and over:
· Finding errors by searching logs across multiple servers in near real time
· Streaming data to HDFS for long-term batch processing
In the first situation, your systems may be impaired, and you have multiple places where you need to search for problems. Bringing all of those logs to a single place that you can search means getting your systems restored quickly. In the second scenario, you are interested in capturing data in the long term for analytics and machine learning.
Web logs to searchable UI
Let's simulate a web application by setting up a simple web server whose logs we want to stream into some searchable application. In this case, we'll be using a Kibana UI to perform ad hoc queries against Elasticsearch.
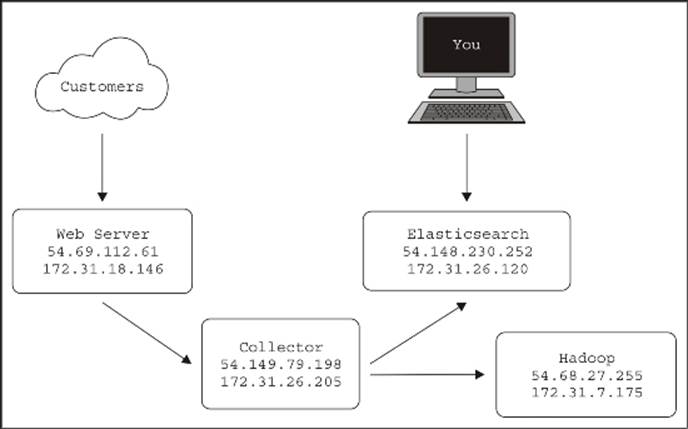
For this example, I'll start three servers in Amazon's Elastic Compute Cluster (EC2), as shown in this diagram:
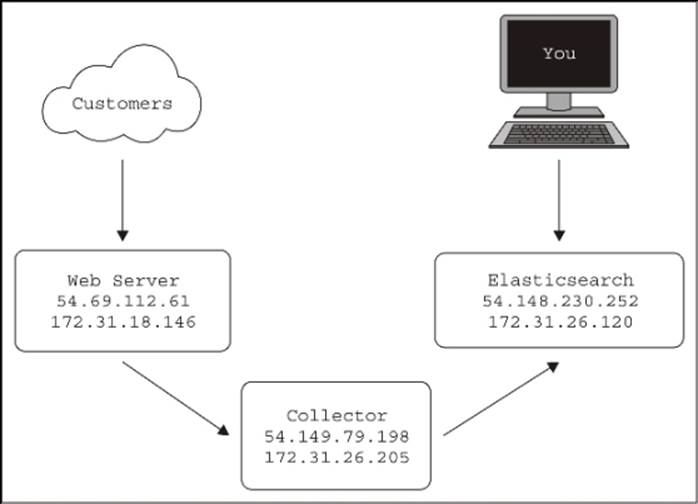
Each server has a public IP (starting with 54) and a private IP (starting with 172). For interserver communication, I'll be using the private IPs in my configurations. My personal interaction with the web server (to simulate traffic) and with Kibana and Elasticsearch will require the public IPs, since I'm sitting in my house and not in Amazon's data centers.
Note
Pay careful attention to the IP addresses in the shell prompts, as we will be jumping from machine to machine, and I don't want you to get lost. For instance, on the Collector box, the prompt will contain its private IP:
[ec2-user@ip-172-31-26-205 ~]$
If you try this out yourself in EC2, you will get different IP assignments, so adjust the configuration files and URLs referenced as needed. For this example, I'll be using Amazon's Linux AMI for an operating system and the t1.micro size server. Also, be sure to adjust the security groups to allow network traffic between these servers (and yourself). When in doubt about connectivity, use utilities such as telnet or nc to test connections between servers and ports.
Tip
While going through this exercise, I made mistakes in my security groups more than once, so perform these tests on connectivity exceptions.
Setting up the web server
Let's start by setting up the web server. For this, we'll install the popular Nginx web server (http://nginx.org). Since web server logs are pretty much standardized nowadays, I could have chosen any web server, but the point here is that this application writes it logs (by default) to a file on the disk. Since I've warned you from trying to use the tail program to stream them, we'll be using a combination of logrotate and the Spooling Directory Source to ingest the data. First, let's log in to the server. The default account with sudo for an Amazon Linux server is ec2-user. You'll need to pass this in your ssh command:
% ssh 54.69.112.61 -l ec2-user
The authenticity of host '54.69.112.61 (54.69.112.61)' can't be established.
RSA key fingerprint is dc:ee:7a:1a:05:e1:36:cd:a4:81:03:97:48:8d:b3:cc.
Are you sure you want to continue connecting (yes/no)? yes
Warning: Permanently added '54.69.112.61' (RSA) to the list of known hosts.
__| __|_ )
_| ( / Amazon Linux AMI
___|\___|___|
https://aws.amazon.com/amazon-linux-ami/2014.09-release-notes/
18 package(s) needed for security, out of 41 available
Run "sudo yum update" to apply all updates.
Now that you are logged in to the server, let's install Nginx (I'm not going to show all of the output to save paper):
[ec2-user@ip-172-31-18-146 ~]$ sudo yum -y install nginx
Loaded plugins: priorities, update-motd, upgrade-helper
Resolving Dependencies
--> Running transaction check
---> Package nginx.x86_64 1:1.6.2-1.22.amzn1 will be installed
[SNIP]
Installed:
nginx.x86_64 1:1.6.2-1.22.amzn1
Dependency Installed:
GeoIP.x86_64 0:1.4.8-1.5.amzn1 gd.x86_64 0:2.0.35-11.10.amzn1 gperftools-libs.x86_64 0:2.0-11.5.amzn1 libXpm.x86_64 0:3.5.10-2.9.amzn1
libunwind.x86_64 0:1.1-2.1.amzn1
Complete!
Next, let's start the Nginx web server:
[ec2-user@ip-172-31-18-146 ~]$ sudo /etc/init.d/nginx start
Starting nginx: [ OK ]
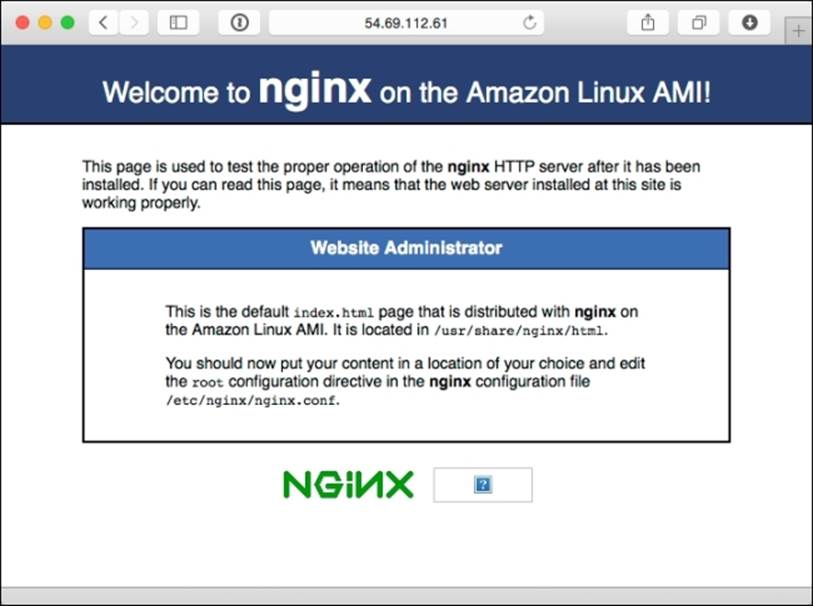
At this point, the web server should be running, so let's use our computer's web browser to go to the public IP, http://54.69.112.61/ in this case. If it is working, you should see the default welcome page, like this:
To help generate a sample input, you can use a load generator program such as Apache benchmark (http://httpd.apache.org/docs/2.4/programs/ab.html) or wrk (https://github.com/wg/wrk). Here is the command I used to generate data for 20 minutes at a time:
% wrk -c 2 -d 20m http://54.69.112.61
Running 20m test @ http://54.69.112.61
2 threads and 2 connections
Configuring log rotation to the spool directory
By default, the server's access logs are written to /var/log/nginx/access.log. The problem we need to overcome here is to move the files to a separate directory while it is still open by the nginx process. This is where logrotate comes into the picture. Let's first create a spool directory that will become the input path for the Spooling Directory Source later on. For the purpose of this example, I'll just create the spool directory in the home directory of ec2-user. In a production environment, you would place the spool directory somewhere else:
[ec2-user@ip-172-31-18-146 ~]$ pwd
/home/ec2-user
[ec2-user@ip-172-31-18-146 ~]$ mkdir spool
Let's also create a logrotate script in the home directory of ec2-user, called rotateAccess.conf. Open an editor and paste these contents (after the prompt) in to a file called accessRotate.conf:
[ec2-user@ip-172-31-18-146 ~]$ cat accessRotate.conf
/var/log/nginx/access.log {
missingok
notifempty
rotate 0
copytruncate
sharedscripts
olddir /home/ec2-user/spool
postrotate
chown ec2-user:ec2-user /home/ec2-user/spool/access.log.1
ts=$(date +%s)
mv /home/ec2-user/spool/access.log.1 /home/ec2-user/spool/access.log.$ts
endscript
}
Let's go over this so that you understand what it is doing. This is by no means a complete introduction to the logrotate utility. Read the online documentation at http://linuxconfig.org/logrotate for more details.
When logrotate runs, it will copy /var/log/nginx/access.log to the /home/ec2-user/spool directory, but only if it has a nonzero length (meaning, there is data to send). The rotate 0 command tells logrotate not to remove any files from the target directory (since the Flume source will do that after it has successfully transmitted each file). We'll make use of the copytruncate feature because it keeps the file open as far as the nginx process is concerned, while resetting it to zero length. This avoids the need to signal nginx that a rotation has just occurred. The destination of the rotated file in the spool directory is /home/ec2-user/spool/access.log.1. Next, in the postrotate script section, we will change the ownership of the file from the root user to ec2-user so that the Flume agent can read it, and later, delete it. Finally, we rename the file with a unique timestamp so that when the next rotation occurs, the access.log.1 file will not exist. This also means that we'll need to add an exclusion rule to the Flume source later to keep it from reading access.log.1 fileuntil the copying process has completed. Once renamed, it is ready to be consumed by Flume.
Now let's try running it in debug mode, which will be just a dry run so that we can see what it can do. Normally, logrotate has a daily rotation setting that prevents it from doing anything unless enough time has passed:
[ec2-user@ip-172-31-18-146 ~]$ sudo /usr/sbin/logrotate -d /home/ec2-user/accessRotate.conf
reading config file /home/ec2-user/accessRotate.conf
reading config info for /var/log/nginx/access.log
olddir is now /home/ec2-user/spool
Handling 1 logs
rotating pattern: /var/log/nginx/access.log 1048576 bytes (no old logs will be kept)
olddir is /home/ec2-user/spool, empty log files are not rotated, old logs are removed
considering log /var/log/nginx/access.log
log does not need rotating
not running postrotate script, since no logs were rotated
Therefore, we will also include the -f (force) flag to override the preceding functionality:
[ec2-user@ip-172-31-18-146 ~]$ sudo /usr/sbin/logrotate -df /home/ec2-user/accessRotate.conf
reading config file /home/ec2-user/accessRotate.conf
reading config info for /var/log/nginx/access.log
olddir is now /home/ec2-user/spool
Handling 1 logs
rotating pattern: /var/log/nginx/access.log forced from command line (no old logs will be kept)
olddir is /home/ec2-user/spool, empty log files are not rotated, old logs are removed
considering log /var/log/nginx/access.log
log needs rotating
rotating log /var/log/nginx/access.log, log->rotateCount is 0
dateext suffix '-20141207'
glob pattern '-[0-9][0-9][0-9][0-9][0-9][0-9][0-9][0-9]'
renaming /home/ec2-user/spool/access.log.1 to /home/ec2-user/spool/access.log.2 (rotatecount 1, logstart 1, i 1),
renaming /home/ec2-user/spool/access.log.0 to /home/ec2-user/spool/access.log.1 (rotatecount 1, logstart 1, i 0),
copying /var/log/nginx/access.log to /home/ec2-user/spool/access.log.1
truncating /var/log/nginx/access.log
running postrotate script
running script with arg /var/log/nginx/access.log : "
chown ec2-user:ec2-user /home/ec2-user/spool/access.log.1
ts=$(date +%s)
mv /home/ec2-user/spool/access.log.1 /home/ec2-user/spool/access.log.$ts
"
removing old log /home/ec2-user/spool/access.log.2
As you can see, logrotate will copy the log to the spool directory with the .1 extension as expected, followed by our script block at the end to change permissions and rename it with a unique timestamp.
Now let's run it again, but this time for real, without the debug flag, and then we will list the source and target directories to see what happened:
[ec2-user@ip-172-31-18-146 ~]$ sudo /usr/sbin/logrotate -f /home/ec2-user/accessRotate.conf
[ec2-user@ip-172-31-18-146 ~]$ ls -l spool/
total 188
-rw-r--r-- 1 ec2-user ec2-user 189344 Dec 7 17:27 access.log.1417973241
[ec2-user@ip-172-31-18-146 ~]$ ls -l /var/log/nginx/
total 4
-rw-r--r-- 1 root root 0 Dec 7 17:27 access.log
-rw-r--r-- 1 root root 520 Dec 7 16:44 error.log
[ec2-user@ip-172-31-18-146 ~]$
You can see the access log is empty and the old contents have been copied to the spool directory, with correct permissions and the filename ending in a unique timestamp.
Let's also verify that the empty access log will result in no action if run without any data. You'll need to include the debug flag to see what the process is thinking:
[ec2-user@ip-172-31-18-146 ~]$ sudo /usr/sbin/logrotate -df /home/ec2-user/accessRotate.conf
reading config file accessRotate.conf
reading config info for /var/log/nginx/access.log
olddir is now /home/ec2-user/spool
Handling 1 logs
rotating pattern: /var/log/nginx/access.log forced from command line (1 rotations)
olddir is /home/ec2-user/spool, empty log files are not rotated, old logs are removed
considering log /var/log/nginx/access.log
log does not need rotating
Now that we have a working rotation script, we need something to run it periodically (not in debug mode) in some chosen interval. For this, we will use the cron daemon (http://en.wikipedia.org/wiki/Cron) by creating a file in the /etc/cron.d directory:
[ec2-user@ip-172-31-18-146 ~]$ cat /etc/cron.d/rotateLogsToSpool
# Move files to spool directory every 5 minutes
*/5 * * * * root /usr/sbin/logrotate -f /home/ec2-user/accessRotate.conf
Here, I've indicated a five-minute interval and to run as the root user. Since the root user owns the original log file, we need elevated access to reassign ownership to ec2-user so that it can be removed later by Flume.
Once you've saved this cron configuration file, you should see our script every 5 minutes (as well as other processes), by inspecting the cron daemon's log file:
[ec2-user@ip-172-31-18-146 ~]$ sudo tail /var/log/cron
Dec 7 17:45:01 ip-172-31-18-146 CROND[22904]: (root) CMD (/usr/sbin/logrotate -f /home/ec2-user/accessRotate.conf)
Dec 7 17:50:01 ip-172-31-18-146 CROND[22929]: (root) CMD (/usr/sbin/logrotate -f /home/ec2-user/accessRotate.conf)
Dec 7 17:54:01 ip-172-31-18-146 anacron[2426]: Job 'cron.weekly' started
Dec 7 17:54:01 ip-172-31-18-146 anacron[2426]: Job 'cron.weekly' terminated
Dec 7 17:55:01 ip-172-31-18-146 CROND[22955]: (root) CMD (/usr/sbin/logrotate -f /home/ec2-user/accessRotate.conf)
Dec 7 18:00:01 ip-172-31-18-146 CROND[23046]: (root) CMD (/usr/sbin/logrotate -f /home/ec2-user/accessRotate.conf)
Dec 7 18:01:01 ip-172-31-18-146 CROND[23060]: (root) CMD (run-parts /etc/cron.hourly)
Dec 7 18:01:01 ip-172-31-18-146 run-parts(/etc/cron.hourly)[23060]: starting 0anacron
Dec 7 18:01:01 ip-172-31-18-146 run-parts(/etc/cron.hourly)[23069]: finished 0anacron
Dec 7 18:05:01 ip-172-31-18-146 CROND[23117]: (root) CMD (/usr/sbin/logrotate -f /home/ec2-user/accessRotate.conf)
An inspection of the spool directory also shows new files created on our arbitrarily chosen 5-minute interval:
[ec2-user@ip-172-31-18-146 ~]$ ls -l spool/
total 1072
-rw-r--r-- 1 ec2-user ec2-user 145029 Dec 7 18:02 access.log.1417975373
-rw-r--r-- 1 ec2-user ec2-user 164169 Dec 7 18:05 access.log.1417975501
-rw-r--r-- 1 ec2-user ec2-user 166779 Dec 7 18:10 access.log.1417975801
-rw-r--r-- 1 ec2-user ec2-user 613785 Dec 7 18:15 access.log.1417976101
Keep in mind that the Nginx RPM package also installed a rotation configuration located at /etc/logrotate.d/nginx to perform daily rotations. If you are going to use this example in production, you'll want to remove the configuration, since we don't want it clashing with our more frequently running cron script. I'll leave handling error.log as an exercise for you. You'll either want to send it someplace (and have Flume remove it) or rotate it periodically so that your disk doesn't fill up over time.
Setting up the target – Elasticsearch
Now let's move to the other server in our diagram and set up Elasticsearch, our destination for searchable data. I'm going to be using the instructions found at http://www.elasticsearch.org/overview/elkdownloads/. First, let's download and install the RPM package:
[ec2-user@ip-172-31-26-120 ~]$ wget https://download.elasticsearch.org/elasticsearch/elasticsearch/elasticsearch-1.4.1.noarch.rpm
--2014-12-07 18:25:35-- https://download.elasticsearch.org/elasticsearch/elasticsearch/elasticsearch-1.4.1.noarch.rpm
Resolving download.elasticsearch.org (download.elasticsearch.org)... 54.225.133.195, 54.243.77.158, 107.22.222.16, ...
Connecting to download.elasticsearch.org (download.elasticsearch.org)|54.225.133.195|:443... connected.
HTTP request sent, awaiting response... 200 OK
Length: 26326154 (25M) [application/x-redhat-package-manager]
Saving to: 'elasticsearch-1.4.1.noarch.rpm'
100%[============================================================================================================>] 26,326,154 9.92MB/s in 2.5s
2014-12-07 18:25:38 (9.92 MB/s) - 'elasticsearch-1.4.1.noarch.rpm' saved [26326154/26326154]
[ec2-user@ip-172-31-26-120 ~]$ sudo rpm -ivh elasticsearch-1.4.1.noarch.rpm
Preparing... ################################# [100%]
Updating / installing...
1:elasticsearch-1.4.1-1 ################################# [100%]
### NOT starting on installation, please execute the following statements to configure elasticsearch to start automatically using chkconfig
sudo /sbin/chkconfig --add elasticsearch
### You can start elasticsearch by executing
sudo service elasticsearch start
The installation is kind enough to tell me how to configure the service to automatically start on system boot-up, and it also tells me to launch the service now, so let's do that:
[ec2-user@ip-172-31-26-120 ~]$ sudo /sbin/chkconfig --add elasticsearch
[ec2-user@ip-172-31-26-120 ~]$ sudo service elasticsearch start
Starting elasticsearch: [ OK ]
Let's perform a quick test with curl to verify that it is running on the default port, which is 9200:
[ec2-user@ip-172-31-26-120 ~]$ curl http://localhost:9200/
{
"status" : 200,
"name" : "Siege",
"cluster_name" : "elasticsearch",
"version" : {
"number" : "1.4.1",
"build_hash" : "89d3241d670db65f994242c8e8383b169779e2d4",
"build_timestamp" : "2014-11-26T15:49:29Z",
"build_snapshot" : false,
"lucene_version" : "4.10.2"
},
"tagline" : "You Know, for Search"
}
Since the indexes are created as data comes in, and we haven't sent any data, we expect to see no indexes created yet:
[ec2-user@ip-172-31-26-120 ~]$ curl http://localhost:9200/_cat/indices?v
health status index pri rep docs.count docs.deleted store.size pri.store.size
All we see is the header with no indexes listed, so let's head over to the collector server and set up the Flume relay which will write data to Elasticsearch.
Setting up Flume on collector/relay
The Flume configuration on the Flume collector will be compressed Avro coming in and Elasticsearch going out. Go ahead and log in to the collector server (172.31.26.205).
Let's start by downloading the Flume binary from the Apache website. Follow the download link and select a mirror:
[ec2-user@ip-172-31-26-205 ~]$ wget http://apache.arvixe.com/flume/1.5.2/apache-flume-1.5.2-bin.tar.gz
--2014-12-07 19:50:30-- http://apache.arvixe.com/flume/1.5.2/apache-flume-1.5.2-bin.tar.gz
Resolving apache.arvixe.com (apache.arvixe.com)... 198.58.87.82
Connecting to apache.arvixe.com (apache.arvixe.com)|198.58.87.82|:80... connected.
HTTP request sent, awaiting response... 200 OK
Length: 25323459 (24M) [application/x-gzip]
Saving to: 'apache-flume-1.5.2-bin.tar.gz'
100%[==========================>] 25,323,459 8.38MB/s in 2.9s
2014-12-07 19:50:33 (8.38 MB/s) - 'apache-flume-1.5.2-bin.tar.gz' saved [25323459/25323459]
Next, expand and change directories:
[ec2-user@ip-172-31-26-205 ~]$ tar -zxf apache-flume-1.5.2-bin.tar.gz
[ec2-user@ip-172-31-26-205 ~]$ cd apache-flume-1.5.2-bin
[ec2-user@ip-172-31-26-205 apache-flume-1.5.2-bin]$
Create the configuration file, called collector.conf, in Flume's configuration directory using your favorite editor:
[ec2-user@ip-172-31-18-146 apache-flume-1.5.2-bin]$ cat conf/collector.conf
collector.sources = av
collector.channels = m1
collector.sinks = es
collector.sources.av.type=avro
collector.sources.av.bind=0.0.0.0
collector.sources.av.port=12345
collector.sources.av.compression-type=deflate
collector.sources.av.channels=m1
collector.channels.m1.type=memory
collector.channels.m1.capacity=10000
collector.sinks.es.type=org.apache.flume.sink.elasticsearch.ElasticSearchSink
collector.sinks.es.channel=m1
collector.sinks.es.hostNames=172.31.26.120
Here, you can see that we are using a simple memory channel configured with a capacity of 10,000 events.
The source is configured to accept compressed Avro on port 12345 and pass it to our memory channel.
Finally, the sink is configured to write to Elasticsearch on the server we just set up at the 172.31.26.120 private IP. We are using the default settings, which means it'll write to the index named flume-YYYY-MM-DD with the log type.
Let's try running the Flume agent:
[ec2-user@ip-172-31-26-205 apache-flume-1.5.2-bin]$ ./bin/flume-ng agent -n collector -c conf -f conf/collector.conf -Dflume.root.logger=INFO,console
You'll see an exception in the log, including something like this:
2014-12-07 20:00:13,184 (conf-file-poller-0) [ERROR - org.apache.flume.node.PollingPropertiesFileConfigurationProvider$FileWatcherRunnable.run(PollingPropertiesFileConfigurationProvider.java:145)] Failed to start agent because dependencies were not found in classpath. Error follows.
java.lang.NoClassDefFoundError: org/elasticsearch/common/io/BytesStream
The Flume agent can't find the Elasticsearch classes. Remember that these are not packaged with Flume, as the libraries need to be compatible with the version of Elasticsearch you are running. Looking back at the Elasticsearch server, we can get an idea of whatwe need. Remember that this list includes many runtime server dependencies, so it is probably more than what you'll need for a functional Elasticsearch client:
[ec2-user@ip-172-31-26-120 ~]$ rpm -qil elasticsearch | grep jar
/usr/share/elasticsearch/lib/elasticsearch-1.4.1.jar
/usr/share/elasticsearch/lib/groovy-all-2.3.2.jar
/usr/share/elasticsearch/lib/jna-4.1.0.jar
/usr/share/elasticsearch/lib/jts-1.13.jar
/usr/share/elasticsearch/lib/log4j-1.2.17.jar
/usr/share/elasticsearch/lib/lucene-analyzers-common-4.10.2.jar
/usr/share/elasticsearch/lib/lucene-core-4.10.2.jar
/usr/share/elasticsearch/lib/lucene-expressions-4.10.2.jar
/usr/share/elasticsearch/lib/lucene-grouping-4.10.2.jar
/usr/share/elasticsearch/lib/lucene-highlighter-4.10.2.jar
/usr/share/elasticsearch/lib/lucene-join-4.10.2.jar
/usr/share/elasticsearch/lib/lucene-memory-4.10.2.jar
/usr/share/elasticsearch/lib/lucene-misc-4.10.2.jar
/usr/share/elasticsearch/lib/lucene-queries-4.10.2.jar
/usr/share/elasticsearch/lib/lucene-queryparser-4.10.2.jar
/usr/share/elasticsearch/lib/lucene-sandbox-4.10.2.jar
/usr/share/elasticsearch/lib/lucene-spatial-4.10.2.jar
/usr/share/elasticsearch/lib/lucene-suggest-4.10.2.jar
/usr/share/elasticsearch/lib/sigar/sigar-1.6.4.jar
/usr/share/elasticsearch/lib/spatial4j-0.4.1.jar
Really, you only need the elasticsearch.jar file and its dependencies, but we are going to be lazy and just download the RPM again in the collector machine, and copy the JAR files to Flume:
[ec2-user@ip-172-31-26-205 ~]$ wget https://download.elasticsearch.org/elasticsearch/elasticsearch/elasticsearch-1.4.1.noarch.rpm
--2014-12-07 20:03:38-- https://download.elasticsearch.org/elasticsearch/elasticsearch/elasticsearch-1.4.1.noarch.rpm
Resolving download.elasticsearch.org (download.elasticsearch.org)... 54.225.133.195, 54.243.77.158, 107.22.222.16, ...
Connecting to download.elasticsearch.org (download.elasticsearch.org)|54.225.133.195|:443... connected.
HTTP request sent, awaiting response... 200 OK
Length: 26326154 (25M) [application/x-redhat-package-manager]
Saving to: 'elasticsearch-1.4.1.noarch.rpm'
100%[============================================================================================================>] 26,326,154 9.70MB/s in 2.6s
2014-12-07 20:03:41 (9.70 MB/s) - 'elasticsearch-1.4.1.noarch.rpm' saved [26326154/26326154]
[ec2-user@ip-172-31-26-205 ~]$ sudo rpm -ivh elasticsearch-1.4.1.noarch.rpm
Preparing... ################################# [100%]
Updating / installing...
1:elasticsearch-1.4.1-1 ################################# [100%]
### NOT starting on installation, please execute the following statements to configure elasticsearch to start automatically using chkconfig
sudo /sbin/chkconfig --add elasticsearch
### You can start elasticsearch by executing
sudo service elasticsearch start
This time we will not configure the service to start. Instead, we'll copy the JAR files we need to Flume's plugins directory architecture, which we learned about in the previous chapter:
[ec2-user@ip-172-31-26-205 ~]$ cd apache-flume-1.5.2-bin
[ec2-user@ip-172-31-26-205 apache-flume-1.5.2-bin]$ mkdir -p plugins.d/elasticsearch/libext
[ec2-user@ip-172-31-26-205 apache-flume-1.5.2-bin]$ cp /usr/share/elasticsearch/lib/*.jar plugins.d/elasticsearch/libext/
Now try running the Flume agent again:
[ec2-user@ip-172-31-26-205 apache-flume-1.5.2-bin]$ ./bin/flume-ng agent -n collector -c conf -f conf/collector.conf -Dflume.root.logger=INFO,console
No exceptions this time around, but still no data. Let's go back to the web server machine and set up the final Flume agent.
Setting up Flume on the client
On the first server, the web server, let's download the Flume binaries again and expand the package:
[ec2-user@ip-172-31-18-146 ~]$ wget http://apache.arvixe.com/flume/1.5.2/apache-flume-1.5.2-bin.tar.gz
--2014-12-07 20:12:53-- http://apache.arvixe.com/flume/1.5.2/apache-flume-1.5.2-bin.tar.gz
Resolving apache.arvixe.com (apache.arvixe.com)... 198.58.87.82
Connecting to apache.arvixe.com (apache.arvixe.com)|198.58.87.82|:80... connected.
HTTP request sent, awaiting response... 200 OK
Length: 25323459 (24M) [application/x-gzip]
Saving to: 'apache-flume-1.5.2-bin.tar.gz'
100%[=========================>] 25,323,459 8.13MB/s in 3.0s
2014-12-07 20:12:56 (8.13 MB/s) - 'apache-flume-1.5.2-bin.tar.gz' saved [25323459/25323459]
[ec2-user@ip-172-31-18-146 ~]$ tar -zxf apache-flume-1.5.2-bin.tar.gz
[ec2-user@ip-172-31-18-146 ~]$ cd apache-flume-1.5.2-bin
This time, our Flume configuration takes the spool directory we set up before, with logrotate as input, and it needs to write compressed Avro as the collector server. Open an editor and create the client.conf file using your favorite editor:
[ec2-user@ip-172-31-18-146 apache-flume-1.5.2-bin]$ cat conf/client.conf
client.sources = sd
client.channels = m1
client.sinks = av
client.sources.sd.type=spooldir
client.sources.sd.spoolDir=/home/ec2-user/spool
client.sources.sd.deletePolicy=immediate
client.sources.sd.ignorePattern=access.log.1$
client.sources.sd.channels=m1
client.channels.m1.type=memory
client.channels.m1.capacity=10000
client.sinks.av.type=avro
client.sinks.av.hostname=172.31.26.205
client.sinks.av.port=12345
client.sinks.av.compression-type=deflate
client.sinks.av.channel=m1
Again, for simplicity, we are using a memory channel with 10,000-record capacity.
For the source, we configure the Spooling Directory Source with /home/ec2-user/spool as the input. Additionally, we configure the deletion policy to remove the files after sending is complete. This is also where we set up the exclusion rule for the access.log.1 filename pattern mentioned earlier. Note the dollar sign at the end of the filename, denoting the end of the line. Without this, the exclusion pattern would also exclude valid files, such as access.log.1417975373.
Finally, an Avro sink is configured to point at the collector's private IP and port 12345. Additionally, we set the compression so that it matches the receiving Avro source's settings.
Now let's try running the agent:
[ec2-user@ip-172-31-18-146 apache-flume-1.5.2-bin]$ ./bin/flume-ng agent -n client -c conf -f conf/client.conf -Dflume.root.logger=INFO,console
No exceptions! But more importantly, I see the log files in the spool directory being processed and deleted:
2014-12-07 20:59:04,041 (pool-4-thread-1) [INFO - org.apache.flume.client.avro.ReliableSpoolingFileEventReader.deleteCurrentFile(ReliableSpoolingFileEventReader.java:390)] Preparing to delete file /home/ec2-user/spool/access.log.1417976401
2014-12-07 20:59:05,319 (pool-4-thread-1) [INFO - org.apache.flume.client.avro.ReliableSpoolingFileEventReader.deleteCurrentFile(ReliableSpoolingFileEventReader.java:390)] Preparing to delete file /home/ec2-user/spool/access.log.1417976701
2014-12-07 20:59:06,245 (pool-4-thread-1) [INFO - org.apache.flume.client.avro.ReliableSpoolingFileEventReader.deleteCurrentFile(ReliableSpoolingFileEventReader.java:390)] Preparing to delete file /home/ec2-user/spool/access.log.1417977001
2014-12-07 20:59:06,245 (pool-4-thread-1) [INFO - org.apache.flume.source.SpoolDirectorySource$SpoolDirectoryRunnable.run(SpoolDirectorySource.java:254)] Spooling Directory Source runner has shutdown.
2014-12-07 20:59:06,746 (pool-4-thread-1) [INFO - org.apache.flume.source.SpoolDirectorySource$SpoolDirectoryRunnable.run(SpoolDirectorySource.java:254)] Spooling Directory Source runner has shutdown.
Once all the files have been processed, the last lines are repeated every 500 milliseconds. This is a known bug in Flume (https://issues.apache.org/jira/browse/FLUME-2385). It has already been fixed and is slated for the 1.6.0 release, so be sure to set up log rotation on your Flume agent and clean up this mess before you run out of disk space.
On the collector box, we see writes occurring to Elasticsearch:
2014-12-07 22:10:03,694 (SinkRunner-PollingRunner-DefaultSinkProcessor) [INFO - org.apache.flume.sink.elasticsearch.client.ElasticSearchTransportClient.execute(ElasticSearchTransportClient.java:181)] Sending bulk to elasticsearch cluster
Querying the Elasticsearch REST API, we can see an index with records:
[ec2-user@ip-172-31-26-120 ~]$ curl http://localhost:9200/_cat/indices?v
health status index pri rep docs.count docs.deleted store.size pri.store.size
yellow open flume-2014-12-07 5 1 32102 0 1.3mb 1.3mb
Let's read the first 5 records:
[ec2-user@ip-172-31-26-120 elasticsearch]$ curl -XGET 'http://localhost:9200/flume-2014-12-07/_search?pretty=true&q=*.*&size=5'
{
"took" : 26,
"timed_out" : false,
"_shards" : {
"total" : 5,
"successful" : 5,
"failed" : 0
},
"hits" : {
"total" : 32102,
"max_score" : 1.0,
"hits" : [ {
"_index" : "flume-2014-12-07",
"_type" : "log",
"_id" : "AUomjGVVbObD75ecNqJg",
"_score" : 1.0,
"_source":{"@message":"207.222.127.224 - - [07/Dec/2014:18:01:47 +0000] \"GET / HTTP/1.1\" 200 3770 \"-\" \"-\" \"-\"","@fields":{}}
}, {
"_index" : "flume-2014-12-07",
"_type" : "log",
"_id" : "AUomjGVWbObD75ecNqJj",
"_score" : 1.0,
"_source":{"@message":"207.222.127.224 - - [07/Dec/2014:18:01:47 +0000] \"GET / HTTP/1.1\" 200 3770 \"-\" \"-\" \"-\"","@fields":{}}
}, {
"_index" : "flume-2014-12-07",
"_type" : "log",
"_id" : "AUomjGVWbObD75ecNqJo",
"_score" : 1.0,
"_source":{"@message":"207.222.127.224 - - [07/Dec/2014:18:01:47 +0000] \"GET / HTTP/1.1\" 200 3770 \"-\" \"-\" \"-\"","@fields":{}}
}, {
"_index" : "flume-2014-12-07",
"_type" : "log",
"_id" : "AUomjGVWbObD75ecNqJt",
"_score" : 1.0,
"_source":{"@message":"207.222.127.224 - - [07/Dec/2014:18:01:47 +0000] \"GET / HTTP/1.1\" 200 3770 \"-\" \"-\" \"-\"","@fields":{}}
}, {
"_index" : "flume-2014-12-07",
"_type" : "log",
"_id" : "AUomjGVWbObD75ecNqJy",
"_score" : 1.0,
"_source":{"@message":"207.222.127.224 - - [07/Dec/2014:18:01:47 +0000] \"GET / HTTP/1.1\" 200 3770 \"-\" \"-\" \"-\"","@fields":{}}
} ]
}
}
As you can see, the log lines are in there under the @message field, and they can now be searched. However, we can do better. Let's break that message down into searchable fields.
Creating more search fields with an interceptor
Let's borrow some code from what we covered earlier in this book to extract some Flume headers from this common log format, knowing that all Flume headers will become fields in Elasticsearch. Since we are creating fields to be searched by in Elasticsearch, I'm going to add them to the collector's configuration rather than the web server's Flume agent.
Change the agent configuration on the collector to include a Regular Expression Extractor interceptor:
[ec2-user@ip-172-31-18-146 apache-flume-1.5.2-bin]$ cat conf/collector.conf
collector.sources = av
collector.channels = m1
collector.sinks = es
collector.sources.av.type=avro
collector.sources.av.bind=0.0.0.0
collector.sources.av.port=12345
collector.sources.av.compression-type=deflate
collector.sources.av.channels=m1
collector.sources.av.interceptors=e1
collector.sources.av.interceptors.e1.type=regex_extractor
collector.sources.av.interceptors.e1.regex=^([\\d.]+) \\S+ \\S+ \\[([\\w:/]+\\s[+\\-]\\d{4})\\] \"(.+?)\" (\\d{3}) (\\d+)
collector.sources.av.interceptors.e1.serializers=ip dt url sc bc
collector.sources.av.interceptors.e1.serializers.ip.name=source
collector.sources.av.interceptors.e1.serializers.dt.type=org.apache.flume.interceptor.RegexExtractorInterceptorMillisSerializer
collector.sources.av.interceptors.e1.serializers.dt.pattern=dd/MMM/yyyy:dd:HH:mm:ss Z
collector.sources.av.interceptors.e1.serializers.dt.name=timestamp
collector.sources.av.interceptors.e1.serializers.url.name=http_request
collector.sources.av.interceptors.e1.serializers.sc.name=status_code
collector.sources.av.interceptors.e1.serializers.bc.name=bytes_xfered
collector.channels.m1.type=memory
collector.channels.m1.capacity=10000
collector.sinks.es.type=org.apache.flume.sink.elasticsearch.ElasticSearchSink
collector.sinks.es.channel=m1
collector.sinks.es.hostNames=172.31.26.120
To follow the Logstash convention, I've renamed the hostname header to source. Now, to make the new format easy to find, I'm going to delete the existing index:
[ec2-user@ip-172-31-26-120 ~]$ curl -XDELETE 'http://localhost:9200/flume-2014-12-07/'
{"acknowledged":true}
[ec2-user@ip-172-31-26-120 ~]$ curl -XGET 'http://localhost:9200/flume-2014-12-07/_search?pretty=true&q=*.*&size=5'
{
"error" : "IndexMissingException[[flume-2014-12-07] missing]",
"status" : 404
}
Next, I create more traffic on my web server and wait for it to appear at the other end. Then I query some records to see what it looks like:
[ec2-user@ip-172-31-26-120 ~]$ curl -XGET 'http://localhost:9200/flume-2014-12-07/_search?pretty=true&q=*.*&size=5'
{
"took" : 95,
"timed_out" : false,
"_shards" : {
"total" : 5,
"successful" : 5,
"failed" : 0
},
"hits" : {
"total" : 12083,
"max_score" : 1.0,
"hits" : [ {
"_index" : "flume-2014-12-07",
"_type" : "log",
"_id" : "AUomq4FnbObD75ecNx_H",
"_score" : 1.0,
"_source":{"@message":"207.222.127.224 - - [07/Dec/2014:18:13:15 +0000] \"GET / HTTP/1.1\" 200 3770 \"-\" \"-\" \"-\"","@timestamp":"2014-12-07T18:13:15.000Z","@source":"207.222.127.224","@fields":{"timestamp":"1417975995000","status_code":"200","source":"207.222.127.224","http_request":"GET / HTTP/1.1","bytes_xfered":"3770"}}
}, {
"_index" : "flume-2014-12-07",
"_type" : "log",
"_id" : "AUomq4FnbObD75ecNx_M",
"_score" : 1.0,
"_source":{"@message":"207.222.127.224 - - [07/Dec/2014:18:13:16 +0000] \"GET / HTTP/1.1\" 200 3770 \"-\" \"-\" \"-\"","@timestamp":"2014-12-07T18:13:16.000Z","@source":"207.222.127.224","@fields":{"timestamp":"1417975996000","status_code":"200","source":"207.222.127.224","http_request":"GET / HTTP/1.1","bytes_xfered":"3770"}}
}, {
"_index" : "flume-2014-12-07",
"_type" : "log",
"_id" : "AUomq4FnbObD75ecNx_R",
"_score" : 1.0,
"_source":{"@message":"207.222.127.224 - - [07/Dec/2014:18:13:16 +0000] \"GET / HTTP/1.1\" 200 3770 \"-\" \"-\" \"-\"","@timestamp":"2014-12-07T18:13:16.000Z","@source":"207.222.127.224","@fields":{"timestamp":"1417975996000","status_code":"200","source":"207.222.127.224","http_request":"GET / HTTP/1.1","bytes_xfered":"3770"}}
}, {
"_index" : "flume-2014-12-07",
"_type" : "log",
"_id" : "AUomq4FnbObD75ecNx_W",
"_score" : 1.0,
"_source":{"@message":"207.222.127.224 - - [07/Dec/2014:18:13:16 +0000] \"GET / HTTP/1.1\" 200 3770 \"-\" \"-\" \"-\"","@timestamp":"2014-12-07T18:13:16.000Z","@source":"207.222.127.224","@fields":{"timestamp":"1417975996000","status_code":"200","source":"207.222.127.224","http_request":"GET / HTTP/1.1","bytes_xfered":"3770"}}
}, {
"_index" : "flume-2014-12-07",
"_type" : "log",
"_id" : "AUomq4FnbObD75ecNx_a",
"_score" : 1.0,
"_source":{"@message":"207.222.127.224 - - [07/Dec/2014:18:13:16 +0000] \"GET / HTTP/1.1\" 200 3770 \"-\" \"-\" \"-\"","@timestamp":"2014-12-07T18:13:16.000Z","@source":"207.222.127.224","@fields":{"timestamp":"1417975996000","status_code":"200","source":"207.222.127.224","http_request":"GET / HTTP/1.1","bytes_xfered":"3770"}}
} ]
}
}
As you can see, we now have additional fields that we can search by. Additionally, you can see that Elasticsearch has taken our millisecond-based timestamp field and created its own @timestamp field in ISO-8601 format.
Now we can do some more interesting queries such as finding out how many successful (status 200) pages we saw:
[ec2-user@ip-172-31-26-120 elasticsearch]$ curl -XGET 'http://localhost:9200/flume-2014-12-07/_count' -d '{"query":{"term":{"status_code":"200"}}}'
{"count":46018,"_shards":{"total":5,"successful":5,"failed":0}}
Setting up a better user interface – Kibana
While it appears as if we are done, there is one more thing we should do. The data is all there, but you need to be an expert in querying Elasticsearch to make good use of the information. After all, if the data is difficult to consume and gets ignored, then why bother collecting it at all? What you really need is a nice, searchable web interface that humans with non-technical backgrounds can use. For this, we are going to set up Kibana. In a nutshell, Kibana is a web application that runs as a dynamic HTML page on your browser, making calls for data to Elasticsearch when necessary. The result is an interactive web interface that doesn't require you to learn the details of the Elasticsearch query API. This is not the only option available to you; it is just what I'm using in this example. Let's download Kibana 3 from the Elasticsearch website, and install this on the same server (although you could easily serve this from another HTTP server):
[ec2-user@ip-172-31-26-120 ~]$ wget https://download.elasticsearch.org/kibana/kibana/kibana-3.1.2.tar.gz
--2014-12-07 18:31:16-- https://download.elasticsearch.org/kibana/kibana/kibana-3.1.2.tar.gz
Resolving download.elasticsearch.org (download.elasticsearch.org)... 54.225.133.195, 54.243.77.158, 107.22.222.16, ...
Connecting to download.elasticsearch.org (download.elasticsearch.org)|54.225.133.195|:443... connected.
HTTP request sent, awaiting response... 200 OK
Length: 1074306 (1.0M) [application/octet-stream]
Saving to: 'kibana-3.1.2.tar.gz'
100%[============================================================================================================>] 1,074,306 1.33MB/s in 0.8s
2014-12-07 18:31:17 (1.33 MB/s) - 'kibana-3.1.2.tar.gz' saved [1074306/1074306]
[ec2-user@ip-172-31-26-120 ~]$ tar -zxf kibana-3.1.2.tar.gz
[ec2-user@ip-172-31-26-120 ~]$ cd kibana-3.1.2
Note
At the time of writing this book, a newer version of Kibana (Kibana 4) is in beta. These instructions may be outdated by the time this book is released, but rest assured that somewhere in the Kibana setup, you can edit a configuration file to point to your Elasticsearch server. I have not tried out the newer version yet, but there is a good overview of it on the Elasticsearch blog at http://www.elasticsearch.org/blog/kibana-4-beta-3-now-more-filtery.
Open the config.js file to edit the line with the elasticsearch key. This needs to be the URL of the public name or IP of the Elasticsearch API. For our example, this line should look as shown here:
elasticsearch: 'http://ec2-54-148-230-252.us-west-2.compute.amazonaws.com:9200',
Now we need to provide this directory with a web browser. Let's download and install Nginx again:
[ec2-user@ip-172-31-26-120 ~]$ sudo yum install nginx
By default, the root directory is /usr/share/nginx/html. We can change this configuration in Nginx, but to make things easy, let's just create a symbolic link to point to the right location. First, move the original path out of the way by renaming it:
[ec2-user@ip-172-31-26-120 ~]$ sudo mv /usr/share/nginx/html /usr/share/nginx/html.dist
Next, link the configured Kibana directory as the new web root:
[ec2-user@ip-172-31-26-120 ~]$ sudo ln -s ~/kibana-3.1.2 /usr/share/nginx/html
Finally, start the web server:
[ec2-user@ip-172-31-26-120 ~]$ sudo /etc/init.d/nginx start
Starting nginx: [ OK ]
From your computer, go to http://54.148.230.252/. If you see this page, it means you may have made a mistake in your Kibana configuration:
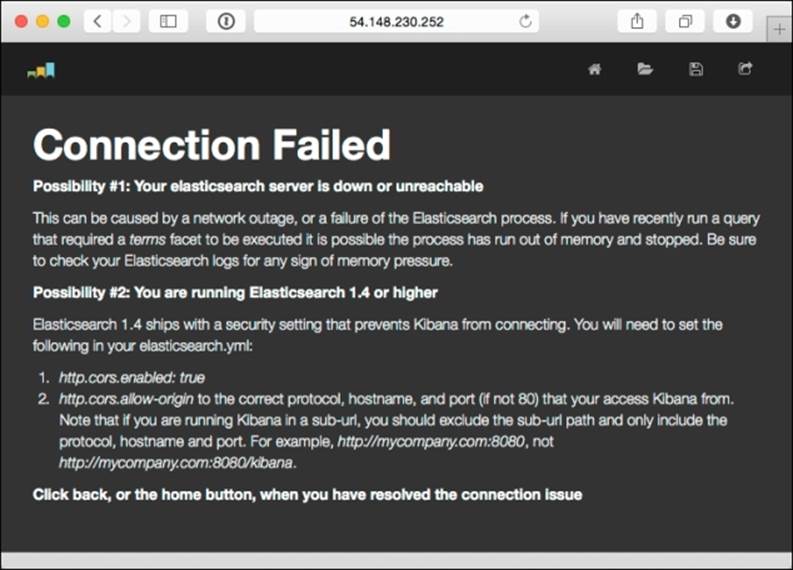
This error page means your web browser can't connect to Elasticsearch. You may need to clear your browser cache if you fixed the configuration, as web pages are typically cached locally for some period of time. If you got it right, the screen should look like this:
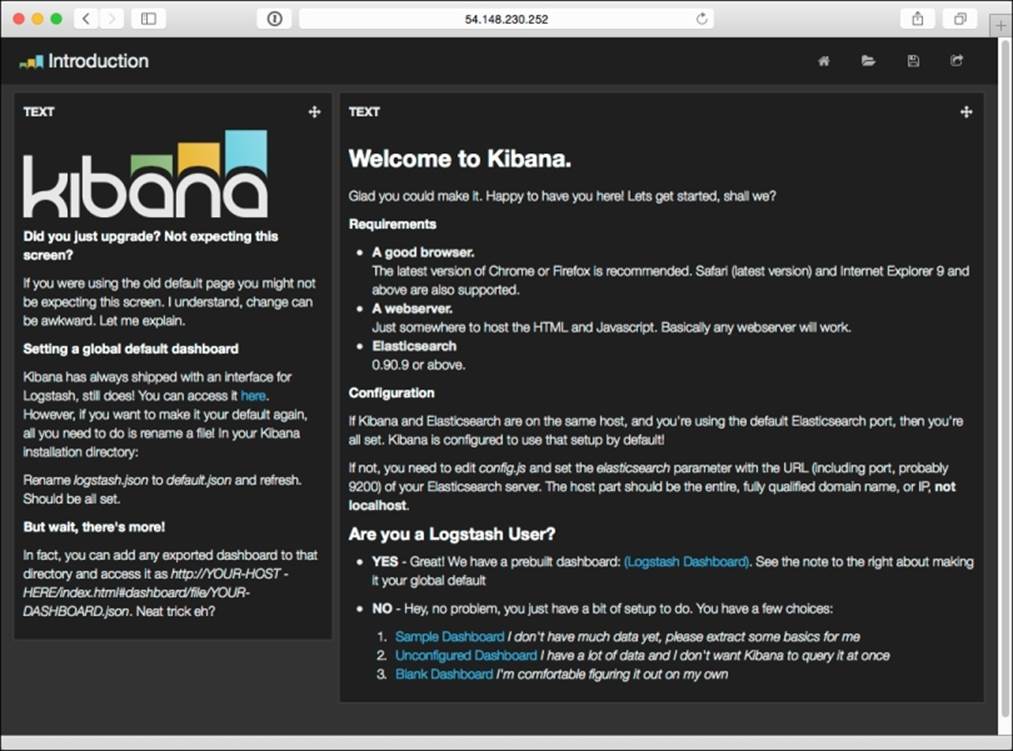
Go ahead and select Sample Dashboard, the first option. You should see something like what is shown in the next screenshot. This includes some of the data we ingested, record counts in the center, and the filtering fields in the left-hand margin.
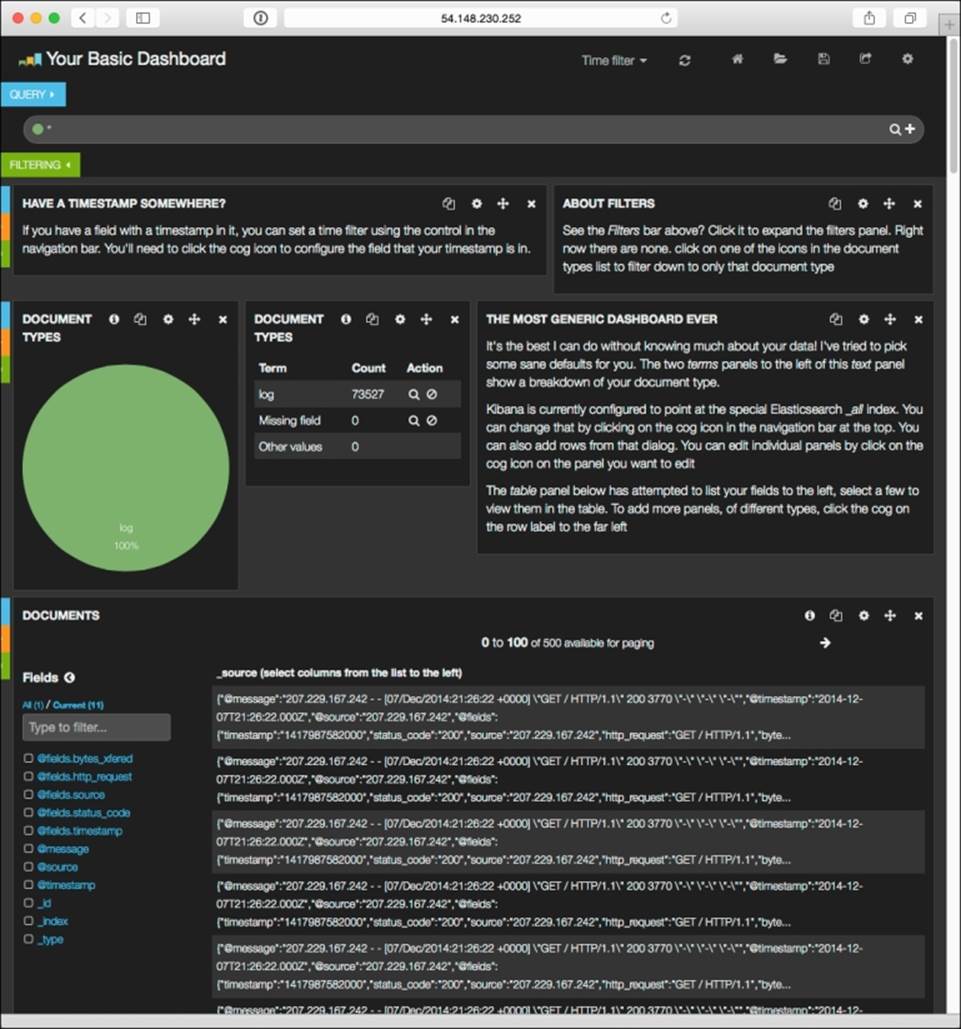
I'm not going to claim to be a Kibana expert (I'm far from that), so I'll leave further customization of this to you. Use this as a base to go back and make additional modifications to the data to make it easier to consume, search, or filter. To do that, you'll probably need to get more familiar with how Elasticsearch works, but that's okay because knowledge isn't a bad thing. A copious amount of documentation is waiting for you at http://www.elasticsearch.org/guide/en/kibana/current/index.html.
At this point, we have completed an end-to-end implementation of data from a web server streamed in a near real-time fashion to a web-based tool for searching. Since both the source and target formats were dictated by others, we used an interceptor to transform the data en route. This use case is very good for short-term troubleshooting, but it's clearly not very "Hadoopy" since we have yet to use core Hadoop.
Archiving to HDFS
When people speak of Hadoop, they usually refer to storing lots of data for a long time, usually in HDFS, so more interesting data science or machine learning can be done later. Let's extend our use case by splitting the data flow at the collector to store an extra copy in HDFS for later use.
So, back in Amazon AWS, I start a fourth server to run Hadoop. If you plan on doing all your work in Hadoop, you'll probably want to write this data to S3, but for this example, let's stick with HDFS. Now our server diagram looks like this:
I used Cloudera's one-line installation instructions to speed up the setup. It's instructions can be found at http://www.cloudera.com/content/cloudera/en/documentation/core/latest/topics/cdh_qs_mrv1_pseudo.html.
Since the Amazon AMI is compatible with Enterprise Linux 6, I selected the EL6 RPM Repository and imported the corresponding GPG key:
[ec2-user@ip-172-31-7-175 ~]$ sudo rpm -ivh http://archive.cloudera.com/cdh5/one-click-install/redhat/6/x86_64/cloudera-cdh-5-0.x86_64.rpm
Retrieving http://archive.cloudera.com/cdh5/one-click-install/redhat/6/x86_64/cloudera-cdh-5-0.x86_64.rpm
Preparing... ################################# [100%]
Updating / installing...
1:cloudera-cdh-5-0 ################################# [100%]
[ec2-user@ip-172-31-7-175 ~]$ sudo rpm --import http://archive.cloudera.com/cdh5/redhat/6/x86_64/cdh/RPM-GPG-KEY-cloudera
Next, I installed the pseudo-distributed configuration to run in a single-node Hadoop cluster:
[ec2-user@ip-172-31-7-175 ~]$ sudo yum install -y hadoop-0.20-conf-pseudo
This might take a while as it downloads all the Cloudera Hadoop distribution dependencies.
Since this configuration is for single-node use, we need to adjust the fs.defaultFS property in /etc/hadoop/conf/core-site.xml to advertise our private IP instead of localhost. If we don't do this, the namenode process will bind to 127.0.0.1, and other servers, such as our collector's Flume agent, will not be able to contact it:
<property>
<name>fs.defaultFS</name>
<value>hdfs://172.31.7.175:8020</value>
</property>
Next, we format the new HDFS volume and start the HDFS daemon (since that is all we need for this example):
[ec2-user@ip-172-31-7-175 ~]$ sudo -u hdfs hdfs namenode -format
[ec2-user@ip-172-31-7-175 ~]$ for x in 'cd /etc/init.d ; ls hadoop-hdfs-*' ; do sudo service $x start ; done
starting datanode, logging to /var/log/hadoop-hdfs/hadoop-hdfs-datanode-ip-172-31-7-175.out
Started Hadoop datanode (hadoop-hdfs-datanode): [ OK ]
starting namenode, logging to /var/log/hadoop-hdfs/hadoop-hdfs-namenode-ip-172-31-7-175.out
Started Hadoop namenode: [ OK ]
starting secondarynamenode, logging to /var/log/hadoop-hdfs/hadoop-hdfs-secondarynamenode-ip-172-31-7-175.out
Started Hadoop secondarynamenode: [ OK ]
[ec2-user@ip-172-31-7-175 ~]$ hadoop fs -df
Filesystem Size Used Available Use%
hdfs://172.31.7.175:8020 8318783488 24576 6661824512 0%
Now that HDFS is running, let's go back to the collector box configuration to create a second channel and an HDFS Sink by adding these lines:
collector.channels.h1.type=memory
collector.channels.h1.capacity=10000
collector.sinks.hadoop.type=hdfs
collector.sinks.hadoop.channel=h1
collector.sinks.hadoop.hdfs.path=hdfs://172.31.7.175/access_logs/%Y/%m/%d/%H
collector.sinks.hadoop.hdfs.filePrefix=access
collector.sinks.hadoop.hdfs.rollInterval=60
collector.sinks.hadoop.hdfs.rollSize=0
collector.sinks.hadoop.hdfs.rollCount=0
Then we modify the top-level channels and sinks keys:
collector.channels = m1 h1
collector.sinks = es hadoop
As you can see, I've gone with a simple memory channel again, but feel free to use a durable file channel if you need it. For the HDFS configuration, I'll be using a dated file path from the /access_logs root directory with a 60-second rotation regardless of size. We are not altering the source just yet, so don't worry.
If we attempt to start the collector now, we see this exception:
java.lang.NoClassDefFoundError: org/apache/hadoop/io/SequenceFile$CompressionType
Remember that for Apache Flume to speak to HDFS, we need compatible HDFS classes and dependencies for the version of Hadoop we are speaking to. Let's get some help from our friends at Cloudera and install the Hadoop client RPM (output removed to save paper):
[ec2-user@ip-172-31-26-205 ~]$ sudo rpm -ivh http://archive.cloudera.com/cdh5/one-click-install/redhat/6/x86_64/cloudera-cdh-5-0.x86_64.rpm
[ec2-user@ip-172-31-26-205 ~]$ sudo rpm --import http://archive.cloudera.com/cdh5/redhat/6/x86_64/cdh/RPM-GPG-KEY-cloudera
[ec2-user@ip-172-31-26-205 ~]$ sudo yum install hadoop-client
Test whether RPM works by creating the destination directory for our data. We'll also set permissions to match the account we'll be running the Flume agent under (ec2-user in this case):
[ec2-user@ip-172-31-26-205 ~]$ sudo -u hdfs hadoop fs -mkdir hdfs://172.31.7.175/access_logs
[ec2-user@ip-172-31-26-205 ~]$ sudo -u hdfs hadoop fs -chown ec2-user:ec2-user hdfs://172.31.7.175/access_logs
[ec2-user@ip-172-31-26-205 ~]$ hadoop fs -ls hdfs://172.31.7.175/
Found 1 items
drwxr-xr-x - ec2-user ec2-user 0 2014-12-11 04:35 hdfs://172.31.7.175/access_logs
Now, if we run the collector Flume agent, we see no exceptions due to missing HDFS classes. The Flume startup script detects that we have a local Hadoop installation, and appends its class path to its own.
Finally, we can go back to the Flume configuration file, and split the incoming data at the source by listing both channels on the source as destination channels:
collector.sources.av.channels=m1 h1
By default, a replicating channel selector is used. This is what we want, so that no further configuration is needed. Save the configuration file and restart the Flume agent.
When data is flowing, you should see the expected HDFS activity in the Flume collector agent's logs:
2014-12-11 05:05:04,141 (SinkRunner-PollingRunner-DefaultSinkProcessor) [INFO - org.apache.flume.sink.hdfs.BucketWriter.open(BucketWriter.java:261)] Creating hdfs://172.31.7.175/access_logs/2014/12/11/05/access.1418274302083.tmp
You should also see data appearing in HDFS:
[ec2-user@ip-172-31-7-175 ~]$ ls -R /access_logs
drwxr-xr-x - ec2-user ec2-user 0 2014-12-11 05:05 /access_logs/2014
drwxr-xr-x - ec2-user ec2-user 0 2014-12-11 05:05 /access_logs/2014/12
drwxr-xr-x - ec2-user ec2-user 0 2014-12-11 05:05 /access_logs/2014/12/11
drwxr-xr-x - ec2-user ec2-user 0 2014-12-11 05:06 /access_logs/2014/12/11/05
-rw-r--r-- 3 ec2-user ec2-user 10486 2014-12-11 05:05 /access_logs/2014/12/11/05/access.1418274302082
-rw-r--r-- 3 ec2-user ec2-user 10486 2014-12-11 05:05 /access_logs/2014/12/11/05/access.1418274302083
-rw-r--r-- 3 ec2-user ec2-user 6429 2014-12-11 05:06 /access_logs/2014/12/11/05/access.1418274302084
If you run this command from a server other than the Hadoop node, you'll need to specify the full HDFS URI (hdfs://172.31.7.175/access_logs) or set the default.FS property in the core-site.xml configuration file in Hadoop.
Note
In retrospect, I probably should have configured the default.FS property on any installed Hadoop client that will use HDFS to save myself a lot of typing. Live and learn!
Like the preceding Elasticsearch implementation, you can now use this example as a base end-to-end configuration for HDFS. The next step will be to go back and modify the format, compression, and so on, on the HDFS Sink to better match what you'll do with the data later.
Summary
In this chapter, we iteratively assembled an end-to-end data flow. We started by setting up an Nginx web server to create access logs. We also configured cron to execute a logrotate configuration periodically to safely rotate old logs to a spooling directory.
Next, we installed and configured a single-node Elasticsearch server and tested some insertions and deletions. Then we configured a Flume client to read input from our spooling directory filled with web logs, and relay them to a Flume collector using compressed Avro serialization. The collector then relayed the incoming data to our Elasticsearch server.
Once we saw data flowing from one end to another, we set up a single-node HDFS server and modified our collector configuration to split the input data feed and relay a copy of the message to HDFS, simulating archival storage. Finally, we set up a Kibana UI in front of our Elasticsearch instance to provide an easy-search function for nontechnical consumers.
In the next chapter, we will cover monitoring Flume data flows using Ganglia.