SQL Server Integration Services Design Patterns, Second Edition (2014)
Chapter 1. Metadata Collection
The first Integration Services design pattern we will cover is metadata collection. What do we mean by metadata collection? Good question. This chapter could also be called “Using SSIS to Save Time and Become an Awesome DBA.” Many DBAs spend a large portion of time monitoring activities such as verifying backups, alerting on scheduled job failures, creating schema snapshots (“just in case”), examining space utilization, and logging database growth over time, to name just a very few. Most Relational Database Management Systems (RDBMS’s) provide metadata to help DBAs monitor their systems. If you’ve been a DBA for a few years, you may even have a “tool bag” of scripts that you use to interrogate metadata. Running these scripts manually is easy when you have just one or two servers; however, this can quickly become unwieldy and consume a large portion of your time as your enterprise grows and as the number of database servers increases.
This chapter examines how to use Integration Services and the metadata that exists within SQL Server to automate some of these routine tasks.
About SQL Server Data Tools
SQL Server Data Tools - Business Intelligence (SSDT-BI) is Microsoft’s IDE for developing Integration Services packages. It leverages the maturity and familiarity of Visual Studio to provide a unified development platform for SQL Server Business Intelligence projects, including Integration Services, Analysis Services, and Reporting Services projects. This book is written using SSDT-BI for Visual Studio 2013 and SSIS 2014.
![]() Tip Don’t have SSDT-BI installed yet? SSDT-BI is available from Microsoft’s Download Center. Please note that SSDT-BI is not backward compatible, so make sure you verify that the version you download is appropriate for your environment.
Tip Don’t have SSDT-BI installed yet? SSDT-BI is available from Microsoft’s Download Center. Please note that SSDT-BI is not backward compatible, so make sure you verify that the version you download is appropriate for your environment.
A Peek at the Final Product
Let’s discuss the Integration Services package you will be creating in this chapter.
In SQL Server, you will do the following:
1. Create a database to act as your central repository for database monitoring.
2. Create a table to store a list of SQL Server instances that you wish to monitor.
3. Create a table for each of the data elements you wish to monitor (unused indexes and database growth).
In Integration Services, you will do the following:
1. Create a new Integration Services package.
2. Retrieve a list of SQL Server instances and store the list in a variable.
3. Create an OLE DB connection with a dynamically populated server name.
4. Iterate through each database and
a. Retrieve current database and log file sizes for historical monitoring.
b. Retrieve a list of index candidates for potential redesign or dropping.
c. Update the Last Monitored value for each SQL Server instance.
This is a very flexible model that you can easily expand to include many more monitoring tasks. A screenshot of the completed package is displayed in Figure 1-1.
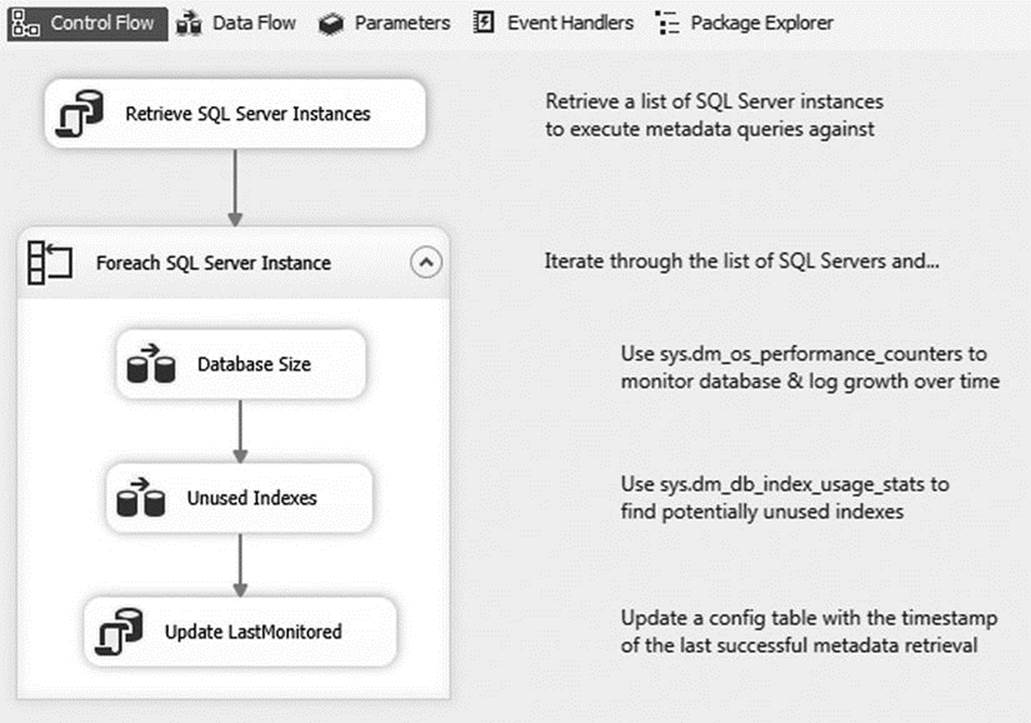
Figure 1-1. The MetadataCollection package
If this is not your first Integration Services package, maybe you’ve noticed that this package is missing a few best practices, such as error handling. In the interest of clarity, the package you create in this chapter will focus only on core design patterns; however, we will call out best practices when applicable.
Also, please note that the T-SQL examples will only work with SQL Server 2005 or later.
SQL Server Metadatacatalog
Although metadata can be collected from any RDBMS that provides an interface for accessing it, this chapter uses SQL Server as its metadata source. The focus of this chapter is not on the actual metadata, but rather the pattern of metadata collection. Still, it is useful for you to have a basic understanding of the type of metadata that is available.
SQL Server exposes a wealth of information through catalog views, system functions, dynamic management views (DMVs), and dynamic management functions (DMFs). Let’s briefly examine some of the metadata you will be using in this chapter.
![]() Tip SQL Server Books Online is a great resource for learning more about the types of metadata available in SQL Server. Try searching for “metadata functions,” “catalog views,” and “DMVs” for more information.
Tip SQL Server Books Online is a great resource for learning more about the types of metadata available in SQL Server. Try searching for “metadata functions,” “catalog views,” and “DMVs” for more information.
sys.dm_os_performance_counters
The sys.dm_os_performance_counters DMV returns server performance counters on areas including memory, wait stats, and transactions. This DMV is useful for reporting file sizes, page life expectancy, page reads and writes per second, and transactions per second, to name but a few.
sys.dm_db_index_usage_stats
The sys.dm_db_index_usage_stats DMV contains information on index utilization. Specifically, a counter is incremented every time a seek, scan, lookup, or update is performed on an index. These counters are reinitialized whenever the SQL Server service is started. If you do not see a row in this DMV for a particular index, it means that a seek, scan, lookup, or update has not yet been performed on that index since the last server reboot.
sys.dm_os_sys_info
The sys.dm_os_sys_info DMV contains information about server resources. Perhaps the most frequently used piece of information in this DMV is the sqlserver_start_time column, which tells you the last time the SQL Server service was started.
sys.tables
The sys.tables catalog view contains information about every table that exists within the database.
sys.indexes
The sys.indexes catalog view contains information about every index in the database. This includes information such as whether an index is clustered or nonclustered and whether the index is unique or nonunique.
sys.partitions
The sys.partitions catalog view gives visibility into the partitioning structure of an index. When an index has more than one partition, the data in the index is split into multiple physical structures that can be accessed using the single logical name. This technique is especially useful for dealing with large tables, such as a transaction history table. If a table is not partitioned, the table will still have a single row in sys.partitions.
sys.allocation_units
The sys.allocation_units catalog view contains information about the number of pages and rows that exist for an object. This information can be joined to the sys.partitions catalog view by joining the container_id to the partition_id.
Setting Up the Central Repository
Before you can begin development on your Integration Services package, you need to set up some prerequisites in SQL Server. First and foremost, you need to create a database that will act as your central data repository. This is where your list of SQL Server instances will reside and where you will store the metadata you retrieve for each SQL Server instance. Many enterprises also find it convenient to store all error and package logging to this same central database. This is especially beneficial in environments where there are numerous DBAs, developers, and servers, because it makes it easy for everyone to know where to look for information. The T-SQL code in Listing 1-1 creates the database you will use throughout the rest of this chapter.
Listing 1-1. Example of T-SQL Code to Create a SQL Server Database
USE [master];
GO
CREATE DATABASE [dbaCentralLogging]
ON PRIMARY
(
NAME = N'dbaCentralLogging'
, FILENAME = N'C:\Program Files\Microsoft SQL Server\MSSQL12.MSSQLSERVER\MSSQL\DATA\dbaCentralLogging.mdf'
, SIZE = 1024MB
, MAXSIZE = UNLIMITED
, FILEGROWTH = 1024MB
)
LOG ON
(
NAME = N'dbaCentralLogging_log'
, FILENAME = N'C:\Program Files\Microsoft SQL Server\MSSQL12.MSSQLSERVER\MSSQL\DATA\dbaCentralLogging_log.ldf'
, SIZE = 256MB
, MAXSIZE = UNLIMITED
, FILEGROWTH = 256MB
);
GO
Please note that your file directory may differ from the one in the preceding example.
This code can be executed from SQL Server Management Studio (SSMS), as demonstrated in Figure 1-2, or from your favorite query tool.
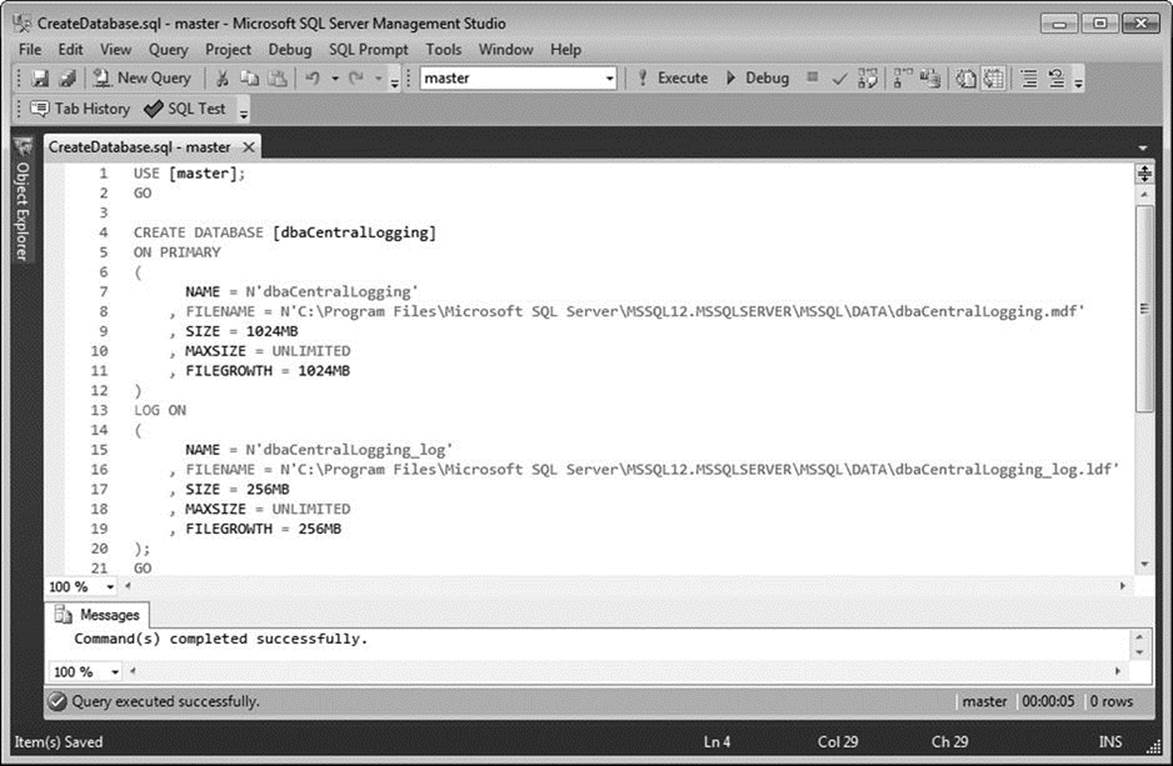
Figure 1-2. SQL Server Management Studio 2012
Next, you need a list of SQL Server instances to monitor. The easiest way to accomplish this is to store a list of database instance names in a file or table. You will use the latter method. Using the code in Listing 1-2, create that table now inside your newly created database.
Listing 1-2. Example of T-SQL Code to Create a Table for Monitoring SQL Server Instances
USE dbaCentralLogging;
GO
CREATE TABLE dbo.dba_monitor_SQLServerInstances
(
SQLServerInstance NVARCHAR(128)
, LastMonitored SMALLDATETIME NULL
CONSTRAINT PK_dba_monitor_SQLServerInstances
PRIMARY KEY CLUSTERED( SQLServerInstance )
);
Now you’re ready to populate the table with a list of SQL Server instances to monitor. The code in Listing 1-3 will walk you through how to do this, although you will need to update the placeholders with SQL Server instances that exist in your environment.
Listing 1-3. Example of T-SQL Code to Insert Data into the dba_monitor_SQLServerInstances Table
INSERT INTO dbo.dba_monitor_SQLServerInstances
(
SQLServerInstance
)
SELECT @@SERVERNAME-- The name of the server that hosts the central repository
UNION ALL
SELECT 'YourSQLServerInstanceHere'-- Example of a SQL Server instance
UNION ALL
SELECT 'YourSQLServerInstance\Here';-- Example of a server with multiple instances
You still need to create two tables to store the metadata you collect, but you will create these as you get to the relevant section in this chapter. Next, you will create your Integration Services package.
The Iterative Framework
In this section, you lay the foundation for your iterative framework. Specifically, you will demonstrate a repeatable pattern for populating a variable with a list of SQL Server instances and then iterating through the list and performing an action on each server.
First, open Visual Studio. Create a new project by navigating to File ![]() New
New ![]() Project. Expand the Business Intelligence section (under Installed
Project. Expand the Business Intelligence section (under Installed ![]() Templates), and then click Integration Services Project. Name the project MetadataCollection, as illustrated in Figure 1-3.
Templates), and then click Integration Services Project. Name the project MetadataCollection, as illustrated in Figure 1-3.
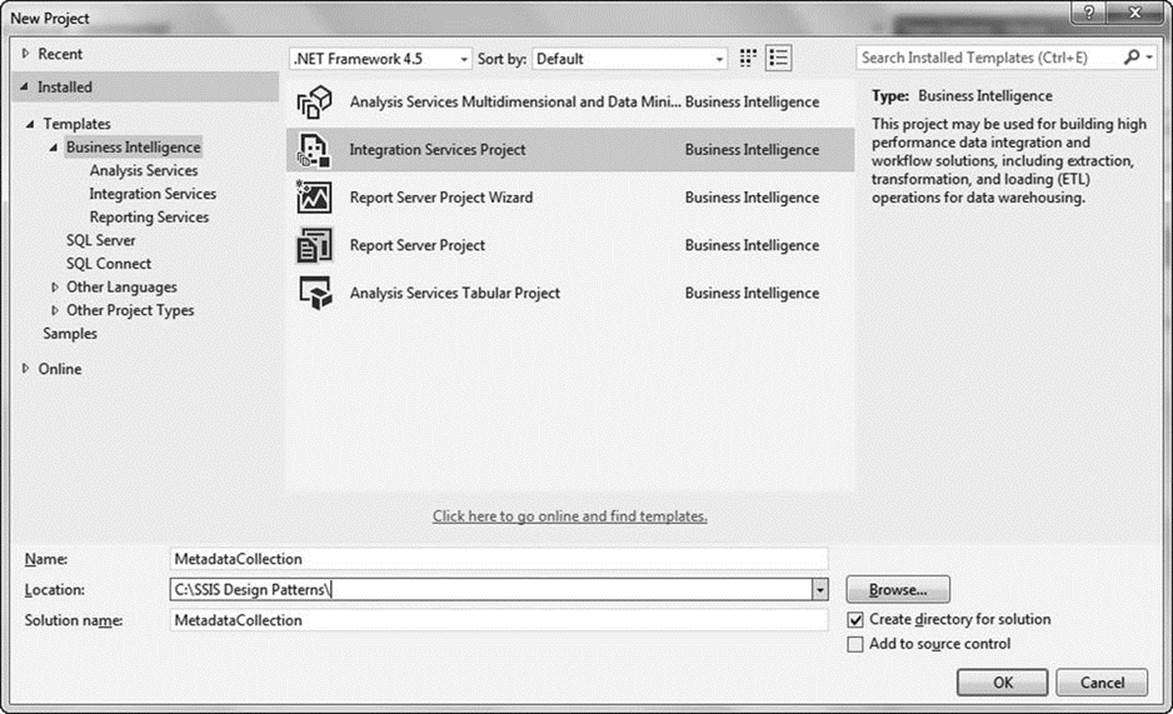
Figure 1-3. New integration services project
Please note that your default Location will be different from the directory pictured in Figure 1-3.
You now need to create two variables. The first variable will be used to store the list of SQL Server instances you retrieve. The second variable will store the value of a single instance as you iterate through your list.
To access the variable menu, select Variables under the SSIS menu (Figure 1-4); you can also access the Variables menu by right-clicking the designer surface.
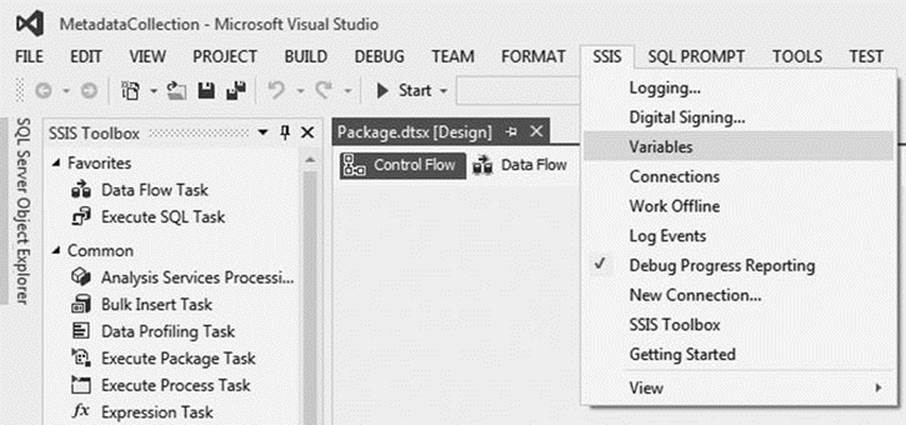
Figure 1-4. Opening the Variables menu
Add the following variables by clicking the Add Variable icon on the far left of the Variables menu, as illustrated in Figure 1-5:
· SQLServerInstance—String data type
· SQLServerList—Object data type
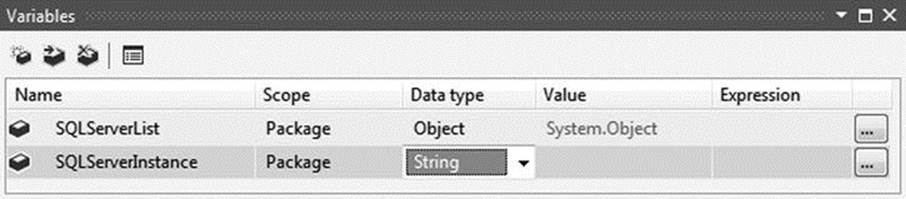
Figure 1-5. Package-scoped variables
Initialize the SQLServerInstance variable with a server that you have permissions to connect to. For simplicity, we suggest using the server where the dbaCentralLogging database was created. This value will be overwritten at runtime.
Now that you have a place to store your list of instances, you’re ready to populate the variable. Drag a new Execute SQL task from the SSIS Toolbox onto the designer surface. Rename the task Retrieve SQL Server Instances and double-click it to open the Execute SQL Task Editor. Click the drop-down under Connection, and then select <New connection…>, as seen in Figure 1-6.
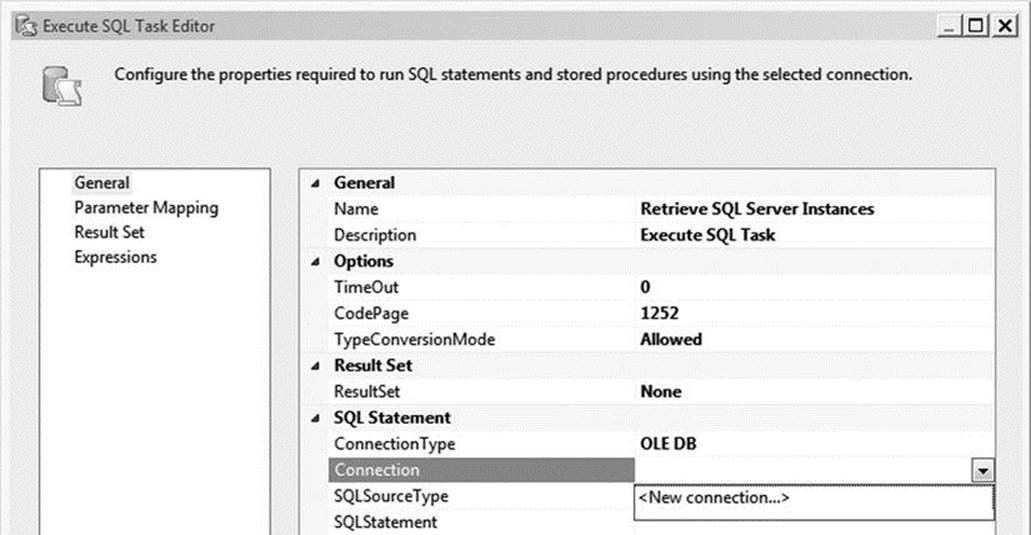
Figure 1-6. The Execute SQL Task Editor
In the Configure OLE DB Connection Manager menu, click New. In the Server Name field, enter the database server where you created the database in Listing 1-1. Regardless of whether you are using Windows or SQL Server authentication, make sure that the account has sufficient permissions to each of the instances in your dba_monitor_SQLServerInstances table. Under Select or Enter a Database Name, select dbaCentralLogging from the drop-down menu, as illustrated in Figure 1-7. Click OK to return to the Execute SQL Task Editor.
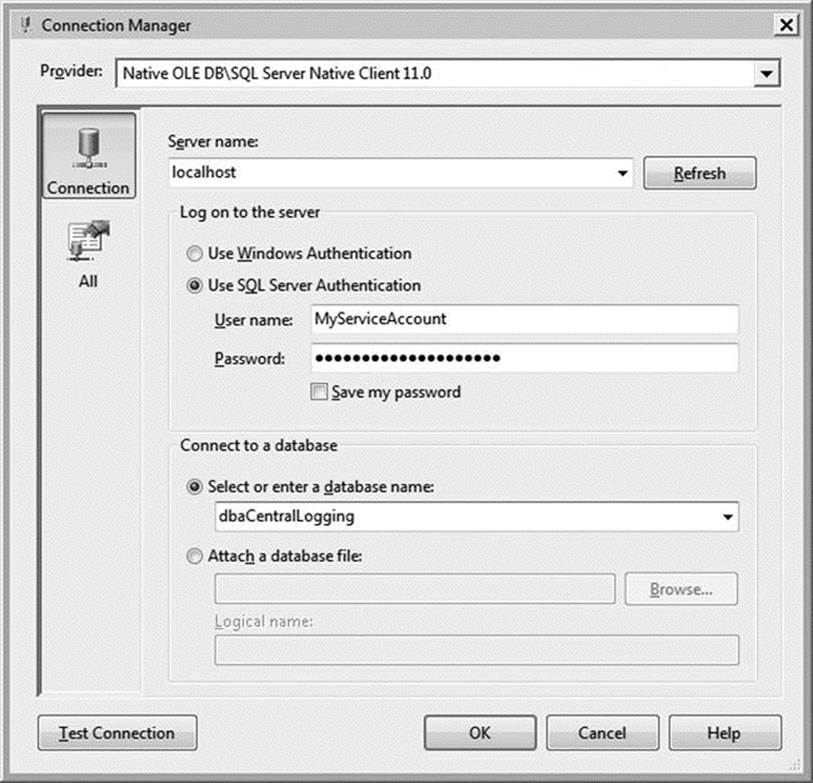
Figure 1-7. The Connection Manager
![]() Note Permissions requirements vary depending on the type of metadata you wish to retrieve. For more information on the permissions necessary to access a specific object, please refer to the object type’s page within SQL Server Books Online.
Note Permissions requirements vary depending on the type of metadata you wish to retrieve. For more information on the permissions necessary to access a specific object, please refer to the object type’s page within SQL Server Books Online.
You now need to write the SQL statement that will retrieve the list of SQL Server instances. Click the […] icon to the right of the SQLStatement field, and then enter the T-SQL code from Listing 1-4.
Listing 1-4. T-SQL Statement to Retrieve SQL Server Instances
SELECT SQLServerInstance FROM dbo.dba_monitor_SQLServerInstances;
Because you are retrieving an array of values, select Full Result Set from the ResultSet drop-down. Your Execute SQL Task Editor should now resemble Figure 1-8; however, your Connection values will likely be different.
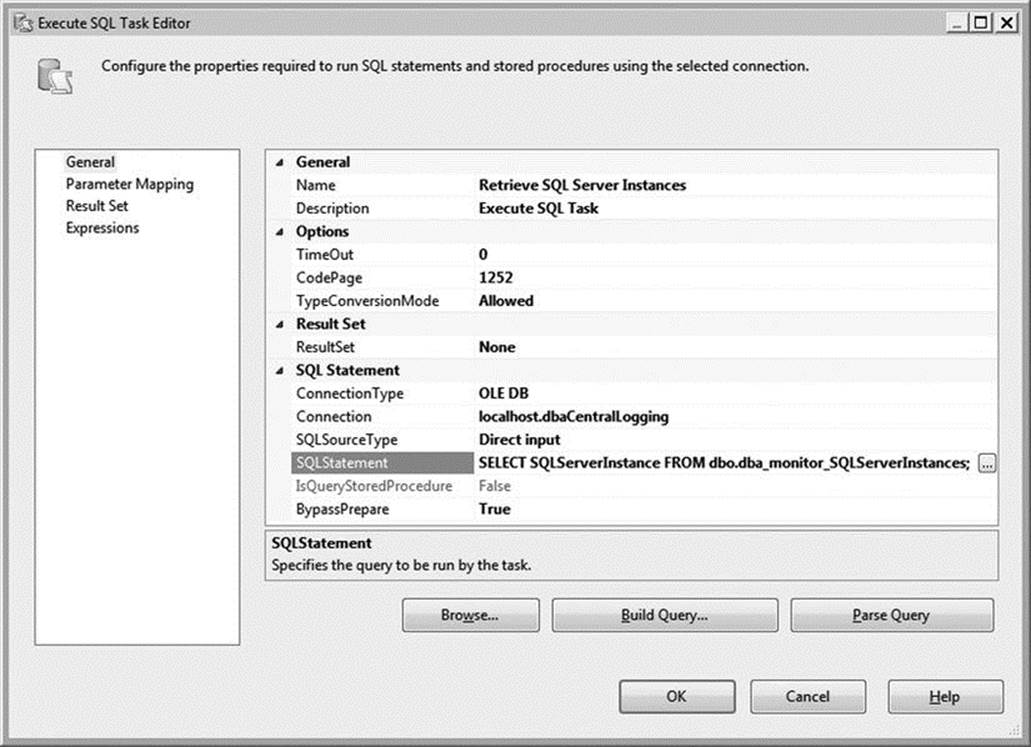
Figure 1-8. The SQL Task Editor
You’re almost done configuring the Connection Manager. All you have left is to map your result set to your variable. Select Result Set on the left side of the Execute SQL Task Editor, and then click Add. Because you are using a full result set, you must replace the Result Name with 0. You now need to tell Integration Services which variable to use. Select User::SQLServerList from the drop-down under Variable Name, as illustrated in Figure 1-9. Click OK.
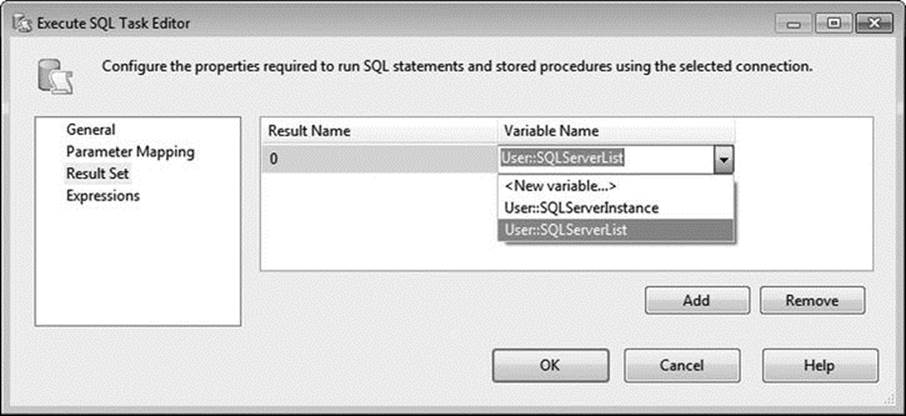
Figure 1-9. Editing the result set
The Execute SQL task is now complete. Next, you need to iterate through each server to retrieve the metadata you plan to monitor. This process will be encapsulated within a Foreach Loop container, which will shred the list of SQL Server instances stored in the SQLServerListvariable.
Add a Foreach Loop container to the Control Flow and rename it Foreach SQL Server Instance. Connect it to the Execute SQL task with a Success Precedence constraint—in other words, drag the green arrow from the Execute SQL task to the Foreach Loop container, as seen in Figure 1-10.
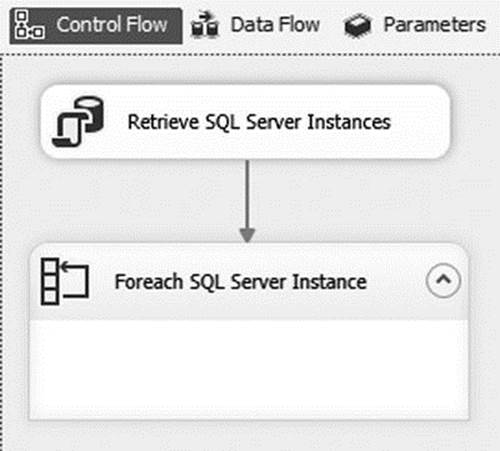
Figure 1-10. Connecting the Execute SQL task to the Foreach Loop container
Double-click the Foreach Loop container to edit its properties. Click the Collection page, and then select Foreach ADO Enumerator in the Enumerator field. Under ADO Object Source Variable, select User::SQLServerList; leave Enumeration Mode set to Rows in the First Table. Your Collection properties should match those in Figure 1-11.
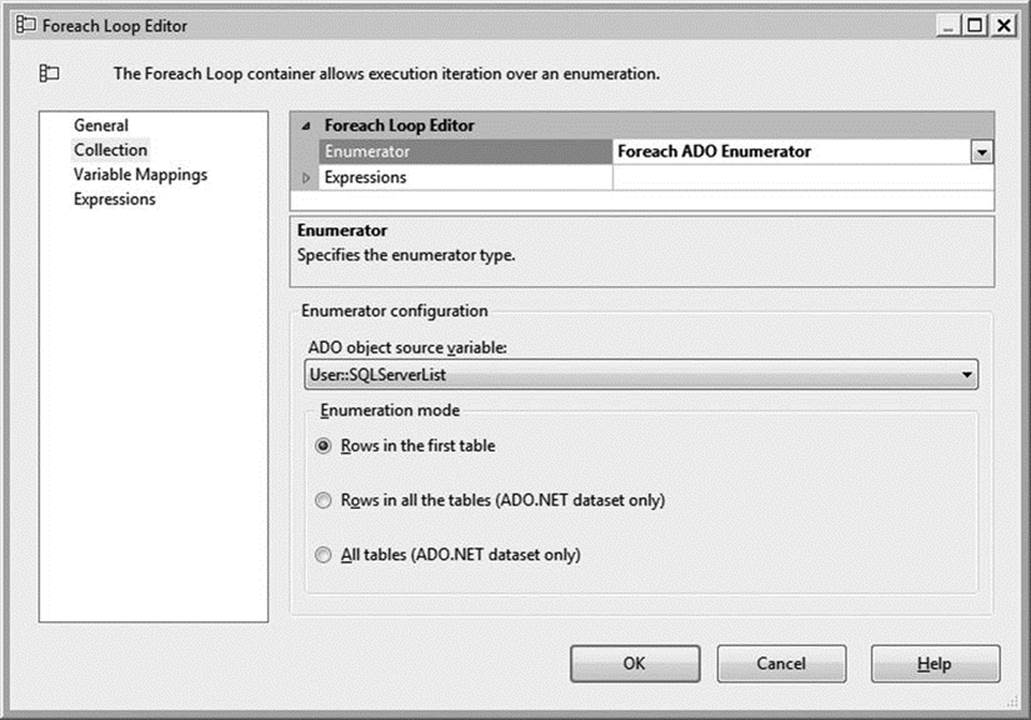
Figure 1-11. The Foreach Loop Editor
On the Variable Mappings page, map the SQLServerInstance variable to Index 0, as demonstrated in Figure 1-12.
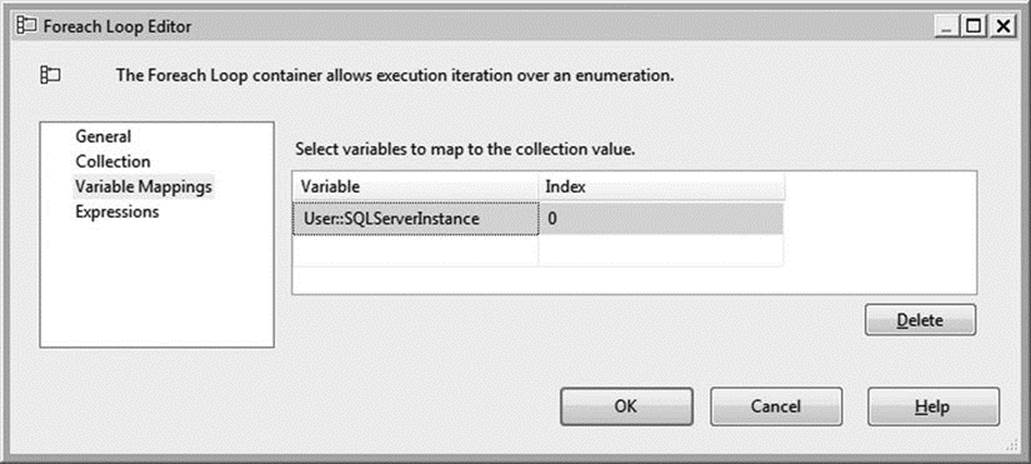
Figure 1-12. Variable mappings
Click the OK button to close the Foreach Loop Editor.
Let’s review what you’ve done so far. You now have a variable, SQLServerList, which contains a list of all the SQL Server instances you inserted into the dba_monitor_SQLServerInstances table. The Foreach Loop container then shreds this variable, walking through each value—each SQL Server instance, in this case—one at a time. At each pass, it pushes the value of one of those SQL Server instances into another variable, SQLServerInstance.
Now it’s time to set up the dynamic connection that will be used to connect to each of the SQL Server instances you’re monitoring. To do this, you need to create a dummy connection and configure it to use the server name stored in SQLServerInstance.
Right-click in the Connection Managers window and select New OLE DB Connection. Create a new connection using the same server and security credentials you used previously (Figure 1-7), but select Master as the database this time. To be clear, you’re using the same server purely for convenience. In reality, the server specified in the dummy connection is irrelevant as long as you have sufficient permissions to log onto it, because whatever value you enter will be overwritten by the SQLServerInstance variable at runtime. The database value does matter, however, because the database you select must exist on every server. Since Master is a system database, it is a natural choice.
Click OK to close the Connection Manager Properties window. But you’re not done with this connection just yet. Right-click the newly created connection and select Properties. Change the Name property to DynamicSQLServerInstance, then click the […] icon in the Expressions field. This will bring up the Property Expressions Editor. Select the Property value you wish to dynamically populate—ServerName, in this case—and enter @[User::SQLServerInstance] in the Expression field, as demonstrated in Figure 1-13. Optionally, you can also click the […] icon in the Expression field to open the Expression Builder, which is helpful if you are not very familiar with Expression syntax.
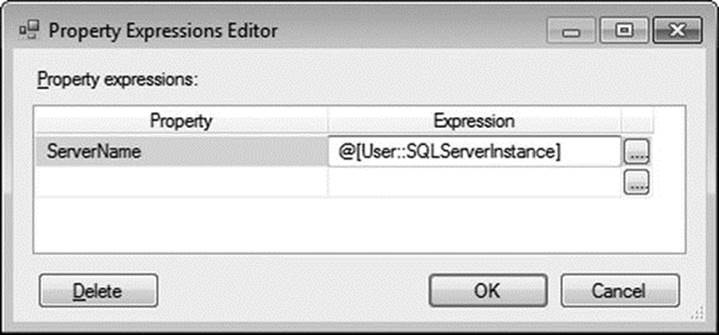
Figure 1-13. Property Expressions Editor
The properties of your connection should now resemble those shown in Figure 1-14.
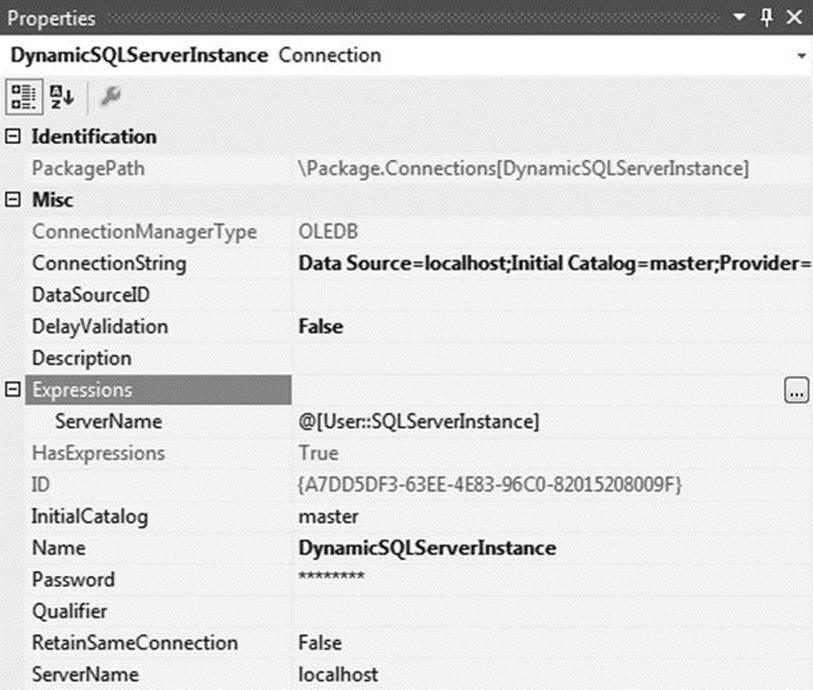
Figure 1-14. Dynamic connection properties
At this point, you now have a reusable framework for iterating through a list of SQL Server instances and doing something on each server. This in and of itself is a very valuable design pattern. However, because this is a chapter on metadata collection, we would be remiss if we did not actually demonstrate collecting and storing metadata. The next section will walk you through setting up two useful metadata extracts.
Metadata Collection
You’re now ready to retrieve metadata from your list of servers. But what should you collect? An incredible wealth of information is available for retrieval, including security information, usage data, table schema snapshots, failed job details, fragmentation levels, and performance counters, to name just a few. For this first example, let’s keep it simple and retrieve current database and log file size. This information is useful for historical database growth and capacity planning.
To accomplish this, you will create data flows within your Foreach Loop container to retrieve the metadata from each server and store it in the dbaCentralLogging database. The Data Flow task is arguably the most frequently used task in Integration Services. It allows you to easily move data between servers and, if necessary, perform data conversions or cleansing.
Drag a Data Flow task from the SSIS Toolbox into the Foreach Loop container and rename it Database Size. Double-clicking the Data Flow task will open the Data Flow Designer tab. Notice that the objects available within the toolbox change once you are inside the Data Flow designer. Drag the OLE DB Source icon onto the designer surface and rename it Dynamic SQL Source. Double-click the icon to edit its properties.
Select DynamicSQLServerInstance in the OLE DB Connection Manager drop-down. Change the Data Access Mode to SQL Command, and then copy the code from Listing 1-5 into the SQL Command text box.
Listing 1-5. Example of T-SQL to Retrieve Current Data and Log File Sizes for All Databases on the Server
SELECT GETDATE() AS [captureDate]
, @@SERVERNAME AS [serverName]
, instance_name AS [databaseName]
, SUM(
CASE
WHEN counter_name = 'Data File(s) Size (KB)'
THEN cntr_value
END
) AS 'dataSizeInKB'
, SUM(
CASE
WHEN counter_name = 'Log File(s) Size (KB)'
THEN cntr_value
END
) AS 'logSizeInKB'
FROM sys.dm_os_performance_counters
WHERE counter_name IN ('Data File(s) Size (KB)'
,'Log File(s) Size (KB)')
/* optional: remove _Total to avoid accidentally
double-counting in queries */
AND instance_name <> '_Total'
GROUP BY instance_name;
This query will produce results similar to the following.
captureDate serverName databaseName dataSizeInKB logSizeInKB
----------------------- ---------- -------------------------- ------------ -----------
2014-06-29 19:52:21.543 LOCALHOST _Total 1320896 274288
2014-06-29 19:52:21.543 LOCALHOST AdventureWorks2012 193536 496
2014-06-29 19:52:21.543 LOCALHOST dbaCentralLogging 1048576 262136
2014-06-29 19:52:21.543 LOCALHOST master 4096 760
2014-06-29 19:52:21.543 LOCALHOST model 2112 760
2014-06-29 19:52:21.543 LOCALHOST msdb 14080 760
2014-06-29 19:52:21.543 LOCALHOST mssqlsystemresource 40960 504
2014-06-29 19:52:21.543 LOCALHOST ReportServer$SQL2012 5184 7032
2014-06-29 19:52:21.543 LOCALHOST ReportServer$SQL2012TempDB 4160 1080
2014-06-29 19:52:21.543 LOCALHOST tempdb 8192 760
(10 row(s) affected)
Your OLE DB Source Editor should now resemble the editor in Figure 1-15. Click Parse Query to ensure the SQL syntax is correct, and then click Preview at the bottom of the editor to see a sample of the results. Click OK to exit the OLE DB Source Editor.
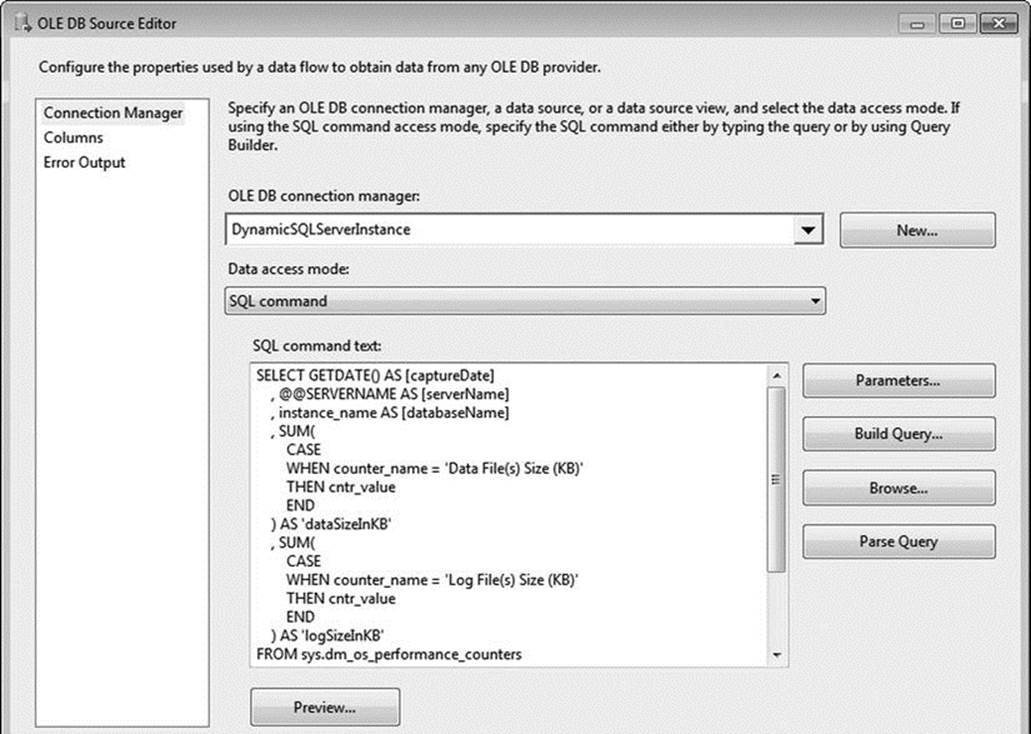
Figure 1-15. OLE DB Source Editor
Let’s take a moment to discuss this code. You are using the sys.dm_os_performance_counters DMV to retrieve data file and log file sizes. This DMV stores data and log sizes in a separate row for each database, so you are pivoting the data to return one row for each database, with the file size and log size in separate columns. As a reminder, DMVs were introduced in SQL Server 2005, so this example will only work in SQL Server 2005 and newer editions.
It is generally a best practice to create stored procedures for these types of administrative queries and to deploy them to each server, typically into a database like dbaToolBox. This introduces some maintenance overhead, but benefits of stored procedures—such as improved security and visibility into dependencies, usage, performance tuning, and troubleshooting—typically outweigh the overhead. Also, it allows a DBA or developer to manually execute these same queries on each server without having to search for the code within an Integration Services package. However, in the interests of simplicity, you will just input the code directly into your Data Flow task.
![]() Tip The sys.dm_os_performance_counters DMV is very useful for database monitoring and contains much more information than just data and log file sizes. You can easily modify the preceding code to include additional performance counters. However, you should be aware that there are three types of cntr_type values (value/base, per second, and point-in-time), and the preceding code only works for the point-in-time counter type (cntr_type = 65792). Refer to SQL Server Books Online for more information on the types of information available in this DMV and how to work with each counter type.
Tip The sys.dm_os_performance_counters DMV is very useful for database monitoring and contains much more information than just data and log file sizes. You can easily modify the preceding code to include additional performance counters. However, you should be aware that there are three types of cntr_type values (value/base, per second, and point-in-time), and the preceding code only works for the point-in-time counter type (cntr_type = 65792). Refer to SQL Server Books Online for more information on the types of information available in this DMV and how to work with each counter type.
Now that you understand the expected output of the query, you need a table to store the results. From within SSMS, execute the T-SQL statement in Listing 1-6 within the dbaCentralLogging database.
Listing 1-6. Example of T-SQL Code to Create a Table to Store Data and Log File Size Information
USE dbaCentralLogging;
GO
CREATE TABLE dbo.dba_monitor_databaseGrowth
(
log_id INT IDENTITY(1,1)
, captureDate DATETIME
, serverName NVARCHAR(128)
, databaseName SYSNAME
, dataSizeInKB BIGINT
, logSizeInKB BIGINT
CONSTRAINT PK_dba_monitor_databaseGrowth
PRIMARY KEY NONCLUSTERED(log_id)
);
CREATE CLUSTERED INDEX CIX_dba_monitor_databaseGrowth
ON dbo.dba_monitor_databaseGrowth(captureDate,serverName,databaseName);
You can now return to your Integration Services package. You do not need to perform any data cleansing or data transformations in this Data Flow task, so you’ll proceed straight to storing your results. Select the OLE DB Destination item from the toolbox, drag it onto the designer surface, and rename it Central Logging Destination. Connect it to the OLE DB Source by dragging the blue data flow arrow from the source to the destination. Double-clicking the OLE DB destination brings up another editor. This time, select your dbaCentralLogging connection from the OLE DB Connection Manager drop-down. Leave Table or View – Fast Load selected in the Data Access Mode drop-down. In the Name of the Table or the Vew drop-down, select [dbo].[dba_monitor_databaseGrowth], as seen in Figure 1-16.
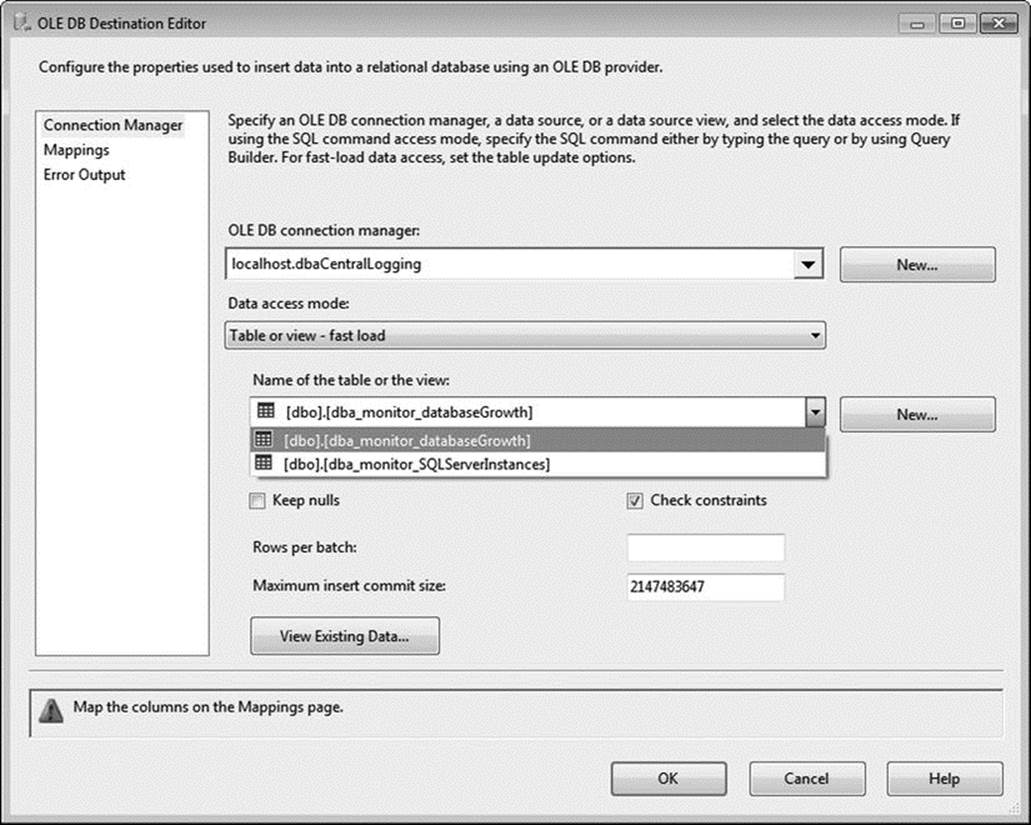
Figure 1-16. Editing the OLE DB Destination Editor’s connection manager
When you’re done with the Connection Manager page, click the Mappings menu. You’ll notice that Integration Services has taken the liberty of performming an initial mapping based on column names. Although this is a nice time-saving feature, be wary in environments where the same column name is used for multiple data elements. Because the log_id column is an identity value that is populated during data insertion, you will ignore it in your mappings. Confirm that your mappings resemble those shown in Figure 1-17, and then click OK to return to the Data Flow designer.
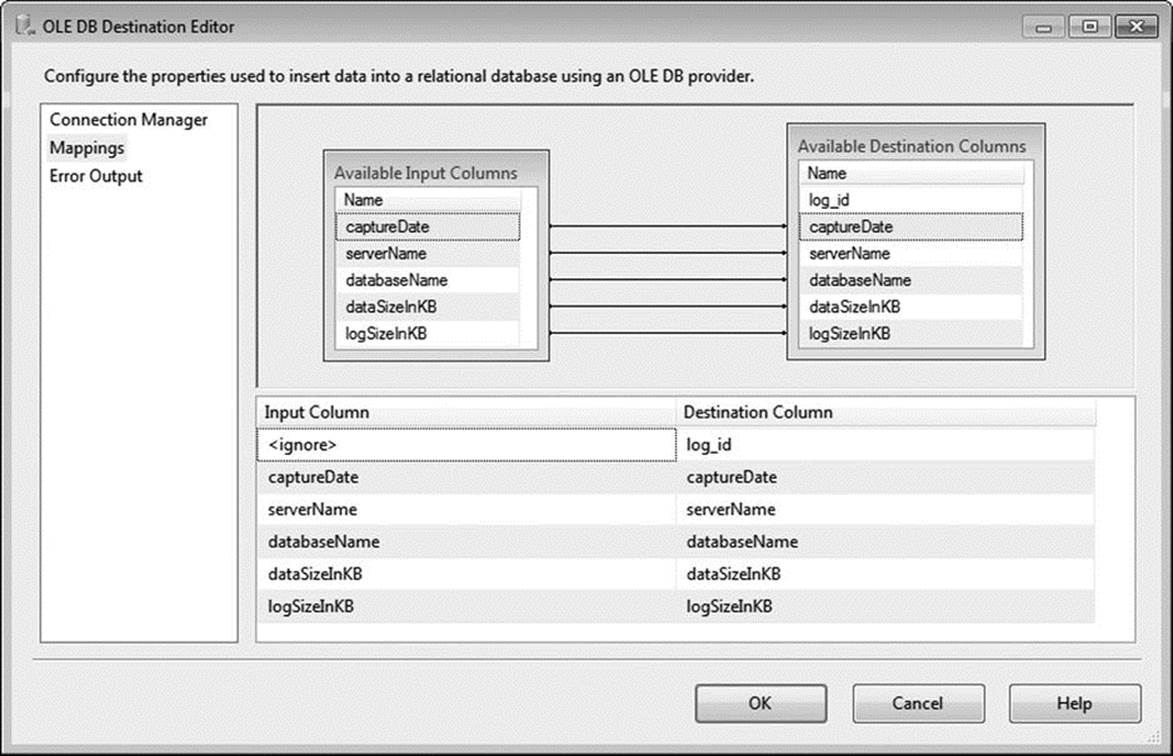
Figure 1-17. Editing the OLE DB destination mappings
Your first data flow is complete, as seen in Figure 1-18.
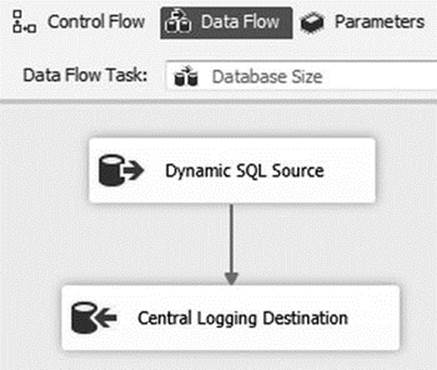
Figure 1-18. The completed Data Flow task
You are now ready to create your second data flow. From the Control Flow tab, copy and paste the existing data flow into the Foreach Loop container. Drag the green arrow—the Success Precedence constraint—from the Database Size data flow to your new data flow. Rename the new data flow Unused Indexes, and then double-click it to return to the Data Flow designer.
Double-click the Dynamic SQL Source icon to edit its properties. You need to change the SQL command to use the code in Listing 1-7.
Listing 1-7. Example of T-SQL Query to Retrieve Unused Indexes
/* Create a variable to hold a list of indexes */
DECLARE @Indexes TABLE
(
serverName NVARCHAR(128)
,schemaName SYSNAME
,schemaID INT
,databaseName SYSNAME
,databaseID INT
,tableName SYSNAME
,objectID INT
,indexName SYSNAME
,indexID INT
,indexType NVARCHAR(60)
,isPrimaryKey BIT
,isUnique BIT
,isFiltered BIT
,isPartitioned BIT
,numberOfRows BIGINT
,totalPages BIGINT
);
/* Iterate through all databases */
INSERT INTO @Indexes (serverName,schemaName,schemaID,databaseName,databaseID,tableName,objectID,indexName,indexID,indexType,isUnique,isPrimaryKey,isFiltered,isPartitioned,numberOfRows,totalPages)
EXECUTE sys.sp_MSforeachdb
' USE ?;
SELECT @@SERVERNAME
, SCHEMA_NAME(t.schema_id)
, t.schema_id
, DB_NAME()
, DB_ID()
, t.name
, t.object_id
, i.name
, i.index_id
, i.type_desc
, i.is_primary_key
, i.is_unique
, i.has_filter
, CASE WHEN COUNT(p.partition_id) > 1 THEN 1 ELSE 0 END
, SUM(p.rows)
, SUM(au.total_pages)
FROM sys.tables AS t WITH (NOLOCK)
JOIN sys.indexes AS i WITH (NOLOCK)
ON i.object_id = t.object_id
JOIN sys.partitions AS p WITH (NOLOCK)
ON p.object_id = i.object_id
AND p.index_id = i.index_id
JOIN sys.allocation_units AS au WITH (NOLOCK)
ON au.container_id = p.partition_id
WHERE i.index_id <> 0 /* exclude heaps */
GROUP BY SCHEMA_NAME(t.schema_id)
, t.schema_id
, t.name
, t.object_id
, i.name
, i.index_id
, i.type_desc
, i.has_filter
, i.is_unique
, i.is_primary_key;';
/* Retrieve index stats for return to our central repository */
SELECT GETDATE() AS [captureDate]
,i.serverName
,i.schemaName
,i.databaseName
,i.tableName
,i.indexName
,i.indexType
,i.isFiltered
,i.isPartitioned
,i.numberOfRows
,ddius.user_seeks AS [userSeeksSinceReboot]
,ddius.user_scans AS [userScansSinceReboot]
,ddius.user_lookups AS [userLookupsSinceReboot]
,ddius.user_updates AS [userUpdatesSinceReboot]
,(i.totalPages * 8)/ 1024 AS [indexSizeInMB]/* pages are 8KB */
,dosi.sqlserver_start_time AS [lastReboot]
FROM @Indexes AS i
JOIN sys.dm_db_index_usage_stats AS ddius
ON i.databaseID = ddius.database_id
AND i.objectID = ddius.object_id
AND i.indexID = ddius.index_id
CROSS APPLY sys.dm_os_sys_info AS dosi
WHERE /* exclude system databases */
i.databaseName NOT IN('master','msdb','tempdb','model')
/* exclude unique indexes; assume they are serving a business function */
AND i.isUnique = 0
/* exclude primary keys; assume they are serving a business function */
AND i.isPrimaryKey = 0
/* no seeks have been performed since the last server reboot */
AND ddius.user_seeks = 0;
.
![]() Tip The T-SQL in Listing 1-7 is just a starting point. You can easily modify this query to return information such as which clustered indexes may warrant redesign, which tables have the most updates, and which tables are the most frequently queried.
Tip The T-SQL in Listing 1-7 is just a starting point. You can easily modify this query to return information such as which clustered indexes may warrant redesign, which tables have the most updates, and which tables are the most frequently queried.
An example of the output follows.
captureDate serverName schemaName databaseName tableName
----------------------- ---------- ---------- ------------------ ------------------
2014-06-29 19:37:36.927 LOCALHOST Production AdventureWorks2012 TransactionHistory
2014-06-29 19:37:36.927 LOCALHOST Production AdventureWorks2012 TransactionHistory
2014-06-29 19:37:36.927 LOCALHOST Sales AdventureWorks2012 SalesOrderDetail
indexName indexType isFiltered isPartitioned numberOfRows
-------------------------------------- ------------ ---------- ------------- ------------ IX_TransactionHistory_ProductID NONCLUSTERED 0 0 1134431
IX_TransactionHistory_ReferenceOrderID NONCLUSTERED 0 0 1134431
IX_SalesOrderDetail_ProductID NONCLUSTERED 0 1 1213178
userSeeksSinceReboot userScansSinceReboot userLookupsSinceReboot userUpdatesSinceReboot
-------------------- -------------------- ---------------------- ----------------------
0 0 0 98
0 8 0 98
0 2 0 124
indexSizeInMB lastReboot
------------- -----------------------
9 2014-06-28 19:15:28.837
21 2014-06-28 19:15:28.837
28 2014-06-28 19:15:28.837
As you can see, this query is a bit more complex than the last one. Let’s discuss what you’re doing. Developers are usually very good at identifying performance issues. Why? When a query is slow, someone is usually complaining about it! It’s not uncommon for the fix to involve creating an index, which can reduce IO and improve query duration. Over time, however, the query may change—resulting in the optimizer using different indexing—or perhaps the query is no longer needed. Unlike the user-impacting issues that garner so much attention, these types of changes tend to creep up silently over time. Eventually that same index that was so beneficial when it was first being used starts consuming unnecessary resources—specifically, it slows down insert speed, consumes precious disk space, and inflates backup sizes.
One way to stay on top of unused indexes is to search the sys.dm_db_index_usage_stats DMV. This DMV keeps track of index utilization statistics, including how many times an index has been seeked or scanned and how many updates have been performed. This information is refreshed after every reboot, so please note that a server that has been restarted recently may show an inaccurately high number of “unused” indexes. Also, this information is merely a starting point from which you can conduct further research into whether an index should be dropped or redesigned; many organizations may have indexes that are not called frequently but are necessary for important monthly or annual reports.
One other important thing to note is that this script makes use of the undocumented sp_MSforeachdb stored procedure. This stored procedure performs a very useful task: it iterates through every database, executing whatever command is passed to it. For numerous reasons—not the least of which is the fact that it is an undocumented, and therefore unsupported, stored procedure that may occasionally skip databases—we recommend using Aaron Bertrand’s sp_foreachdb stored procedure instead for production workloads. However, to keep things simple, you will use the sp_MSforeachdb procedure in your example.
![]() Tip Aaron Bertrand’s sp_foreachdb stored procedure can be found at www.mssqltips.com/sqlservertip/2201/making-a-more-reliable-and-flexible-spmsforeachdb.
Tip Aaron Bertrand’s sp_foreachdb stored procedure can be found at www.mssqltips.com/sqlservertip/2201/making-a-more-reliable-and-flexible-spmsforeachdb.
Now that you better understand the query and the expected output, let’s return to your package. Click Parse Query to ensure you do not have any errors in your syntax, and then click Preview to see a sample of the results. Click the Columns page to ensure that the column list has been successfully updated; then click OK to return to the Data Flow designer.
You should now see an error in your data flow, as illustrated in Figure 1-19. This is expected because you’ve changed the columns that your data source is providing, but your destination still expects the old column list.
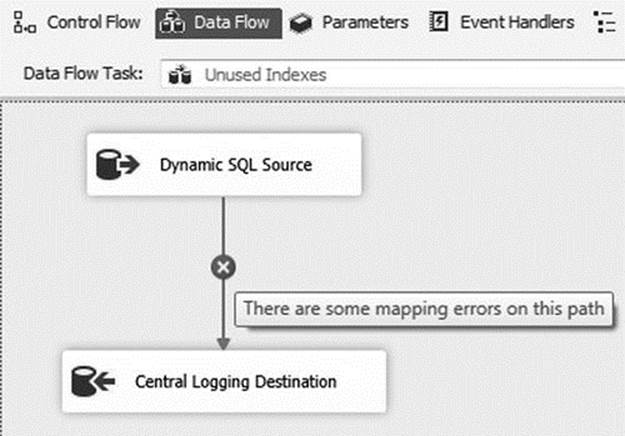
Figure 1-19. The completed data flow task
Before you can fix this error, you need to return to SSMS to create a table to store this data. Create this table now using the code in Listing 1-8.
Listing 1-8. T-SQL Code to Create the dba_monitor_unusedIndexes Table
USE dbaCentralLogging;
GO
CREATE TABLE dbo.dba_monitor_unusedIndexes
(
log_id INT IDENTITY(1,1)
,captureDate DATETIME
,serverName NVARCHAR(128)
,schemaName SYSNAME
,databaseName SYSNAME
,tableName SYSNAME
,indexName SYSNAME
,indexType NVARCHAR(60)
,isFiltered BIT
,isPartitioned BIT
,numberOfRows BIGINT
,userSeeksSinceReboot BIGINT
,userScansSinceReboot BIGINT
,userLookupsSinceReboot BIGINT
,userUpdatesSinceReboot BIGINT
,indexSizeInMB BIGINT
,lastReboot DATETIME
CONSTRAINT PK_dba_monitor_unusedIndexes
PRIMARY KEY NONCLUSTERED(log_id)
);
CREATE CLUSTERED INDEX CIX_dba_monitor_unusedIndexes
ON dbo.dba_monitor_unusedIndexes(captureDate);
Return to Visual Studio and double-click the Central Logging Database icon to edit its properties. Change the Name of the Table or the View value to [dbo].[dba_monitor_unusedIndexes], and then click the Mappings page. Because your source and destination are using the same column names, you can easily update the mappings by right-clicking in the space between Available Input Columns and Available Destination Columns and selecting Map Items by Matching Names. Figure 1-20 illustrates this option.
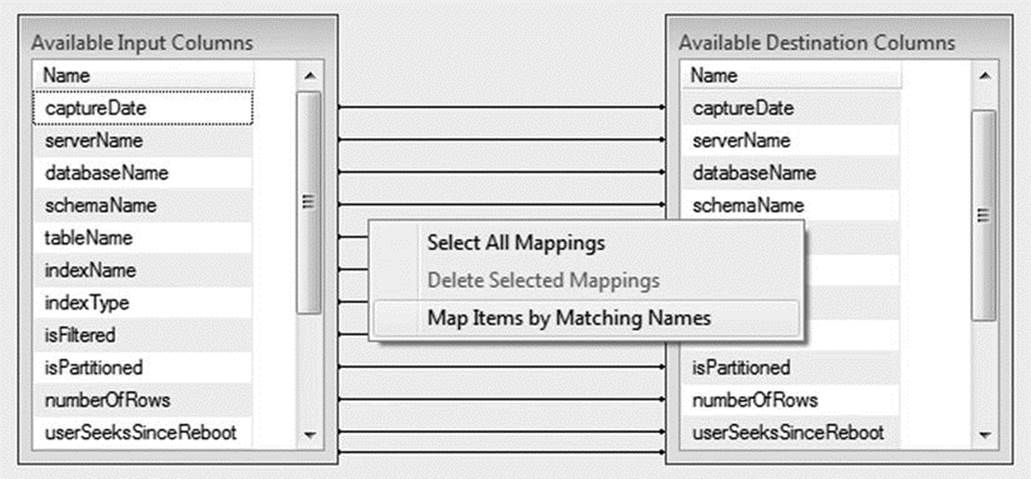
Figure 1-20. The Map Items by Matching Names option in the Mappings page
Once more, the log_id column will not map to anything because it is an identity column. Click OK to return to the Data Flow designer, and then click the Control Flow tab.
See how quickly that second data flow went? You can continue to easily add more metadata collection tasks using this method. All that you have left to do is to update your LastMonitored column in the dba_monitor_SQLServerInstances table.
![]() Tip It may be tempting to create a one-size-fits-all package. However, it is generally a better idea to separate metadata collections into separate packages organized by frequency requirements. For example, the metadata you have collected in this chapter only requires periodic samples, such as daily or weekly collection. Metadata that requires more frequent collection, such as an hourly check for failed SQL Server Agent jobs, should be stored in a separate package.
Tip It may be tempting to create a one-size-fits-all package. However, it is generally a better idea to separate metadata collections into separate packages organized by frequency requirements. For example, the metadata you have collected in this chapter only requires periodic samples, such as daily or weekly collection. Metadata that requires more frequent collection, such as an hourly check for failed SQL Server Agent jobs, should be stored in a separate package.
Add an Execute SQL task to your Foreach Loop container and rename it Update LastMonitored. Connect the Unused Indexes data flow to the Update LastMonitored Execute SQL task. Double-click the Execute SQL task to edit its properties. Select the dbaCentralLogging connection in the Connection drop-down, and then enter the code from Listing 1-9 in the SQLStatement field.
Listing 1-9. T-SQL Code to Update the LastMonitored Value in dba_monitor_SQLServerInstances
UPDATE dbo.dba_monitor_SQLServerInstances
SET LastMonitored = GETDATE()
WHERE SQLServerInstance= ?;
The question mark (?) informs the Execute SQL task to use a parameter to complete the SQL statement. Now you just need to map a variable to the parameter. To do this, click the Parameter Mapping page and click Add. Edit the properties as follows:
· Variable Name = User::SQLServerInstance
· Direction = Input
· Data Type = NVARCHAR
· Parameter Name = 0
· Parameter Size = 128
Confirm that your mappings match those shown in Figure 1-21, and then click OK.
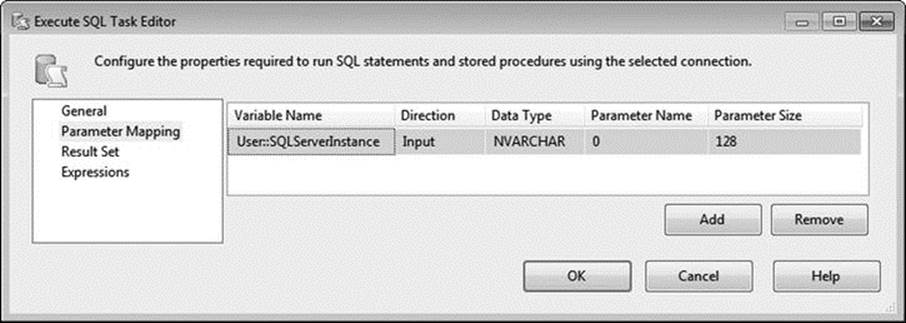
Figure 1-21. Parameter mapping in the Execute SQL Task Editor
You are now ready to execute your package! To do this, select Debug ![]() Start Debugging from the menu, click the green Run icon in the toolbar, or press F5. Your package should resemble Figure 1-22 when successfully executed.
Start Debugging from the menu, click the green Run icon in the toolbar, or press F5. Your package should resemble Figure 1-22 when successfully executed.
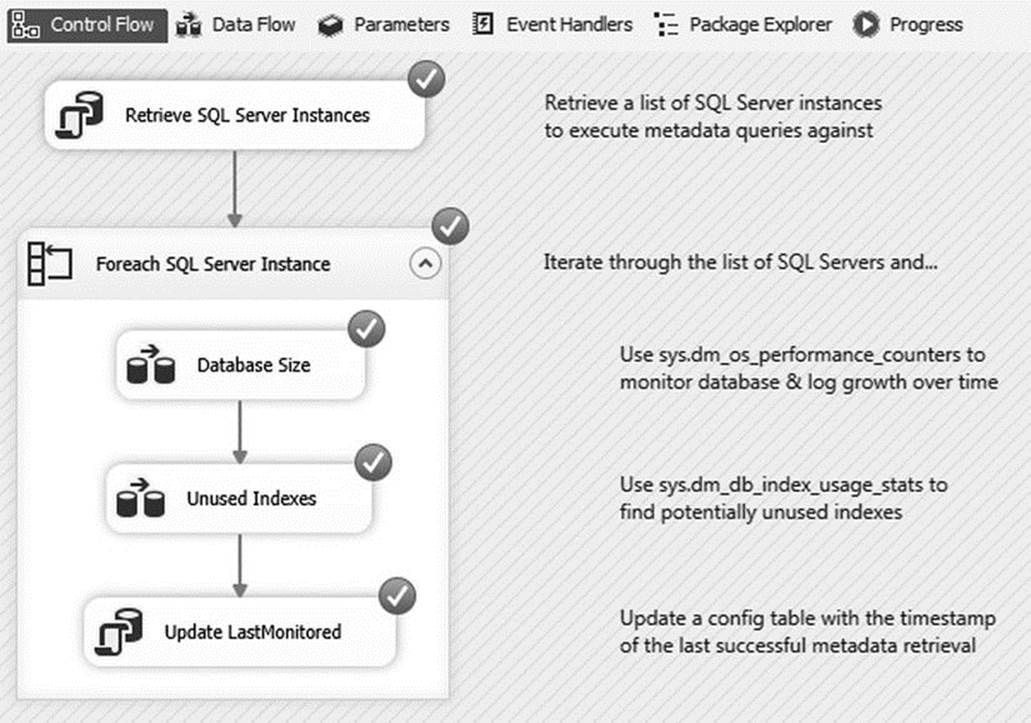
Figure 1-22. Successful execution of the MetadataCollection package
Congratulations! You have now collected metadata from a list of servers and stored the results in a single, centralized database.
This concludes our walk-through on collecting metadata via SSIS. However, as a diligent developer or DBA, you may want to consider many more tasks. First, as we discussed early on in this chapter, this package does not contain any exception handling or logging, which is outside the scope of this chapter. However, a best practice is to include some sort of exception handling and logging on every package. Second, we have only tipped the proverbial iceberg when it comes to collecting metadata. There is much more information to consider, such as security audits, error logs, SQL Server Agent job statuses, and much, much more. If you’re not sure where to start, consider ranking metadata tasks by criticality and adding incremental monitoring in descending order of importance. As a last piece of homework, you may want to consider setting up monitors to alert you when unfavorable conditions are met (for example, a SQL Server Agent job has failed or available space is getting low).
Summary
In this chapter, we discussed the importance of metadata. We explored some of the metadata that exists within SQL Server and provided two examples of useful T-SQL metadata queries. We identified a very flexible and reusable pattern for collecting database metadata in an enterprise environment. Lastly, we created an Integration Services package that retrieves a list of SQL Server instances to monitor and then logs the results to a centralized repository.