Real-time Analytics with Storm and Cassandra (2015)
Chapter 4. Storm in a Clustered Mode
We have now arrived at the next step in our journey with Storm, that is, to understand the clustered mode setup of Storm and its associated components. We will go through the various configurations in Storm and Zookeeper, and understand the concepts behind them.
The topics that will be covered in this chapter are as follows:
· Setting up the Storm cluster
· Understanding the configuration of the cluster and its impact on the functioning of the system
· The Storm UI and understanding the UI parameters
· Provisioning and monitoring applications for production setups
By the end of the chapter, you should be able to understand configurations of Storm and Zookeeper nodes. Also, you should be able to understand the Storm UI and set up Storm clusters and monitor them using various tools.
The Storm cluster setup
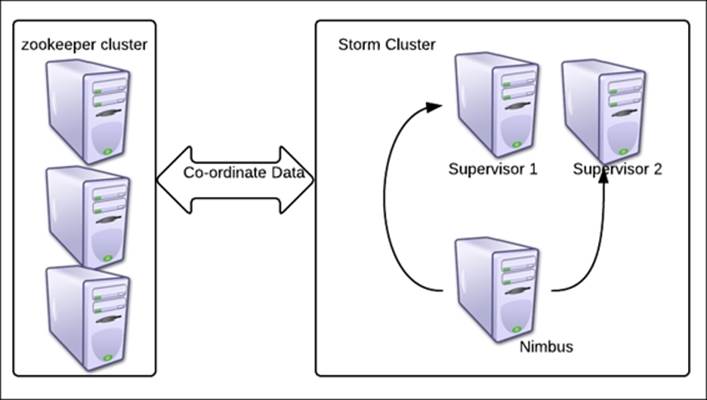
Depicted in the following figure is the Storm and Zookeeper reference cluster that we set up in Chapter 2, Getting Started with Your First Topology.
We have three-node Zookeeper clusters for a three-node Storm cluster (which has one Nimbus and two supervisors).
We are using the recommended three-node Zookeeper clusters to avoid a single point of failure in the Storm set up.
The Zookeeper cluster should have an odd number of nodes. The reason for this requirement is that the Zookeeper election logic requires the leader to have an odd number of votes, and that combination is possible only when odd nodes are in the quorum, as shown in the following figure:
Zookeeper configurations
Let's assume you have installed Zookeeper on all three Zookeeper nodes; now we will walk you through the configurations so that you have a better understanding of them.
An excerpt from zoo.cfg, in our case, is located at <zookeeper_installation_dir>/ zookeeper-3.4.5/conf/. The Zookeeper configurations are as follows:
· dataDir=/usr/local/zookeeper/tmp: This is the path where Zookeeper stores its snapshots; these snapshots are actually the state log where the current cluster state is maintained for the purpose of coordination. In the event of a failure, these snapshots are used to restore the cluster to the last stable state. This directory also contains a file containing a single entry called myID. This value starts from 1 and is different for each Zookeeper node, so we will keep it as follows:
· zkp-1.mydomain.net – value of myId =1
· zkp-2.mydomain.net – value of myId =2
zkp-3.mydomain.net – value of myId =3
Whenever you want to start from scratch, or when you upscale or downscale Storm or Zookeeper clusters, it is recommended that you clean up this local.dir file so that stale data is cleared.
· clientPort=2182: This configuration specifies the port on which the clients build connections with Zookeeper:
· server.1=zkp-1.mydomain.net:2888:3888
· server.2=zkp-2. mydomain.net:2888:3888
server.3=zkp-3. mydomain.net:2888:3888
These three rows in the preceding code actually specify the IP or the names of the servers that form a part of the Zookeeper cluster. In this configuration, we have created the three-node Zookeeper cluster.
· maxClientCnxns=30l: This number specifies the maximum number of connections a single client can make with this Zookeeper node. Here is how the calculation will go in our case:
The max number of connections one supervisor can make is 30 with one Zookeeper node. So, the maximum number of connections one supervisor can create with three Zookeeper nodes is 90 (that is, 30*3).
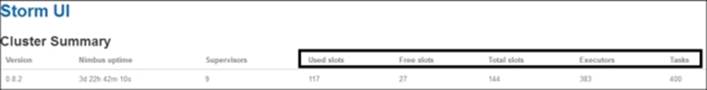
The following screenshot shows a capture from the Storm UI depicting the used, available, and free slots:
Note
The number of workers in the Storm cluster is related to the number of connections available in the Zookeeper cluster. If you don't have sufficient Zookeeper cluster connections, Storm supervisors will not be able to start.
Cleaning up Zookeeper
We have seen how Zookeeper stores all its coordination data in the form of snapshots in the path specified in the dataDir configuration. This requires periodic clean up or archival to remove old snapshots so that we don't end up consuming the entire disk space. Here is a small cleanup script that needs to be configured on all Zookeeper nodes:
numBackUps=3
dataDir=/usr/local/zookeeper/tmp
logDir=/mnt/my_logs/
echo `date`' Time to clean up StormZkTxn logs' >> $logDir/cleanStormZk.out
java -cp /usr/local/zookeeper/zookeeper-3.4.5/zookeeper- 3.4.5.jar:/usr/local/zookeeper/zookeeper-3.4.5/lib/log4j- 1.2.15.jar:/usr/local/zookeeper/zookeeper-3.4.5/lib/slf4j-api- 1.6.1.jar org.apache.zookeeper.server.PurgeTxnLog $dataDir -n $numBackUps >> $logDir/cleanStormZk.out
Here we have the cleanup script as follows:
· numBackUps: Here we specify how many snapshots we want to retain after cleanup; the minimum is three and the maximum can vary as per requirements.
· dataDir: Here we specify the path of the data directory where snapshots need to be cleaned up.
· logDir: This is the path where the clean up script will store its logs.
· org.apache.zookeeper.server.PurgeTxnLog: This is the utility class that purges all snapshots except the last three, as mentioned in numBackups.
Storm configurations
We will look at the Storm daemons and configurations around the daemons. For the Nimbus node, we have the following configuration settings in storm.yaml. Let's understand these configurations as given in the following code:
storm.zookeeper.servers:
- "zkp-1.mydomain.net "
- "zkp-2.mydomain.net "
- "zkp-3.mydomain.net "
storm.zookeeper.port: 2182
storm.local.dir: "/usr/local/storm/tmp"
nimbus.host: "nim-zkp-flm-3.mydomain.net"
topology.message.timeout.secs: 60
topology.debug: false
supervisor.slots.ports:
- 6700
- 6701
- 6702
- 6703
The functions of the configurations used in the preceding code are as follows:
· storm.zookeeper.servers: Here we specify the names or IPs of the Zookeeper servers from the Zookeeper cluster; note that we are using the same host names as mentioned in the zoo.cfg configuration in the previous section.
· storm.zookeeper.port: Here we specify the port on the Zookeeper node to which the Storm nodes connect. Again, we specified the same port that we had specified on zoo.cfg in the previous section.
· storm.local.dir: Storm has its own temporary data that is stored in a local directory. This data is automatically cleaned up, but whenever you want to start from scratch, or when you upscale or downscale the Storm or Zookeeper clusters, it is recommended that you clean up thislocal.dir configuration so that stale data is cleared.
· nimbus.host: This specifies the hostname or IP of the hostname that is being set as Nimbus.
· topology.message.timeout.secs: This value specifies the duration in seconds after which a tuple being processed by the topology is declared as timed out and discarded. Thereafter, depending upon whether it's a reliable or unreliable topology, it's replayed or not. This value should be set cautiously; if set too low, all messages will end up being timed out. If it is set too high, one may never get to know the performance bottlenecks in the topology.
· topology.debug: This parameter denotes whether you want to run the topology in the debug mode or node. The debug mode is when all the debug logs are printed, and it is recommended in the development and staging mode, but not in the production mode because I/O is very high in this mode and thus hits the overall performance.
· supervisor.slots.ports: This parameter specifies the ports for the supervisor workers. This number directly ties to the number of workers that can be spawned on the supervisor. When topologies are spawned, one has to specify the number of workers that are to be allocated, which in turn ties to actual resources allocated to the topology. The number of workers is really important because they actually identify how many topologies can run on the cluster and in turn how much parallelism can be achieved. For example, by default, we have four slots per supervisor, so in our cluster, we will have Total number of slots/workers = 4*2 = 8. Each worker takes a certain number of resources from the system in terms of CPU and RAM, so how many workers are spawned on the supervisor depends on the system configuration.
Storm logging configurations
Now we will have a look at the logging configurations of Storm. They use the logback implementation of Log4J and its configurations can be found and tweaked from cluster.xml located at <storm-installation-dir>/apache-storm-0.9.2-incubating/logback using the following code:
<appender name="A1" class="ch.qos.logback.core.rolling.RollingFileAppender">
<file>${storm.log.dir}/${logfile.name}</file>
<rollingPolicy class="ch.qos.logback.core.rolling.FixedWindowRollingPolicy">
<fileNamePattern>${storm.log.dir}/${logfile.name}.%i</fileNamePattern >
<minIndex>1</minIndex>
<maxIndex>9</maxIndex>
</rollingPolicy>
<triggeringPolicy class="ch.qos.logback.core.rolling.SizeBasedTriggeringPolicy">
<maxFileSize>100MB</maxFileSize>
</triggeringPolicy>
<encoder>
<pattern>%d{yyyy-MM-dd HH:mm:ss} %c{1} [%p] %m%n</pattern>
</encoder>
</appender>
<root level="INFO">
<appender-ref ref="A1"/>
</root>
In the preceding snippet, a few sections are highlighted, which we will walk through for a closer look. They are as follows:
· <file>: This tag holds the log directory path and the filename on which the logs are generated by the Storm framework.
· <filenamepattern>: This is the pattern in which files are formed and rolled over; for example, with the preceding code pattern, we have worker log files as worker-6700.log and worker-6700.1.log.
· <minIndex> and <maxIndex>: These are very important in order to specify how many files we want to retain with this rolling appender; in this case, we will have nine backup files, which are numbered from one to nine, and one running log file.
· maxFileSize: This parameter specifies at what size the file should rollover, for instance, in our case, it's 100 MB; this means the worker log file will roll over to the next index when it reaches this size.
· root level: This specifies the logging level; in our case, we have specified it as Info, which means Info and the above logs will be printed in the log files, but logs from levels below the Info level will not be written to the logs. The following is the logging level hierarchy for reference:
o OFF
o FATAL
o ERROR
o WARN
o INFO
o DEBUG
o TRACE
o ALL
The Storm UI
Storm provides a UI that can be accessed to check various parameters in the Storm configuration and topology metrics. In this section, we will understand the various components of the Storm UI.
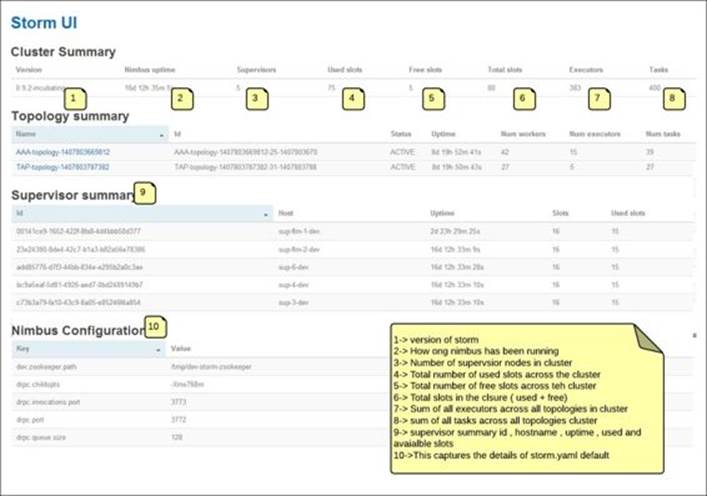
The following screenshot depicts the landing page of the Storm UI. The details of various sections are captured in the figure itself:
The following screenshot is a deeper look at the Storm UI; here we are looking at the UI projection for a particular topology:
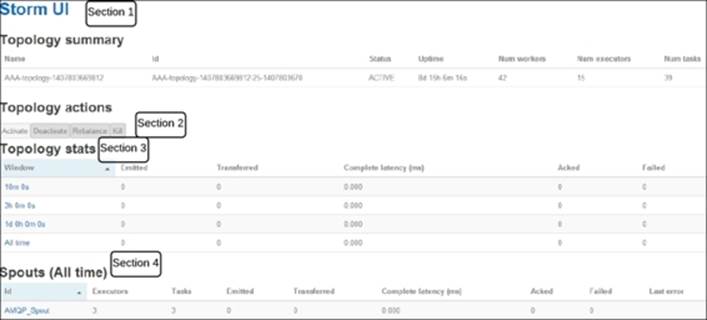
I have demarcated sections on the preceding screenshot; let's discuss them in detail so that you understand each of them completely.
Section 1
This section holds the summary of the topologies running in the Storm cluster. Here are details of various attributes captured in this section:
· Topology Name: This is specified when submitting the topology. You can refer to the WordCountTopology.java file, which we created earlier. The following snippet, word-count, is the name of that topology:
cluster.submitTopology("word-count", conf, builder.createTopology());
In our preceding sample screenshot, AAA-topology-1407803669812 is the name of the topology.
· ID: This is the Storm-generated unique ID that is a combination of the topology name, timestamp, and ID, which is used by Storm to identify and differentiate the topology.
· Status: This denotes the state of the topology, which could be active for a live topology, killed when a topology is killed using the UI or CLI, inactive for a deactivated topology, and rebalancing for a topology where the rebalance command is executed wherein the number of workers allocated to the topology is increased or decreased.
· Uptime: As the name suggests, this mentions the duration for which the topology has been running. For example, our sample topology has been running for 8 days 15 hours 6 months 16 seconds.
· Num workers: This specifies how many workers are allocated to the topology. Again, if we refer to WordCountTopology.java, we will see this snippet where it is declared as 3:
conf.setNumWorkers(3);
· Num executors: This specifies the sum total of the number of executors in the topology. This is connected to the parallelism hint that is specified during the overall integration of the topology in the topology builder as follows:
builder.setSpout("spout", new RandomSentenceSpout(), 5);
Here, in our WordCount topology, we have specified the parallelism of the spout as 5, so five instances of the spout will be spawned in the topology.
· Num tasks: This gains the sum total of another parameter that is specified at the time of overall integration in the topology, as shown:
builder.setSpout("spout", new RandomSentenceSpout(), 5).setNumTasks(10);
Here, we are specifying that for 5 executors dedicated to the spout, the total value of numtasks is 10, so two tasks each will be spawned on each of the executors.
What we see on the UI is a total of all numtasks values across all topology components.
Section 2
This section holds the various actions that can be performed on the topology:
· Activate: The UI provides a facility to revive or reactivate a topology that has been suspended earlier. Once activated, it can again start consuming the messages from the spout and process them.
· Deactivate: When this action is executed, the topology immediately turns off the spout, that is, no new messages are read from the spout and pushed downstream to the DAG. Existing messages that are already being processed in various bolts are processed completely.
· Rebalance: This action is executed when the worker allocation to a live topology is altered.
· Kill: As the name suggests, this is used to send a termination signal for the topology to the Storm framework. It's always advisable to provide a reasonable kill time so that the topology drains completely and is able to clean the pipelined events before it terminates.
Section 3
This section displays a capture of the number of messages processed on the timeline. It has the following key sections:
· Window: This field specifies the time duration in the following segments: last for 10 minutes, last 3 hours, the past day, or all the time. The topology's progress is captured against these time sections.
· Emitted: This captures the number of tuples emitted by the spout at various time segments.
· Transferred: This specifies the number of tuples sent to other components in the topology. Please note that the number of emitted tuples may or may not be equal to the number of transferred tuples as the former is the exact number of times the emit method of the spout is executed, while the latter is the number transferred based on the grouping used; for example, if we have bound a spout to a bolt that has the parallelism of two tuples using all grouping, then for every x tuples emitted by the spout, 2x tuples will be transferred.
· Complete latency(ms): This is the average total time taken by a tuple to execute throughout the topology.
· Acked: This holds the number of events acked that are successfully processed.
· Failed: This is the number of events that failed to process successfully.
Section 4
This section is the same as Section 3, the only difference being that here, the terms are displayed at a component level, that is spouts and bolts, while in Section 3, it was at the topology level. There are a few more terms on the UI that you should be introduced to. They are as follows:
· Capacity: This is one of the most important metrics to look at when fine-tuning the topology. It indicates the percentage of time the bolt spent in the last ten minutes to execute the tuple. Any value close to one or above is an indication to increase the parallelism of this bolt. It's calculated using the following formula:
Capacity = (Number of tuples Executed*Average execute latency)/Window_Size*1000)
· Execute latency: This is the average time a tuple spends in the execute method of the bolt during processing.
· Processlatency: Process latency is the average time it takes from when the tuple is received by the bolt to the time when it's acked (acknowledged to denote successful processing).
The visualization section
One of the improvements in Storm 0.9.2 is visual depiction of the topology. The following figure is the depiction of a sample topology in the Storm UI:
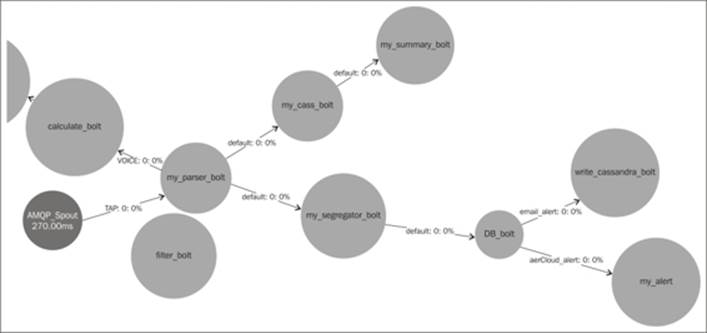
In the preceding screenshot, you can see all the streams visually labeled by various bolts and spouts on the topology along with latency and other key attributes.
The Storm UI provides a very rich interface where the user can start from a very high level and drill down deeper in specific areas, as you can see in the screenshot in The Storm cluster setup section where we discussed the Storm cluster level attributes; in the second level, we moved to a specific topology. Next, within a topology, you can click on any bolt or worker and the component level details will be presented to you. One item as highlighted in the following screenshot is of high importance for debugging and log deciphering in cluster setup—the worker ID. If some component spout or bolt is giving us issues and we want to understand the working, the first place to look is the logs. To be able to look at logs, one needs to know where the troublesome bolt is executing which supervisor and which worker; this can be inferred by drilling on that component and looking into the executor section as follows:

The Storm UI capturing the supervisor port
Here, the host tells you which supervisor this component is running on and the port tells you about the worker, so if I want to look for logs of this component, I will look into logdir for sup-flm-dev-1.mydomain.net in the log directory under worker-6711.log.
Storm monitoring tools
The clustered setup of the likes of Storm need constant monitoring, because they are generally developed to support real-time systems wherein downtime could be of concern for Service Level Agreement (SLA). A lot of tools are available on the market that could be used to monitor the Storm cluster and to raise an alert. Some of the Storm monitoring tools are as follows:
· Nagios: This is a very powerful monitoring system that can be extended to generate e-mail alerts. It can monitor various processes and system KPIs and can be tweaked by writing custom scripts and plugins to restart certain components in the event of a failure.
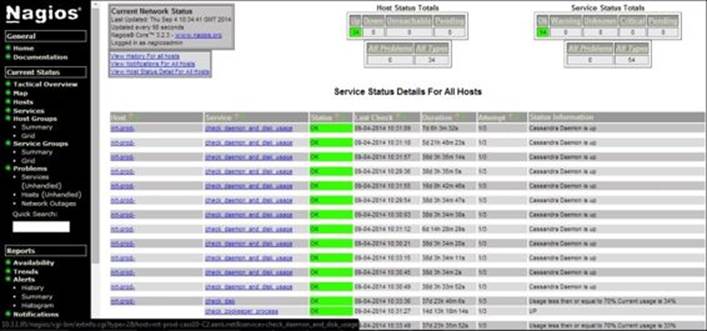
Nagios service console
In the preceding screenshot of a Storm cluster with Nagios monitoring, you can see various processes and other system level KPIs that can be monitored such as CPU, memory, latency, HDD usage, and so on.
· Ganglia: This is another widely used open source tool that lets you set up a monitoring framework for Storm clusters.
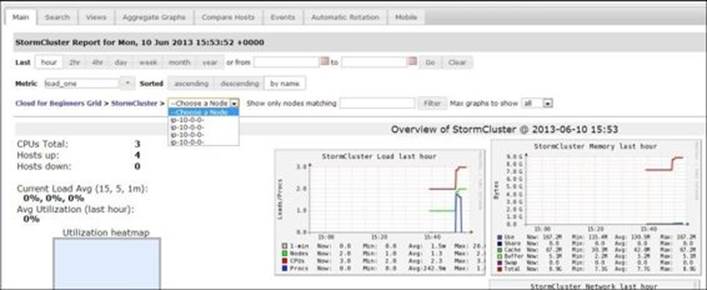
As seen in the preceding screenshot, we have a lot of drill-down options; we can see load and CPU level details as well as other system and cluster level KPIs to capture and plot out the cluster health.
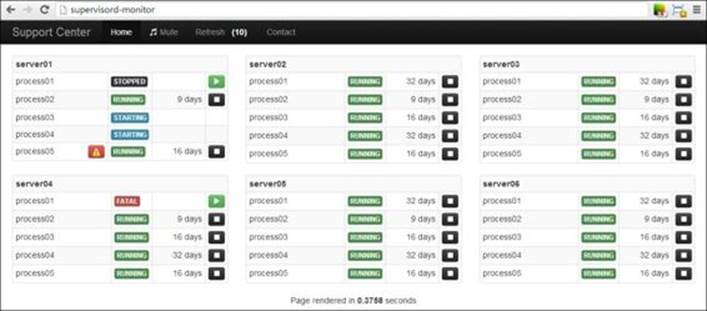
· SupervisorD: This is another open source monitoring system that is widely used in conjunction with Storm to capture and retain the health of the cluster. SupervisorD also helps in provisioning and starting the Storm services and it can be configured to restart them in case of any failures.
· Ankush: This is another provisioning and monitoring system that could be used for Storm and other big data cluster setup and management. It has both paid and open source versions (https://github.com/impetus-opensource/ankush). It has the following salient features:
|
Provisioning |
Environment supported by this application Physical nodes Virtual nodes on Cloud (AWS or On-Premise) |
|
Single technology clusters |
|
|
Multi-technology clusters |
|
|
Template-based cluster creation |
|
|
Redeploy an erred cluster |
|
|
Rack support |
|
|
Enhanced node validation before deployment |
|
|
Monitoring |
Heat maps |
|
Service monitoring |
|
|
Technology-based monitoring |
|
|
Rich graphs |
|
|
Alerts and notifications for key events |
|
|
Centralized log view |
|
|
Audit trail |
|
|
Alerts on dashboard and e-mails |
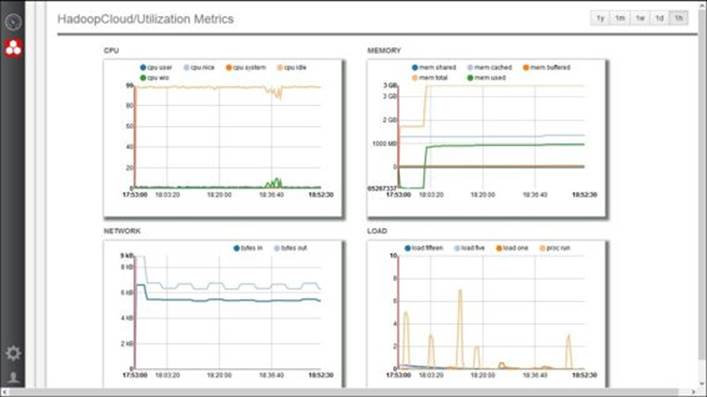
The following screenshot is a dashboard screenshot of Ankush. All the system level KPIs such as CPU, load, network, memory, and so on are very well captured.
Quiz time
Q.1. State whether the following statements are true or false:
1. The Storm configurations are stored in cluster.xml.
2. We can have only four workers allocated per supervisor.
3. The Zookeeper cluster always has an odd number of nodes.
4. Zookeeper needs a minimum of three snapshots to recover its state from failure.
5. A topology can continue to execute if Nimbus and the supervisor dies.
Q.2. Fill in the blanks:
1. _______________ is the average time a tuple takes to get processed and acked.
2. _______________ is the average time a tuple spends in the execute method.
3. The ____________ component is responsible for the recovery of the Storm cluster in the event of a failure.
Q.3. Execute the WordCount topology on a three-node Storm cluster (one Nimbus and two supervisors) and then perform the following tasks:
· Kill the Nimbus node while the topology is running—observe that the topology will not fail; it will continue unaffected.
· Kill the supervisor while the topology is running—observe that the topology does not fail, it will continue unaffected. The workers will continue to execute with Zookeeper co-ordination.
· Try various operations such as rebalance and deactivate from the Storm UI.
Summary
In this chapter, you got a detailed understanding of the Storm and Zookeeper configurations. We explored and walked you through the Storm UI and its attributes. Having done the cluster setup, we briefly touched upon various monitoring tools available for operational production support in Storm.
In the next chapter, we will get you introduced to RabbitMQ and its integration with Storm.
All materials on the site are licensed Creative Commons Attribution-Sharealike 3.0 Unported CC BY-SA 3.0 & GNU Free Documentation License (GFDL)
If you are the copyright holder of any material contained on our site and intend to remove it, please contact our site administrator for approval.
© 2016-2026 All site design rights belong to S.Y.A.