OpenGL SuperBible: Comprehensive Tutorial and Reference, Sixth Edition (2013)
Part III: In Practice
Chapter 13. Debugging and Performance Optimization
What You’ll Learn in This Chapter
• How to figure out what’s wrong when your application isn’t doing what you want it to
• How to achieve the highest possible performance
• How to make sure you’re making the best use of OpenGL that you can
By now, you’ve learned a lot about OpenGL. You’ll probably have started writing some pretty complex programs of your own, and chances are they won’t work first time — and even when you get them working, they won’t go as fast as you’d like them to. In this chapter, we take a look at two important skill sets: debugging and performance tuning. The first helps you to just get your application running correctly. The second helps you to get it to run fast. Both are important for production-quality applications that must run on the widest range of hardware possible.
Debugging Your Applications
It is an all-too-common scenario that you’ll invent a nifty new algorithm for rendering something; set up all your textures, vertices, framebuffers, and other data that you’ll need; start calling drawing commands; and either see nothing, or see something other than what you wanted. In this section we’ll cover two very powerful assets that are available to you to assist in the debugging of your application. The first is the debug context, which is a mode of OpenGL that provides thorough error checking and feedback about your use of the OpenGL API. The second is the tools that are freely available to help you debug your application. Running your application inside one of these tools can provide you with great insight about its behavior and the use of OpenGL, and some tools can even give you advice about how you might change your application to make it run faster.
Debug Contexts
When you create an OpenGL context, you have the option of creating it in one of several modes. One of these modes is the debug context. When you create a debug context, OpenGL installs additional layers between your application and the normal paths it will take into the drivers and ultimately to the GPU. These additional layers perform strict error checking, analysis of your parameters, recording of errors, and a number of other things that would normally be too expensive to penalize a production-ready, debugged application with. The method with which you create a debug context is platform specific and will be covered in Chapter 14. For now, we can use the sb6 application class to create a debug context for us. To explicitly create a debug context, override the sb6::application::init() function, and set the debug flag in the application info structure as shown in Listing 13.1.
void my_application::init()
{
sb6::application::init();
info.flags.debug = 1;
}
Listing 13.1: Creating a debug context with the sb6 framework
In debug builds, the sb6 base class automatically sets this bit, and if debug contexts are available, it will create one. In this case, you don’t need to do anything. If you want to create a debug context in release builds of your application (or if you want to force a non-debug context in a debug build), you’ll need to override the init() function as shown in Listing 13.1.
Once you have created a debug context, you need to give it a way to notify your application when something goes wrong. To do this, OpenGL uses a callback function that is specified using a function pointer. The definition of the callback function pointer type is
typedef void (APIENTRY * GLDEBUGPROC)(GLenum source,
GLenum type,
GLuint id,
GLenum severity,
GLsizei length,
const GLchar* message,
void* userParam);
The function is defined to have the same calling conventions as OpenGL API functions — this is the purpose of the APIENTRY macro, which is defined by the OpenGL header files to the correct thing for the platform for which the code is being compiled. To implement the debug callback, create a function with the appropriate signature, and then call glDebugMessageCallback(), whose prototype is
void glDebugMessageCallback(GLDEBUGPROC callback,
void * userParam);
Here, callback is a pointer to your debug output callback function, and the userParam parameter is simply stored by OpenGL and passed back to your callback function in its userParam parameter. An example of this is shown in Listing 13.2.
static void APIENTRY simple_print_callback(GLenum source,
GLenum type,
GLuint id,
GLenum severity,
GLsizei length,
const GLchar* message,
void* userParam)
{
printf("Debug message with source 0x%04X, type 0x%04X, "
"id %u, severity 0x%0X, '%s'\n",
source, type, id, severity, message);
}
void initialize_debug_output()
{
glDebugMessageCallback(&simple_print_callback, NULL);
}
Listing 13.2: Setting the debug callback function
Once you have set up a debug callback function, OpenGL will call it whenever it needs to report information to your application. You should be careful not to call any OpenGL functions from inside the callback function. This is not legal and, should your OpenGL code cause an error (which might end up calling your callback function again), could easily cause an infinite loop and crash your program. In the simple example of Listing 13.2, we just print the message along with the raw values of several of the parameters using the C function printf. Again, in debug builds, the sb6application framework installs a default debug callback function that simply prints the received message. However, if you want more advanced control over the formatting of your messages, or if you’re not using the sb6 application framework, you can use the parameters of the callback function to your advantage.
In the callback function, the source parameter indicates which part of OpenGL the message originated from. It may be one of the following values:
• GL_DEBUG_SOURCE_API indicates that the message was generated by the use of the OpenGL API — perhaps you passed an incorrect value for a parameter for example. The message will tell you which parameter, why the value was incorrect, and what the range of acceptable values is.
• GL_DEBUG_SOURCE_SHADER_COMPILER is normally used by OpenGL to send compilation errors and warning messages to your application. Very often, this will be the same information that is stored in the shader and program information logs.
• GL_DEBUG_SOURCE_WINDOW_SYSTEM indicates that the issue was raised by some interaction with the window system or perhaps the operating system.
• GL_DEBUG_SOURCE_THIRD_PARTY suggests that the message came from a tool, utility library, or other source outside the OpenGL driver.
• GL_DEBUG_SOURCE_APPLICATION says that the message came from your application. That’s right — you can insert messages into the log, which we will get to in a moment.
• GL_DEBUG_SOURCE_OTHER is a catch-all category for anything that doesn’t fit anywhere else.
The type parameter gives you further information about what the message is for. It can take one of the following values:
• GL_DEBUG_TYPE_ERROR means that an error has occurred. For example, if the source is the OpenGL API, glGetError() will probably return an error code. If the source is the shader compiler, then it probably means that one of your shaders failed to compile.
• GL_DEBUG_TYPE_DEPRECATED_BEHAVIOR means that you’ve attempted to use features that are marked for deprecation (which means that they will removed from future versions of OpenGL).
• GL_DEBUG_TYPE_UNDEFINED_BEHAVIOR indicates that something your application is trying to do will produce undefined behavior, and that even if it might work on this particular OpenGL implementation, this is not standard and might break if you run it on another computer.
• GL_DEBUG_TYPE_PERFORMANCE messages are generated by OpenGL when it is trying to warn you that something you’re doing isn’t likely to perform well. The message may even include information about what you could consider doing instead.
• GL_DEBUG_TYPE_PORTABILITY suggests that you are using OpenGL in a way that is well defined, but possibly only on your implementation of OpenGL. This means that your code might not be portable.
• GL_DEBUG_TYPE_MARKER is used to insert events into the OpenGL command stream that can be picked up by tools and other debugging aids.
• GL_DEBUG_TYPE_PUSH_GROUP and GL_DEBUG_TYPE_POP_GROUP messages are generated when you use the glPushDebugGroup() and glPopDebugGroup() functions that are explained later in this section.
• GL_DEBUG_TYPE_OTHER is used for any messages that don’t cleanly fit into any of the preceding categories.
The severity argument may be one of GL_DEBUG_SEVERITY_LOW, GL_DEBUG_SEVERITY_MEDIUM, or GL_DEBUG_SEVERITY_HIGH to indicate that the message is of low, medium, or high severity, respectively. It could also be GL_DEBUG_SEVERITY_NOTIFICATION if the message is for informational purposes and has no negative connotations.
In addition to the source, type, and severity properties, each message is assigned a unique identifier, which is passed to your callback function in the id parameter. Its actual value is implementation defined, but it can be used to refer to a specific message. The other parameters to the debug callback function are the length of the message string (in length), a pointer to the string itself (in message), and the userParam parameter that you passed to glDebugMessageCallback(). You can use this for whatever you want. For example, you could put a pointer to an instance of a class in it, a file handle, or any other type of object that can be represented as a pointer.
You can tell OpenGL which types of messages you want to receive by calling the glDebugMessageControl() function. Its prototype is
void glDebugMessageControl(GLenum source,
GLenum type,
GLenum severity,
GLsizei count,
const GLuint * ids,
GLboolean enabled);
The source, type, and severity parameters together form a filter that is used to select the group of debugging messages that the function will affect. Each of the parameters can have one of the values that are passed in the similarly named parameters to the debug message callback function described earlier. Additionally, any combination of these parameters can be set to GL_DONT_CARE. If one of the parameters is GL_DONT_CARE, then it is effectively ignored for the purposes of filtering; otherwise, any message whose source, type, or severity matches the value passed will be included in the filter. Furthermore, if ids is not NULL, then it is considered to be a pointer to an array of count message identifiers. Any message whose identifier is in this list will be considered part of the filter.
Once the filter has been formed, the reporting of the resulting group of messages is enabled if enabled is GL_TRUE and is disabled if it is GL_FALSE. Using glDebugMessageControl(), you can effectively turn on or off reporting of particular classes of messages. For example, to turn on all high severity messages, but turn off any message produced by the shader compiler, you could call
// Enable all messages with high severity
glDebugMessageControl(GL_DONT_CARE, // Source
GL_DONT_CARE, // Type
GL_DEBUG_SEVERITY_HIGH, // Severity
0, NULL, // Count, ids
GL_TRUE); // Enable
// Disable messages from the shader compiler
glDebugMessageControl(GL_DEBUG_SOURCE_SHADER_COMPILER,
GL_DONT_CARE,
GL_DONT_CARE,
0, NULL,
GL_FALSE);
In addition to debug messages that might be produced by the OpenGL implementation, you can insert your own messages into the debug output stream. When you do this, your debug callback function will be called, and so you can record these messages using the same logging mechanisms you might implement for regular debugging messages. To inject your own message into the debug output log, call
void glDebugMessageInsert(GLenum source,
GLenum type,
GLuint id,
GLenum severity,
GLsizei length,
const char * message);
Again, the source, type, id, and severity parameters have the same meanings as they do in the debug callback function. In fact, you can even pass sources such as GL_DEBUG_SOURCE_SHADER_COMPILER in these parameters, but really the GL_DEBUG_SOURCE_APPLICATION token is reserved for application use and the GL_DEBUG_SOURCE_THIRD_PARTY is designed for tools and utility libraries. OpenGL will not generate messages with these sources. As most of the debug messages are intended to warn you of bad behavior, the GL_DEBUG_TYPE_MARKER is reserved for informational messages. Tools may intercept this message stream and treat it specially. The length parameter contains the length of the string pointed to by message. If length is 0, then message is considered to be a null-terminated string.
You can group messages together into hierarchical sets called debug groups. Tools that capture debug output may, for instance, indent groups of messages or color them differently in a log viewer. When OpenGL starts up, it will use the default group. Further groups can be created by pushing them onto the debug group stack. To do this, call
void glPushDebugGroup(GLenum source,
GLuint id,
GLsizei length,
const char * message);
When you do this, a copy of the current debug state will made and copied to the top location of the debug stack. At the same time, a debug message will be generated and sent to your callback function. It will have its type set to GL_DEBUG_TYPE_PUSH_GROUP and its severity set toGL_DEBUG_SEVERITY_NOTIFICATION. It will have the source and identifier specified in the source and id parameters, respectively. As with glDebugMessageInsert(), message and length specify the address of the message string and its length, respectively, and if length is 0, then message is considered to point to a null-terminated string.
When you want to leave a debug group, call
void glPopDebugGroup(void);
Again, glPopDebugGroup() will produce another debug message, this time with the type parameter set to GL_DEBUG_TYPE_POP_GROUP but with all the other parameters set to the same thing as the corresponding message from when the group was pushed.
When OpenGL produces debug messages, it will usually refer to objects such as textures, buffers, framebuffers, and so on by their number (the name you pass to OpenGL functions). This might be a bit confusing if you need to trawl through hundreds of lines of log looking for usage of a specific texture. To make this a little easier, you can assign human-readable names to objects by calling glObjectLabel() or glObjectPtrLabel(), whose prototypes are
void glObjectLabel(GLenum identifier,
GLuint name,
GLsizei length,
const char * label);
void glObjectPtrLabel(void * ptr,
GLsizei length,
const char * label);
When you call glObjectLabel(), you should pass in identifier the type of object referred to by name, which is the name of the object. identifier may be one of the following:
• GL_BUFFER if name is the name of a buffer object.
• GL_FRAMEBUFFER if name is the name of a framebuffer object.
• GL_PROGRAM_PIPELINE if name is the name of a program pipeline object.
• GL_PROGRAM if name is the name of a program object.
• GL_QUERY if name is the name of a query object.
• GL_RENDERBUFFER if name is the name of a renderbuffer object.
• GL_SAMPLER if name is the name of a sampler object.
• GL_SHADER if name is the name of a shader object.
• GL_TEXTURE if name is the name of a texture object.
• GL_TRANSFORM_FEEDBACK if name is the name of a transform feedback object.
• GL_VERTEX_ARRAY if name is the name of a vertex array object.
For glObjectPtrLabel(), the object is identified by a pointer type. This function is used for objects that have pointer types in OpenGL, which is currently only sync objects.
For both functions, the label and length parameters specify the name of the object and the length of the name, respectively. Again, if length is 0, then label is considered to point to a null-terminated string. Once you’ve given an object a name, OpenGL will use the text name rather than the raw number in debug messages. For example, you could set the debug object label of texture objects to the name of the file from which they were loaded.
Performance Optimization
Once your application is running correctly, you might want to undertake some level of performance optimization and tuning. Improving the performance of your application does two things:
• It lowers the minimum specification of the computer needed to run the application, increasing the potential user base.
• It increases the amount of time you might have in any given frame to apply additional special effects, render more geometry, or run more complex shaders.
In this section, we will cover the use of performance analysis tools to measure where your application might be spending its time and possibly highlight some areas where you might be able to improve its usage of the computing resources at your disposal. Next, we’ll take a look at some things that you can do in your application to make sure that it’s efficient.
Performance Analysis Tools
In this section, we’ll cover some of the performance analysis tools that are freely available and don’t rely on any non-free tools. That is, you can go download and install them right now! The first of these tools is GPUView, which is part of the Windows Performance Toolkit by Microsoft. The second is AMD’s GPU PerfStudio 2. Both of these tools are available for download from their respective vendors’ Web sites.
Windows Performance Toolkit and GPUView
Microsoft’s Windows Performance Toolkit (WPT) is a suite of tools for measuring the performance of various parts of the Windows operating system. It can measure CPU usage and events, memory and disk accesses, network activity, and a multitude of other things. What we are most interested in here is GPU activity.
Modern graphics processors operate by processing command buffers, which are sequences of commands encoded in some form of byte code and sent from the application (or in this case, the OpenGL driver) to the graphics card. Sending a command buffer to the graphics card is sometimes known as submission. The GPU picks up the command buffers, interprets their contents, and acts on the instructions they contain. Command buffers are stored in one or more queues. When the driver first submits a command buffer for execution, the operating system (or some component of it) manages that queue and holds the command buffer in a ring waiting to send it to the hardware — this queue is referred to as the software queue or CPU queue. Once the hardware is ready to execute a new command buffer, a low level component of the graphics driver signals the GPU to pick up the command buffer at the front of the queue and execute it. The GPU can usually get one or more command buffers lined up and ready to execute while it is still working on previously enqueued buffers. The command buffers that have been sent to the hardware but are still waiting to execute are held in a hardware queue.
GPUView is a tool that is included in the WPT that is designed to allow you to visualize command buffer submission and the activity in the hardware and software queues. It can track all of the submissions that the application makes (through the OpenGL driver) into the operating system queues, tell you what type of submissions are being made, and show how they get batched up, sent to the hardware, and executed. You can see how long each command buffer spent waiting in the software queues before being sent to the hardware, how long each spent in the hardware queue, and how long it spent being executed. An annotated screenshot of GPUView running is shown in Figure 13.1.
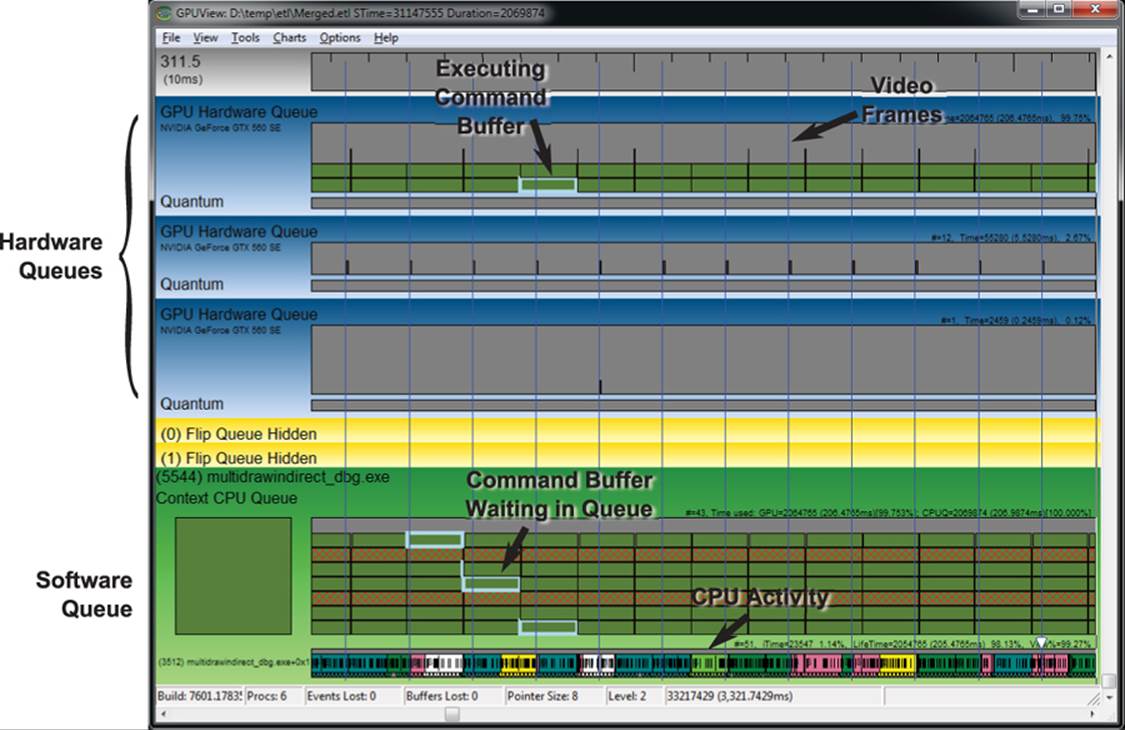
Figure 13.1: GPUView in action
The application under analysis is Figure 13.1 is the asteroid field example from Chapter 7, a screenshot of which is shown in Figure 7.9. This particular application uses almost all of the available GPU time. The system used to capture this trace contained an AMD Phenom X6 1050T processor with six CPU cores and an NVIDIA GeForce GTX 560 SE graphics card with two displays attached to it. The application was running in full screen on one of the displays while the other display was used for development tools. The top hardware queue is clearly executing the application under test. The small submissions on the second queue are Windows’ Desktop Window Manager (DWM) performing composition on the second display. The vertical lines running through the trace are the vertical refresh events that are associated with the display. In this application, synchronization to vertical refresh (also known as vsync) is off. Now take a look at Figure 13.2.
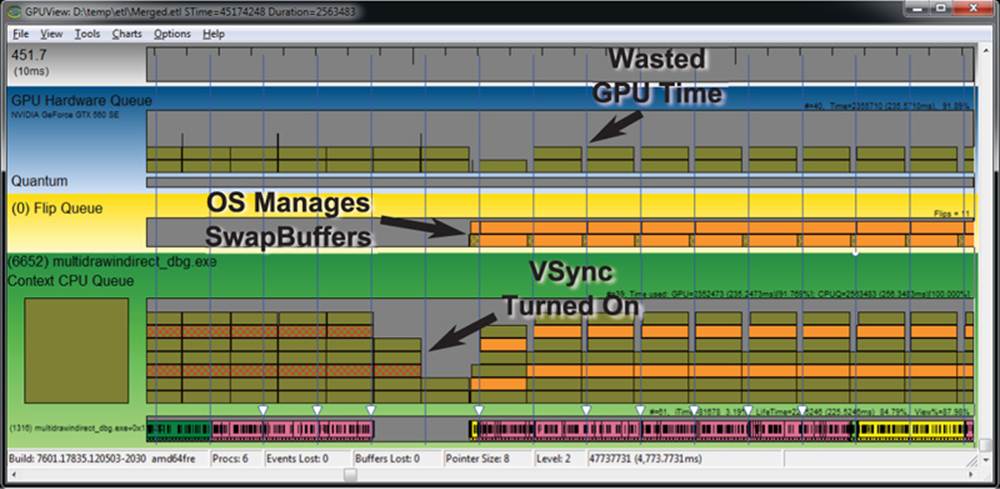
Figure 13.2: VSync seen in GPUView
In Figure 13.2, we start running the application in full-screen mode with vsync turned off (which is the default). Then, during the run, we turn on vsync. This point is clearly visible in the GPUView image. When vsync is turned on, the software and hardware queues drain, and the operating system takes over presentation of the rendered frames. When vsync is off, OpenGL tells the graphics hardware to get done with what it’s rendering and show the result to the user as soon as possible. When it’s on, the operating system holds back the graphics hardware and tells it to wait for a vertical refresh event before showing the frame to the user. This causes the GPU to idle for short periods of time between each frame, which shows up as gaps in the hardware queue. This is effectively wasted time. Here, we have wasted time on purpose in order to not allow the application to get too far ahead of the display (and to show what this looks like in the tool). However, anything that causes the GPU to have to wait will waste GPU time.
When you install the WPT, its program directory will contain a gpuview folder, which is where the GPUView tool is located. In that same directory is the file log.cmd, which is a script for starting and stopping recording of logging events into ETL files — Event Trace Logs. This is the raw data that is interpreted by the GPUView tool. ETL files can be extremely large. To start recording data, run log.cmd from a command prompt with administrative privileges, and then to stop it, run log.cmd again. Even running a simple application for a minute or so can generate gigabytes of data, so it’s best to keep recording times short and sweet. Other suggestions include minimizing the number of other applications running (especially those with graphical output) and disabling the Aero user interface (which turns off DWM composition). Also, you can implement a pause feature in your application such that it can be made to stop rendering. Then, pause the application, start logging, allow the application to render for a few seconds, pause it again, and then stop logging. When logging is active, a number of ETL files are written into the directory from which logging is started. One file is created for each of several of the major Windows subsystems, and then when logging is terminated, they are all merged together into a single file called Merged.etl, which is what is loaded into GPUView.
In addition to regular command buffer submissions (referred to by GPUView as standard queue packets in the CPU queue and standard DMA packets once they reach the hardware), the tool can show you a number of other events that might be inserted into the graphics pipeline. For example,present packets are events that instruct the operating system to display the results of rendering (triggered by the SwapBuffers() command) and are displayed with a crosshatch pattern by GPUView. Clicking on a packet brings up a dialog similar to the one shown in Figure 13.3.
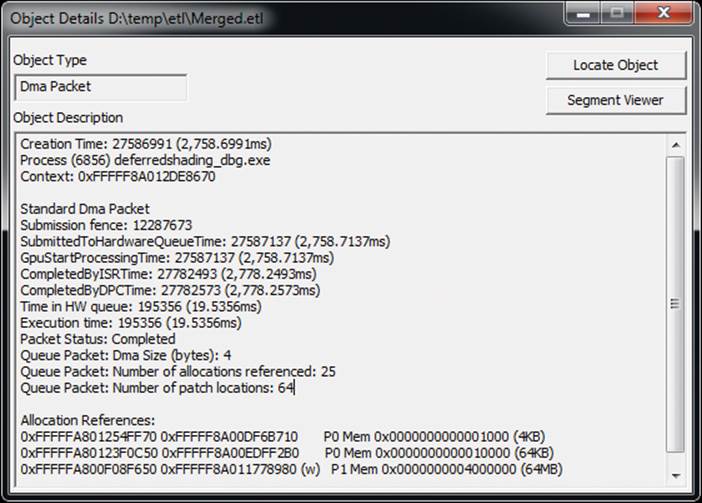
Figure 13.3: A packet dialog in GPUVIew
You can see a number of useful pieces of information in the dialog shown in Figure 13.3. First, we see several timestamps. The first is the packet creation time, which is the time that the command buffer was allocated (which is when the OpenGL would start filling it in). Next, we see theSubmittedToHardwareQueueTime, which is when the packet was sent to the hardware for processing. It is then picked up by the hardware at the time noted by GpuStartProcessingTime. When the GPU is done processing the packet, it triggers an interrupt, which is handled by an Interrupt Service Routine (ISR) — the time at which this interrupt is serviced by the ISR is shown in CompletedByISRTime. Next, the graphics subsystem processes the packet using a Deferred Procedure Call (DPC), and the time at which this completes is shown as CompletedByDPCTime. The total time between when the command buffer is submitted to the hardware (SubmittedToHardwareQueueTime) until the command buffer is completed and signals the ISR (CompletedByISRTime) is given by Time in HW Queue. This is effectively the amount of time it took the GPU to execute the command buffer, and the sum of these packets for a given frame places the upper limit on the frame rate of your application.
GPUView can show you quite a bit more information than this about your application’s use of the graphics processor. As your applications become more and more complex, they will start to exhibit behavior that only a tool such as GPUView can show you. The goal of performance tuning is twofold:
• Ensure that the GPU does as much work as it is able to by feeding it efficiently and not causing it to stall.
• Ensure that the work the GPU does contributes to the final scene and that it doesn’t do more than it needs to.
During the remainder of this chapter, we’ll use GPUView to analyze our applications and show the effects of the tuning advice we’ll give.
GPU PerfStudio 2
GPU PerfStudio 2 is a free tool provided by AMD that’s designed for the analysis of graphics applications written using OpenGL and other graphics APIs. GPU PerfStudio 2 supports three major modes of operation — an API trace tool, a frame debugger, and a frame profiler. The frame profiler requires AMD hardware to be present, but the API trace and the frame debugger, work well on hardware from any vendor. Figure 13.4 shows a screenshot of GPU PerfStudio’s API trace window running the displacement example from Chapter 8.
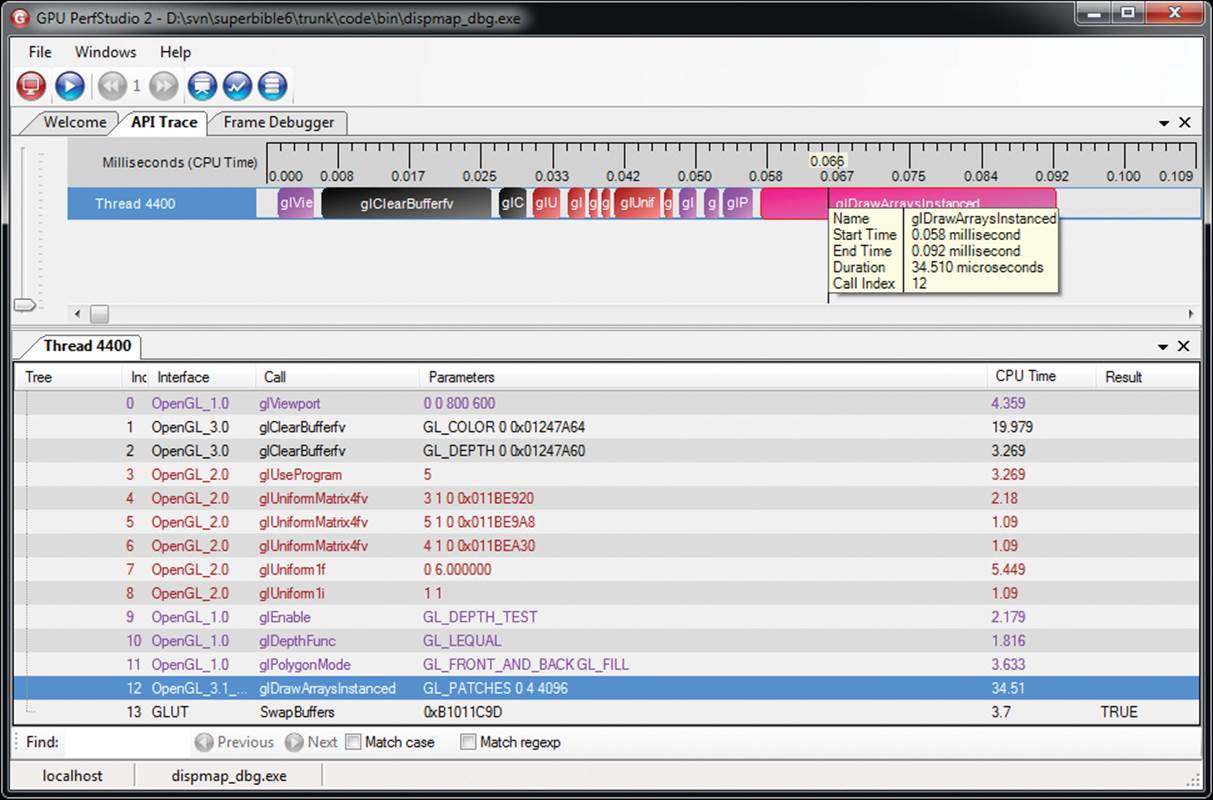
Figure 13.4: GPU PerfStudio 2 running the displacement mapping example
As you can see, the GPU PerfStudio has captured all of the OpenGL calls made by the application and has produced a timeline of the application making those calls. Along with each OpenGL command, the amount of CPU time taken to execute the call is shown in both the timeline and the function call list. The function call list also logs the parameters sent to each command. The frame debugger window of GPU PerfStudio 2 is shown in Figure 13.5 below.
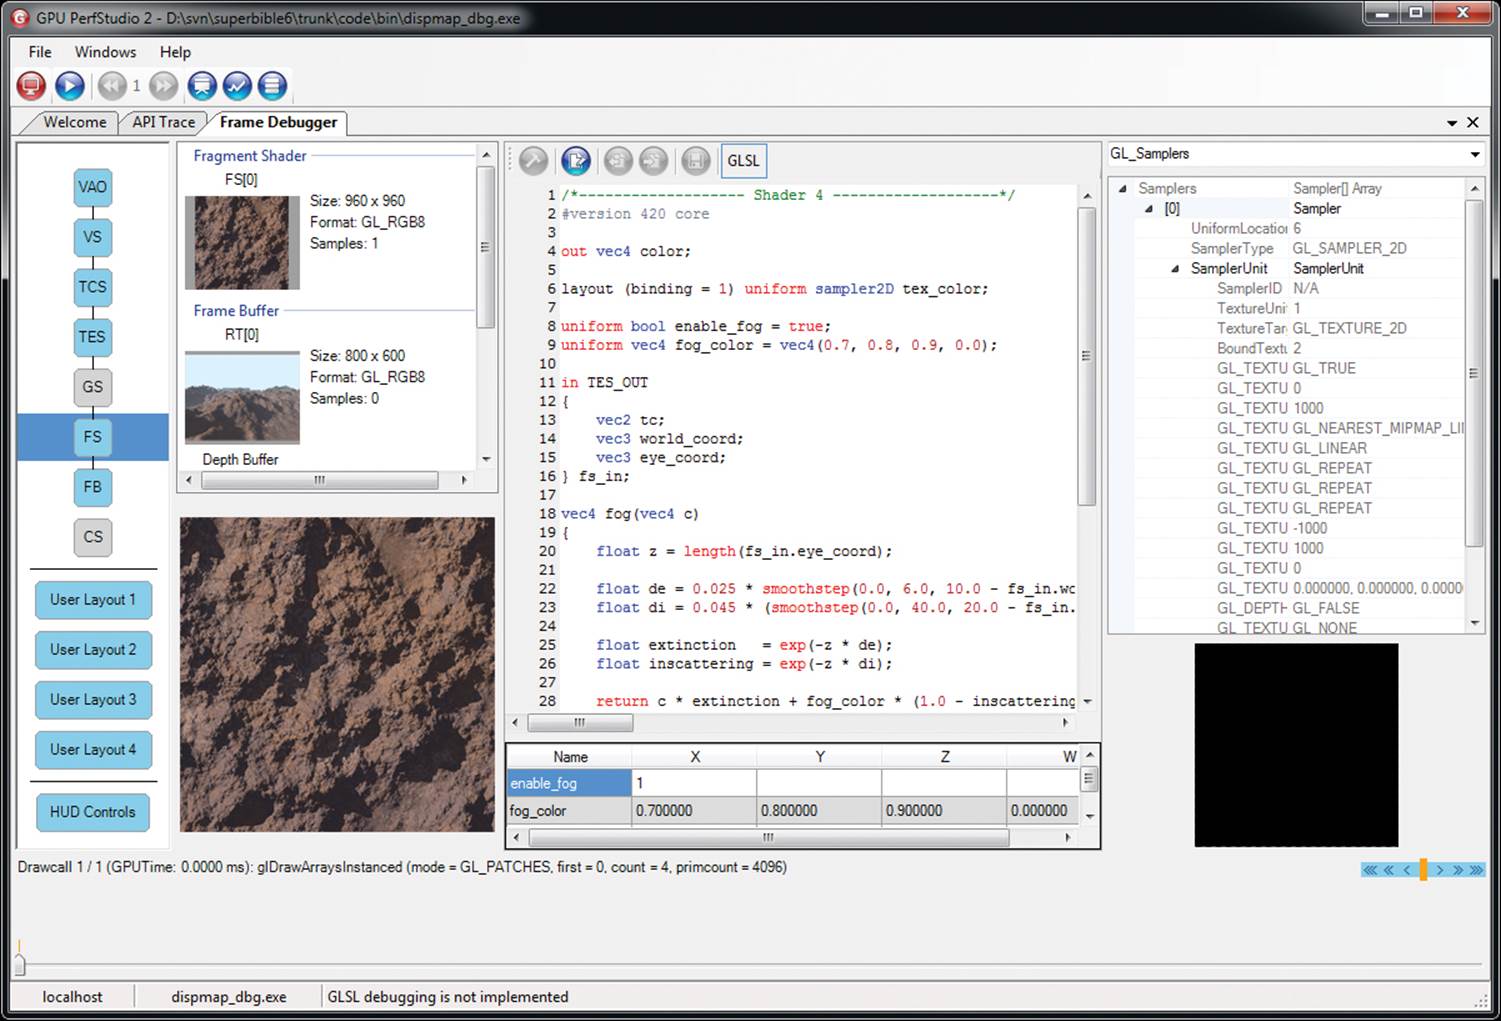
Figure 13.5: GPU PerfStudio 2 frame debugger
In the GPU PerfStudio 2 frame debugger, you can see the OpenGL pipeline with the vertex array object (VAO), vertex shader (VS), tessellation control and evaluation shaders (TCS and TES), fragment shader (FS), and framebuffer (FB) active in Figure 13.5. We also see that this particular drawing command is not using the geometry or compute shader stages (GS and CS). The fragment shader stage is selected, and in the main window, we see the source code of the current fragment shader along with the texture that’s bound for rendering.
Finally, in addition to being able to display information about the timing of drawing commands, the resources bound, and the code used for shaders, GPU PerfStudio is able to overlay data in your application. By clicking on the HUD Controls button in the frame debugger, we receive the window shown in Figure 13.6.
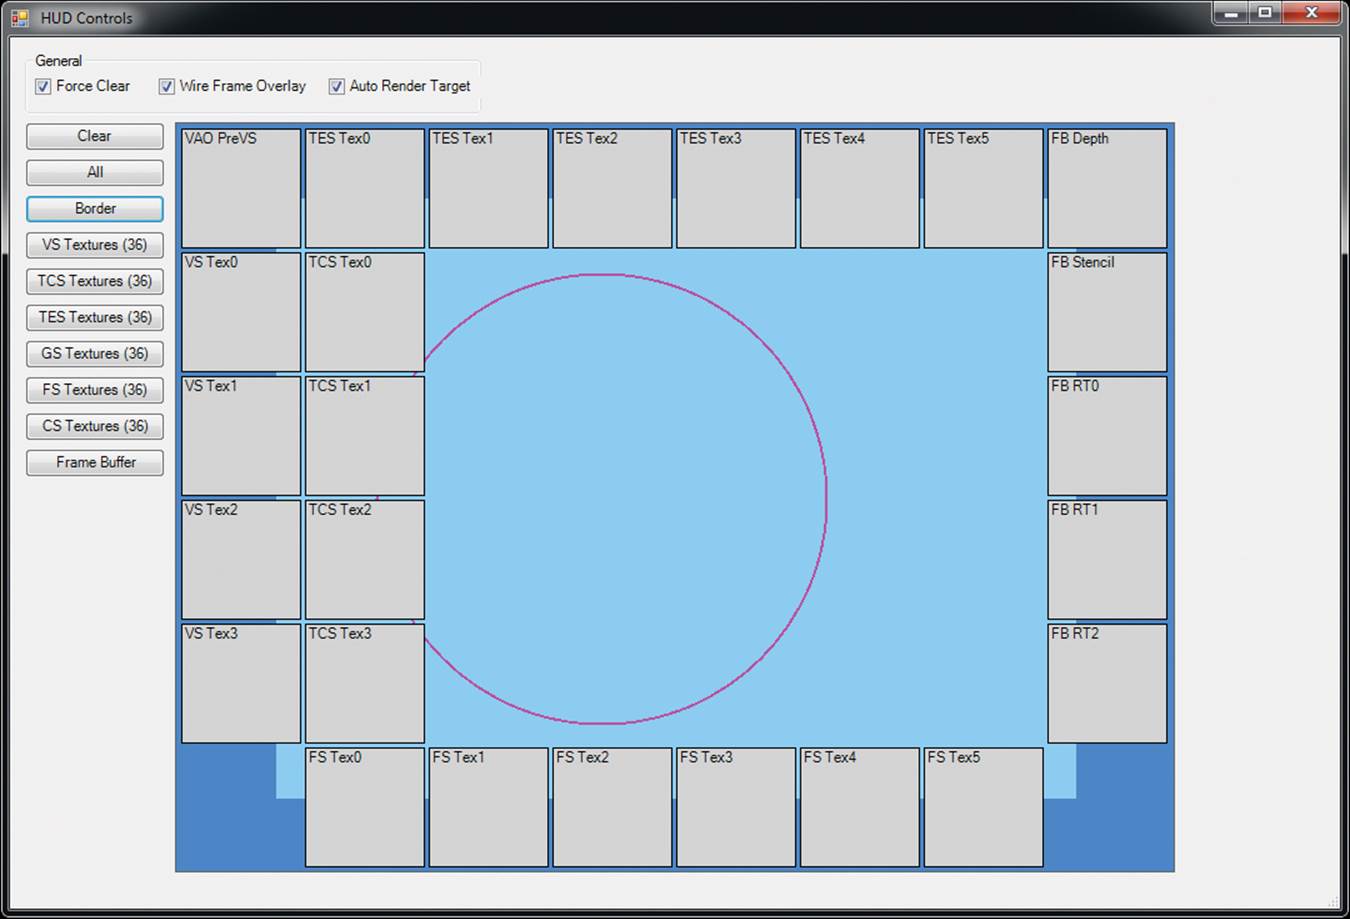
Figure 13.6: GPU PerfStudio 2 HUD control window
By using the HUD control window shown in Figure 13.6, we can select certain textures for viewing inside the application whenever the application is paused. A screenshot of the landscape example from Chapter 8 with the in-use textures is shown in Figure 13.7. You can see in the figure that at the top left, the height map used by the tessellation evaluation shader is visible. On the top right of the screenshot is the depth buffer (pure white because it’s been cleared to 1.0) and the content of the framebuffer. At the bottom left is the texture used by the fragment shader for shading the terrain.
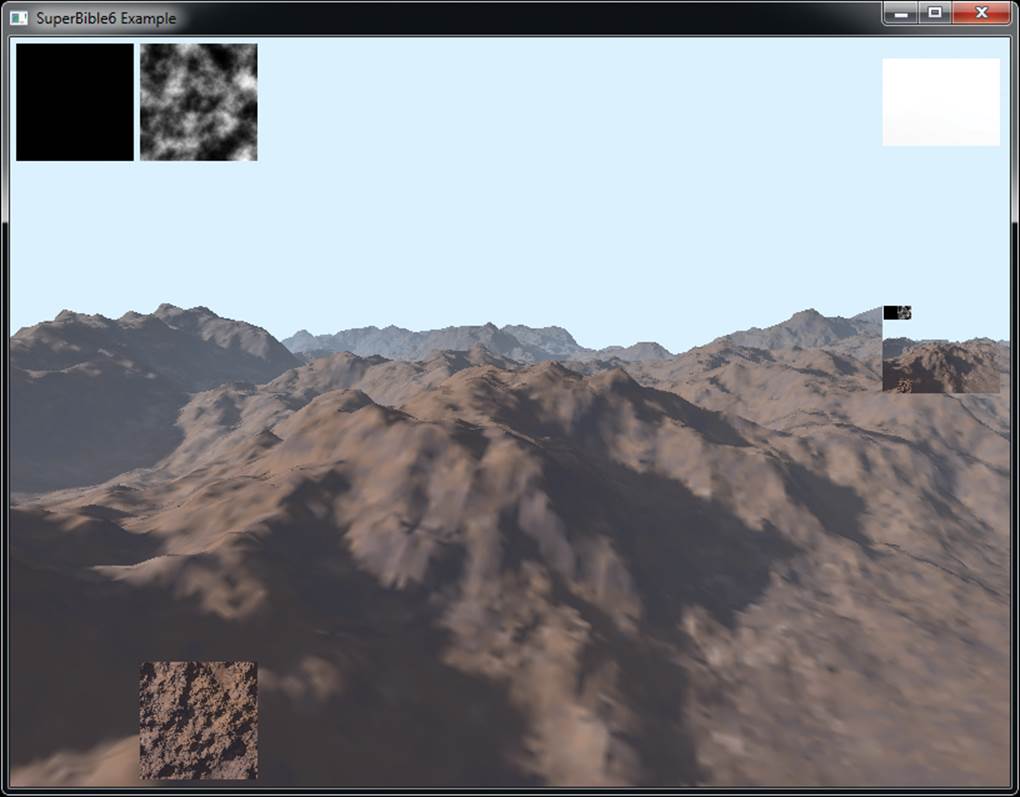
Figure 13.7: GPU PerfStudio 2 overlaying information
If you happen to have access to AMD hardware, GPU PerfStudio 2 can read a number of hardware performance counters from OpenGL to measure the impact of the drawing commands that your application makes. This includes measurements of things like primitives processed, the amount of texture data read, the amount of information written to the framebuffer, and so on. This feature is called the Frame Profiler, and a screenshot of GPU PerfStudio in this mode is shown in Figure 13.8.
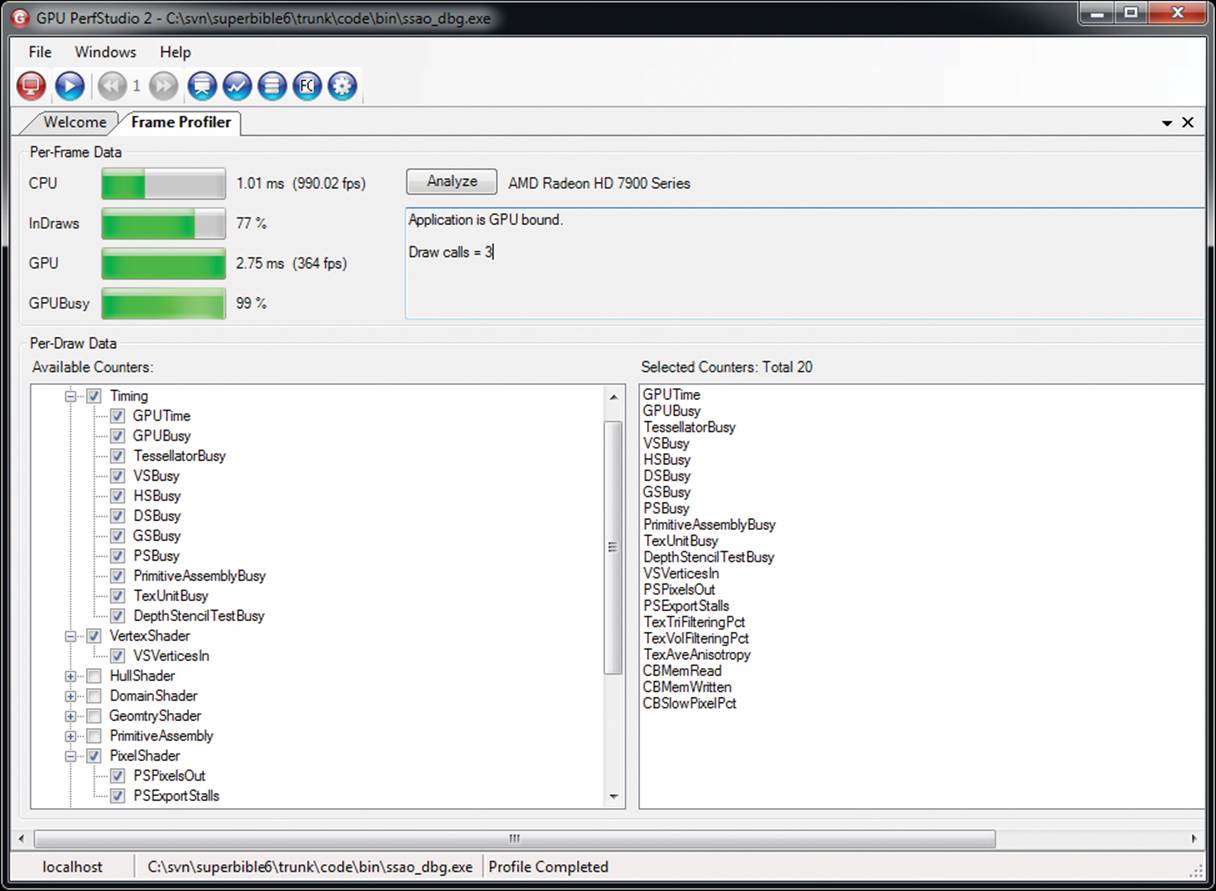
Figure 13.8: GPU PerfStudio 2 showing AMD performance counters
Because this mode isn’t universally available, we will leave it as an exercise for AMD users to explore this feature on their own. GPU PerfStudio 2 comes with some excellent help documentation and more is available online.
Tuning Your Application for Speed
In this section, we discuss a number of things that you can do to make sure that your application runs more efficiently, minimize the amount of work that the OpenGL driver needs to do, and maximizes the amount of work you can get from a GPU.
Reading State or Data from OpenGL
In general, reading state or data back from OpenGL into your application is not a great idea. If we can offer one piece of advice, it’s to not do anything that might stall the OpenGL pipeline. This includes reading the framebuffer using glReadPixels(); reading the results1 of occlusion queries, transform feedback queries, or other objects whose results depend on rendering; or performing a wait on a fence that is unlikely to have completed. In particular, it should never be necessary to call glFinish().
1. As noted in “Getting OpenGL to Make Decisions for You” back in Chapter 11, you can use conditional rendering to avoid reading the result of occlusion queries.
Furthermore, cases that might be less obvious can be avoided. For example, functions such as glGetError(), glGetIntegerv(), glGetUniformLocation(), and so on may not stall the GPU, but could well stall a multi-threaded driver and damage application performance. It’s best to stay away from functions that have the words “Get” or “Is” in their names. Also, while it should be common sense to not allocate and destroy objects frequently during the normal operation of your application, try to avoid generating names through the various “Gen” functions.
In cases where reading data from OpenGL back into client memory, there are ways to achieve this without stalling — most of which involve allowing the GPU to lag far enough behind your application that it’s almost certainly done gathering the information you need before you read it.
The first case we cover here is reading data from the framebuffer using glReadPixels(). If the intent is to use the resulting data for some other purpose in OpenGL, simply bind a buffer to the GL_PIXEL_PACK_BUFFER target, read pixel data into it, then bind the buffer to whichever target you want to use it with, and continue rendering. There is no reason for the pixel data to ever leave the graphics card’s memory or for the CPU to ever see it. If, however, you really must have the data in application memory, you can get at it in a number of ways.
First, and simplest, is simply to call glReadPixels() and pass the address of a region of your application’s memory into which OpenGL should place the data. In almost all cases, this will cause a bubble to form in the OpenGL pipeline. You can see the effect of this in Figure 13.9.
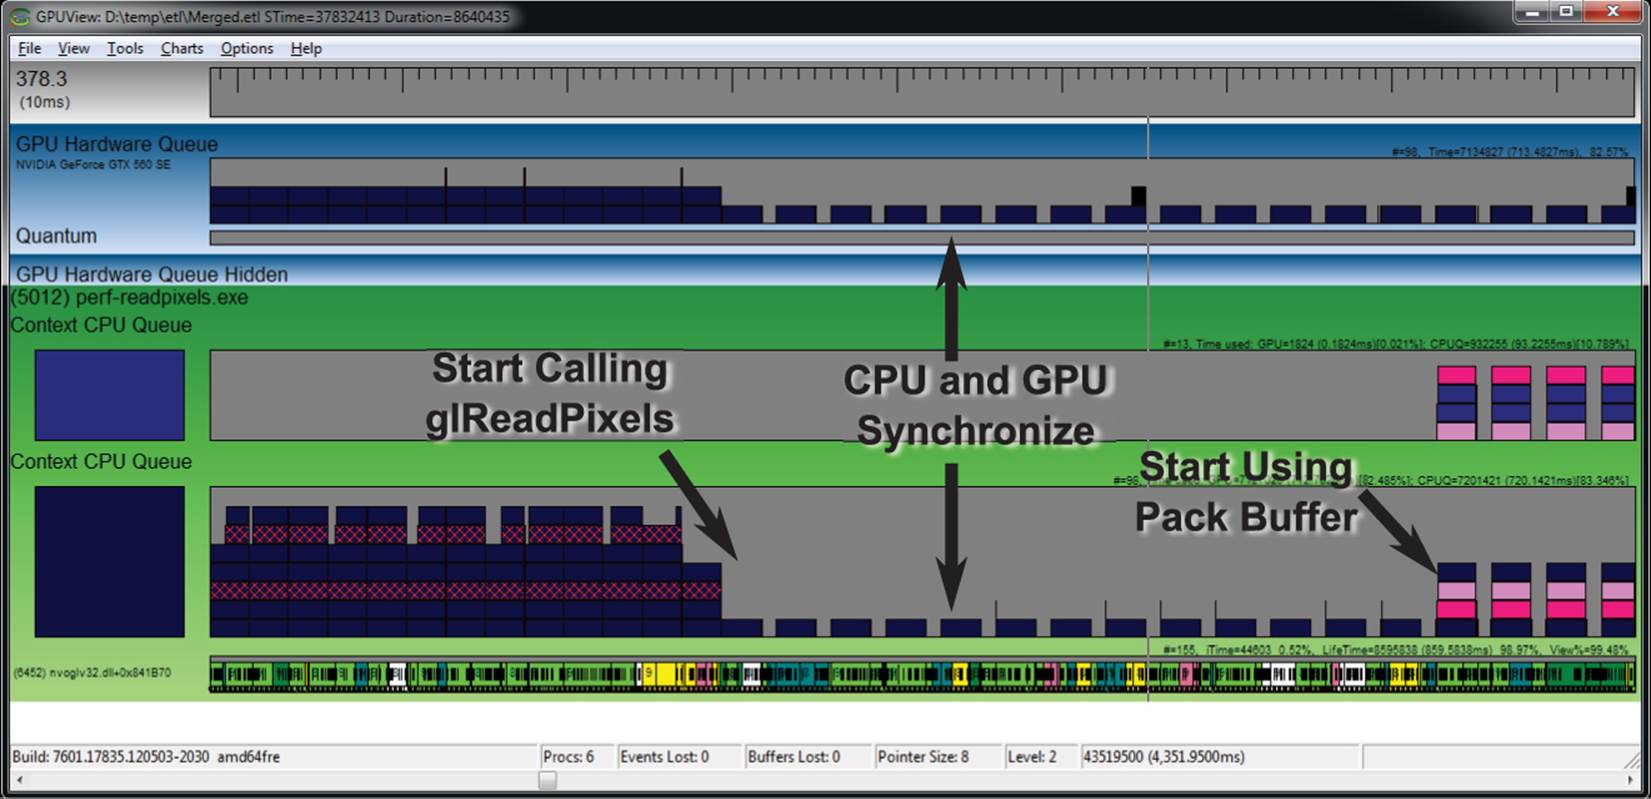
Figure 13.9: GPUView showing the effect of glReadPixels() into system memory
In Figure 13.9, the application starts by not calling glReadPixels() at all, and as you can see on the left of the capture, the GPU is nicely utilized, is not stalling, and always has at least one frame queued up ready to render. As soon as the application starts calling glReadPixels(), the CPU and GPU synchronize, and we can clearly see that the GPU is starving for work to do, with big gaps in its execution queue. Of course, we can bind a buffer to the GL_PIXEL_PACK_BUFFER target before calling glReadPixels() to retrieve data into a pixel pack buffer, which is what we’re doing towards the end of the trace in Figure 13.9. However, although there seems to be a significant change in activity, there are still gaps in the queue, which is not what we want at all.
What’s happening here is that we’re still calling glReadPixels(), but with a buffer bound to the GL_PIXEL_PACK_BUFFER target. This allows the GPU to complete rendering and then copy the resulting data into the buffer object without interruption. However, we then read the data back into the application by calling glMapBufferRange(). This means that our application has to wait for OpenGL to copy the data from the framebuffer into the buffer object before it can continue. This is even worse! Not only do we stall the GPU, but it actually does more work between each stall. Now take a look at Figure 13.10.
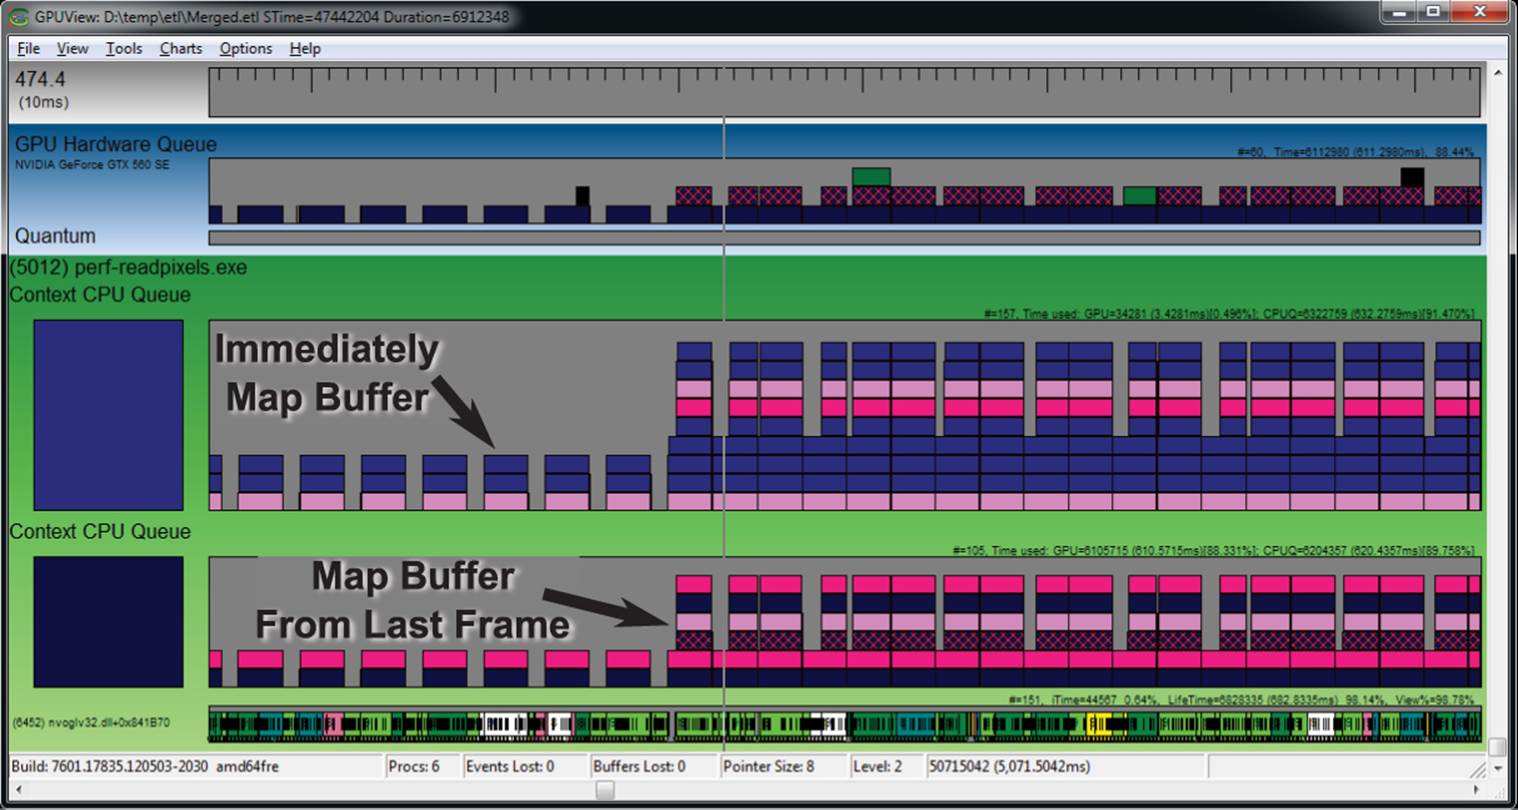
Figure 13.10: GPUView showing the effect of glReadPixels() into a buffer
In this new trace, we see something interesting going on. Again, at first, we continue to call glReadPixels() to get the data into the buffer object and then immediately map it in order to get the data into our application. This is causing stalls and inefficient use of the GPU. However, part way through Figure 13.10 we change our strategy to one where we still call glReadPixels() to transfer data from the framebuffer into a buffer object, but then map the buffer from the previous frame. We create multiple buffer objects, and because we only map buffers that haven’t been written to in at least one frame time, this gives the GPU more time to keep up with us. Although you can still see quite a bit of work going on, the GPU remains fully utilized, and the performance of our application is not significantly impacted.
Effective Buffer Mapping
Once you have a buffer object whose data store has been allocated using a call to glBufferData(), you can map the entire buffer into the application’s memory by calling glMapBuffer(). However, there are several caveats to the use of this function. First, if you only want to overwrite some part of the buffer, the rest of the buffer remains intact, meaning that OpenGL has to keep that data alive. Another is that the buffer itself could be quite large, and OpenGL could fail to find enough available address space to provide you with a single pointer to one contiguous region of memory representing the buffer. Finally, if you want to write into the buffer, OpenGL either has to wait until the GPU is done reading from it before giving you the pointer, or it must keep multiple copies of the data around, giving you a pointer to one of the copies that is not in use by the GPU.
To address these issues, we can use the glMapBufferRange() function, which allows you to only map part of the buffer into your application, and also provides several more flags that can be used to control how the data is mapped and how synchronization is performed with the rest of the OpenGL pipeline. The prototype of glMapBufferRange() is
void *glMapBufferRange(GLenum target,
GLintptr offset,
GLsizeiptr length,
GLbitfield access);
The target parameter is the buffer target to which the buffer you wish to map is bound, just as in the other buffer functions such as glMapBuffer() and glBindBuffer(). The offset and length parameters specify the range of the buffer that you want to map. Their units are bytes, with offsetzero being the first byte in the buffer and length being the size of the mapped range, in bytes. Besides being able to map a small part of the buffer, the additional power of glMapBufferRange() comes from the last parameter, access, which is used to specify a number of flags that control how the mapping is performed. Table 13.1 shows the possible bitfield values that can be passed in access.
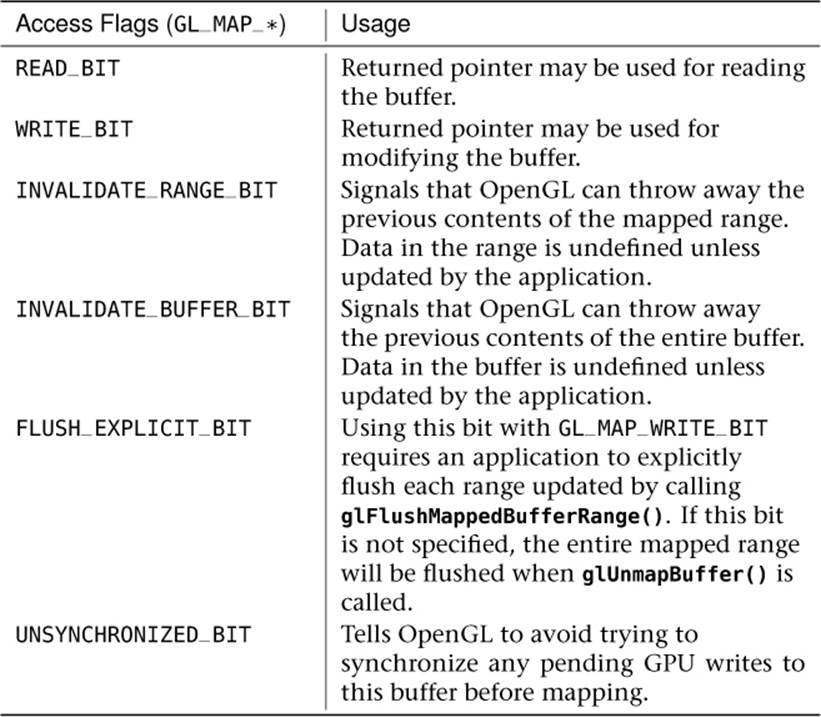
Table 13.1. Map Buffer Access Types
As you can see, glMapBufferRange() gives you quite a bit of control over how OpenGL performs the requested mapping operation. The GL_MAP_READ_BIT and GL_MAP_WRITE_BIT flags are pretty self-explanatory. Setting the read bit indicates that you wish to read from the buffer, and setting the write bit indicates that you want to write to it. They’re a bit more strictly enforced with glMapBufferRange() than the equivalent GL_READ_ONLY
All materials on the site are licensed Creative Commons Attribution-Sharealike 3.0 Unported CC BY-SA 3.0 & GNU Free Documentation License (GFDL)
If you are the copyright holder of any material contained on our site and intend to remove it, please contact our site administrator for approval.
© 2016-2026 All site design rights belong to S.Y.A.