Test Scoring and Analysis Using SAS (2014)
Chapter 3. Computing and Displaying Answer Frequencies
Introduction
One of the first steps in analyzing your multiple-choice tests is to display frequencies for each of the item choices. You can do this very simply using PROC FREQ. However, it is useful to see which of the answer choices is the correct answer, along with the frequency information. In this chapter, you will see several ways to accomplish this goal, including a SAS macro that automates the task. Finally, you will see how to display answer frequencies in graphical form.
Displaying Answer Frequencies (in Tabular Form)
To display the answer frequencies for your test, just run PROC FREQ, as demonstrated next:
Program 3.1: Using PROC FREQ to Display Answer Frequencies
title "Answer Frequencies";
proc freq data=score;
tables Ans1-Ans10 / nocum;
run;
PROC FREQ can produce one-way (row dimension), two-way (row by column), and three-way (row by column by page) frequency tables. You use a TABLES statement to specify the list of variables for which you want to compute frequencies. In this program, you are asking for frequencies for the 10 answer variables. NOCUM is an option on the TABLES statement—it indicates that you do not want cumulative frequencies or cumulative percentages. All statement options in SAS follow a slash, as demonstrated here. Partial output (frequencies for Ans1 and Ans2) from this program is displayed next:
Output from Program 3.1
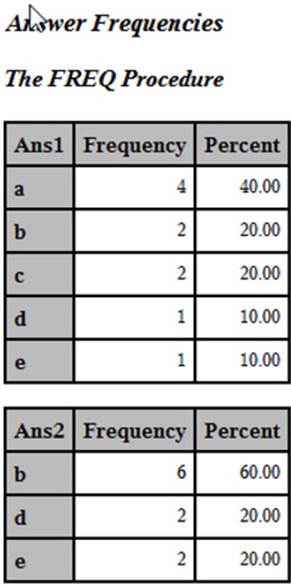
While this is useful, it would be helpful to identify the correct answer for each item in the frequency output. That is the subject of the next section.
Modifying the Program to Display the Correct Answer in the Frequency Tables
This section is primarily included for the interested SAS programmer. For those readers who simply want to use these programs to score and analyze tests, the ideas developed in this program are included in the collection of scoring and analysis macros described in Chapter 11.
The key to being able to display the correct answer in the frequency tables is to make the answer variables (Ans1-Ans10 in this example) two bytes long instead of one. To identify the correct answer for each item, you add an asterisk in the second byte of the correct answer for each item. This way, when you request answer frequencies, the correct answer is identified. Here is the program:
Program 3.2: Modifying the Program to Display the Correct Answer to Each Item
data score;
infile 'c:\books\test scoring\sample_test.txt' pad;
array Ans[10] $ 2 Ans1-Ans10; ***student answers;
array Key[10] $ 1 Key1-Key10; ***Answer Key;
array Score[10] 3 Score1-Score10; ***score array 1=right,0=wrong;
retain Key1-Key10;
if _n_=1 then input @11 (Key1-Key10)($1.);
input @1 ID $9.
@11 (Ans1-Ans10)($1.);
do Item = 1 to 10;
if Key[Item] eq Ans[Item] then do;
Score[Item] = 1;
substr(Ans[Item],2,1)='*';
***place an asterisk next to correct answer;
end;
else Score[Item] = 0;
end;
Raw=sum (of Score1-Score10);
Percent=100*Raw / 10;
keep Ans1-Ans10 ID Raw Percent;
label ID = 'Student ID'
Raw = 'Raw score'
Percent = 'Percent score';
run;
You define the 10 answer variables as two-byte character variables (the ARRAY statement does this). As you score the items, if the student answer matches the answer key, you use the SUBSTR function (on the left-hand side of the equal sign) to place an asterisk in the second position of the variable. Because this use of the SUBSTR function is somewhat esoteric, here is a more detailed explanation:
Normally, the SUBSTR function extracts substrings from an existing string. The first argument of this function is the string of interest, while the second and third arguments are the starting position and the length (optional) of the substring you want to extract, respectively. When used on the left-hand side of the equal sign, this function places characters in an existing string. The definition of the three arguments when the SUBSTR function is used on the left-hand side of the equal sign is identical to its normal usage, except now the string on the right-hand side of the equal sign is placed in the existing string with the appropriate starting position and length.
When you run PROC FREQ, the output displays the correct answer to each item. Below are the first two frequency tables produced by PROC FREQ:
Output from Program 3.2
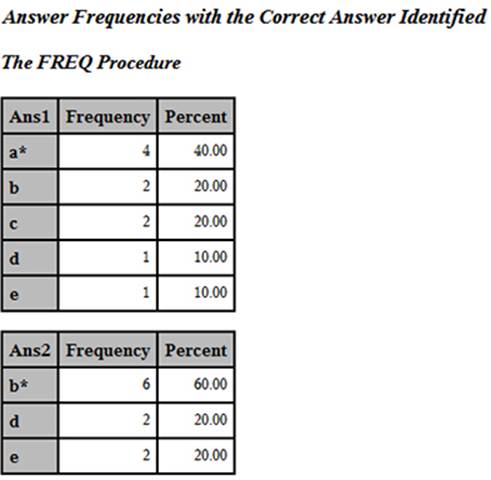
You now see the correct answer (indicated by the asterisk) for each item.
Developing an Automated Program to Score a Test and Produce Item Frequencies
The following macro scores a test consisting of an arbitrary number of items as well as computing answer frequencies. Here it is:
Program 3.3: Converting the Test Scoring Program into a Macro
%macro ans_freq(Dsn=, /*Name of the SAS data set you want to create */
File=, /*Name of the file containing the answer
key and the student answers */
Length_id=, /*Number of bytes in the ID */
Start=, /*Starting column of student answers */
Nitems= /*Number of items on the test */);
data &Dsn;
infile "&File" pad;
array Ans[&Nitems] $ 2 Ans1-Ans&Nitems; ***student answers;
array Key[&Nitems] $ 1 Key1-Key&Nitems; ***Answer Key;
array Score[&Nitems] 3 Score1-Score&Nitems; ***score array
1=right,0=wrong;
retain Key1-Key&Nitems;
if _n_= 1 then input @&Start (Key1-Key&Nitems)($1.);
input @1 ID $&Length_ID..
@&start (Ans1-Ans&Nitems)($1.);
do Item = 1 to &Nitems;
if Key[Item] eq Ans[Item] then do;
Score[Item] = 1;
substr(Ans[Item],2,1)='*';
***place an asterisk next to correct Answer;
end;
else Score[Item] = 0;
end;
Raw=sum (of Score1-Score&Nitems);
Percent=100*Raw / &Nitems;
keep Ans1-Ans&Nitems ID Raw Percent;
label ID = 'Student ID'
Raw = 'Raw score'
Percent = 'Percent score';
run;
proc sort data=&Dsn;
by ID;
run;
title "Student Scores";
proc print data=&Dsn label;
id ID;
var Raw Percent;
run;
title "Answer frequencies";
proc freq data=&Dsn;
tables Ans1-Ans&Nitems / nocum;
run;
%mend ans_freq;
To use this macro, you need to supply the name of the data set you want to create, the name of the text file containing the answer key and the student answers, the length of the ID, the starting column for the answer values, and the number of items on the test. This program assumes that the student ID starts in column 1. If this is not the case, it is a simple matter to replace the input pointer (@1) for the student ID to another value. One other feature of this program is the array Score, which holds the scored values for each item. It also sets the length of these numeric variables to three bytes (the minimum length allowed). This is OK because the value of these variables is either 0 or 1, so using three bytes instead of the default value of eight bytes saves some storage space and speeds up the processing a tiny bit. This is a minor point and you can leave the length of the score variables at eight if you wish.
Suppose you want to score a test where the raw data file is called sample_test.txt, stored in a folder called c:\books\test scoring. You have nine-digit ID numbers, the student answers start in column 11, and the test contains 10 items. The macro call looks like this:
*Calling the macro;
%ans_freq(Dsn=item_freq,
File=c:\books\test scoring\sample_test.txt,
Start=11,
Length_ID=9,
Nitems=10)
When you run this macro, you will obtain the same output as with the non-macro versions described earlier.
Displaying Answer Frequencies in Graphical Form
You may wish to see the frequency data in graphical form. This is easily accomplished by using PROC SGPLOT. PROC SGPLOT (SG stands for statistical graphics), along with several other SG procedures, became available with version 9.3 (and is included with Base SAS). Prior to this, you needed to license SAS/GRAPH software to produce graphical output.
You can request horizontal or vertical bar charts with HBAR or VBAR statements in PROC SGPLOT. However, because either one of these statements only allows you to plot a single variable, it would be tedious to request bar charts for all the items in a test (even if the test is relatively short). If you restructure the data set, you can make the PROC SGPLOT statements simpler. To help you understand this restructuring process, data set ITEM_FREQ is listed below:
Listing of Data Set ITEM_FREQ
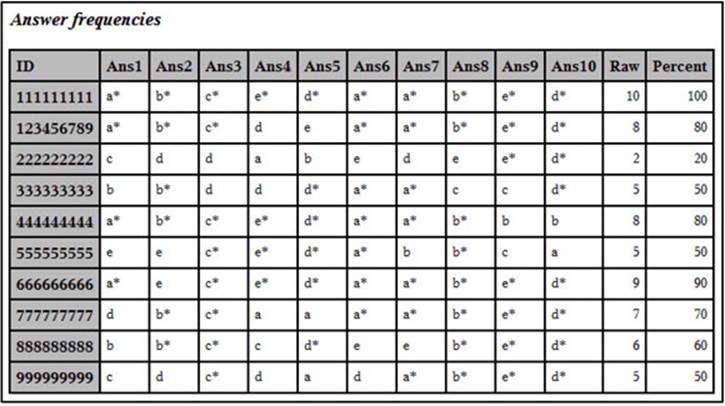
You want to restructure this data set so that each item choice is stored in a separate observation, along with the item number. For example, the first observation in the ITEM_FREQ data set looks like this:
ID Ans1 Ans2 Ans3 Ans4 Ans5 Ans6 Ans7 Ans8 Ans9 Ans10 Raw Percent
123456789 a* b* c* d e a* a* b* e* d* 8 80
You want the first few observations in the restructured data set to look like this:
Item Choice
1 a*
2 b*
3 c*
4 d*
5 e*
6 a*
7 a*
You can compute answer frequencies or create a bar chart of choices for each item if you include Item as a BY variable. The program to restructure the data set where one observation contains all of the items on the test to a data set with one observation per item is shown next:
Program 3.4: Restructuring the ITEM_FREQ Data Set to be Used in PROC SGPLOT
data item_choice;
set item_freq;
array Ans[10];
do Item = 1 to 10;
Choice = Ans[Item];
output;
end;
keep Item Choice;
run;
proc sort data=item_choice;
by Item;
run;
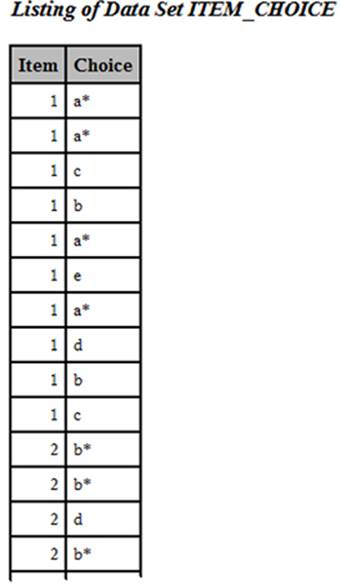
This program reads in one observation from data set ITEM_FREQ and writes out 10 observations in the ITEM_CHOICE data set, with variables Item and Choice. It is important to understand that the OUTPUT statement is inside the DO loop, giving you 10 observations in the ITEM_CHOICE data set for each observation in the ITEM_FREQ data set. If you want to use Item as a BY variable, you need the data set to be sorted by Item. That is the purpose of the final PROC SORT in this program. Here is a listing of the first few observations:
Listing of the First Few Observations in Data Set ITEM_CHOICE
You can now request bar charts using PROC SGPLOT as follows:
Program 3.5: Using PROC SGPLOT to Produce Bar Charts for Each Item
title "Answer Frequencies";
proc sgplot data=item_choice;
by Item;
hbar Choice;
quit;
Item is specified on the BY statement and Choice is specified on the HBAR statement. The result is a horizontal bar chart of Choice for each value of Item. The first plot looks like this:
Output from Program 3.5
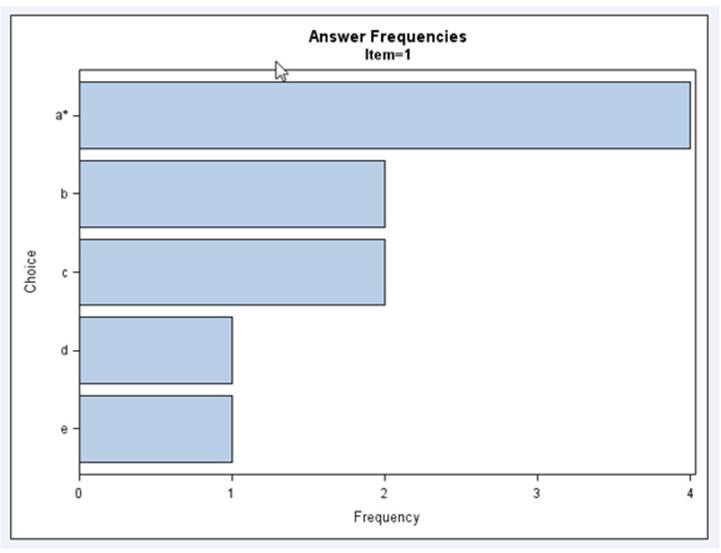
Here you see the answer frequencies for item one in graphical form. In Chapter 5, you will see how to combine answer frequencies with other item statistics, such as item difficulty and item discrimination scores, in a single table.
Conclusion
One of the first steps in evaluating multiple-choice items is to examine the frequency distribution of student responses. With a little innovative programming, you can flag the correct answer in your results. You may want to rewrite or re-evaluate items where too few students answered the item correctly. In addition, you may want to rethink the text of your distractors (the incorrect answer choices) when the frequencies for these choices are too low. Tabular output using PROC FREQ is probably the simplest and most useful way to display answer frequencies; however, you may prefer graphical output, as described in the last section of this chapter.
All materials on the site are licensed Creative Commons Attribution-Sharealike 3.0 Unported CC BY-SA 3.0 & GNU Free Documentation License (GFDL)
If you are the copyright holder of any material contained on our site and intend to remove it, please contact our site administrator for approval.
© 2016-2026 All site design rights belong to S.Y.A.