Go Forth and Do Data Science - Data Science from Scratch: First Principles with Python (2015)
Data Science from Scratch: First Principles with Python (2015)
Chapter 25.Go Forth and Do Data Science
And now, once again, I bid my hideous progeny go forth and prosper.
Mary Shelley
Where do you gofrom here? Assuming I haven’t scared you off of data science, there are a number of things you should learn next.
IPython
We mentionedIPythonearlierin the book. It provides a shell with far more functionality than the standard Python shell, and it adds “magic functions” that allow you to (among other things) easily copy and paste code (which is normally complicated by the combination of blank lines and whitespace formatting) and run scripts from within the shell.
Mastering IPython will make your life far easier. (Even learning just a little bit of IPython will make your life a lot easier.)
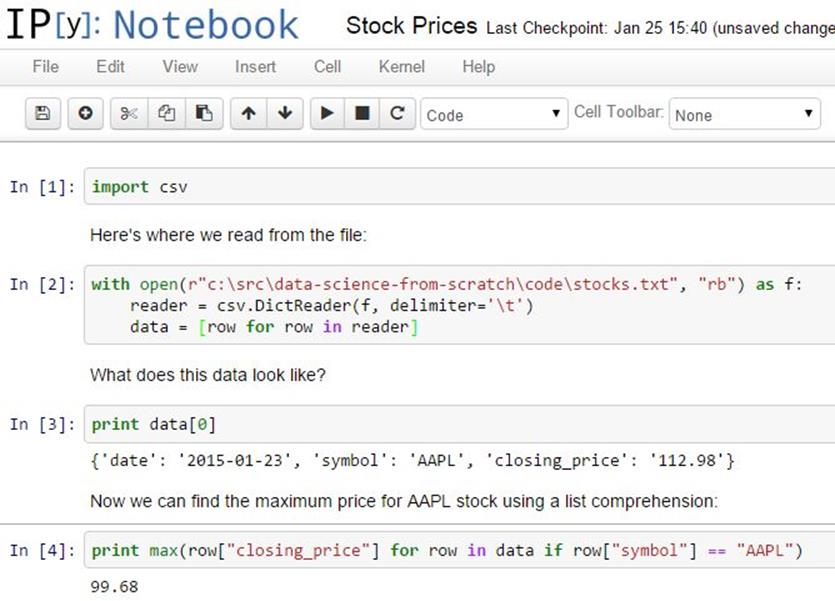
Additionally, it allows you to create “notebooks” combining text, live Python code, and visualizations that you can share with other people, or just keep around as a journal of what you did (Figure 25-1).
Figure 25-1.An IPython notebook
Mathematics
Throughout this book, we dabbledin linear algebra (Chapter 4), statistics (Chapter 5), probability (Chapter 6), and various aspects of machine learning.
To be a good data scientist, you should know much more about these topics, and I encourage you to give each of them a more in-depth study, using the textbooks recommended at the end of the chapters, your own preferred textbooks, online courses, or even real-life courses.
Not from Scratch
Implementing things “from scratch” is great for understanding how they work. But it’s generally not great forperformance (unless you’re implementing them specifically with performance in mind), ease of use, rapid prototyping, or error handling.
In practice, you’ll want to use well-designed libraries that solidly implement the fundamentals. (My original proposal for this book involved a second “now let’s learn the libraries” half that O’Reilly, thankfully, vetoed.)
NumPy
NumPy(for “Numeric Python”) provides facilities fordoing “real” scientific computing. It features arrays that perform better than ourlist-vectors, matrices that perform better than ourlist-of-list-matrices, and lots of numeric functions for working with them.
NumPy is a building block for many other libraries, which makes it especially valuable to know.
pandas
pandasprovidesadditional data structures for working with data sets in Python. Its primary abstraction is theDataFrame, which is conceptually similar to the NotQuiteABaseTableclass we constructed inChapter 23, but with much more functionality and better performance.
If you’re going to use Python to munge, slice, group, and manipulate data sets,pandasis an invaluable tool.
scikit-learn
scikit-learnisprobably the most popular library for doing machine learning in Python. It contains all the models we’ve implemented and many more that we haven’t. On a real problem, you’d never build a decision tree from scratch; you’d letscikit-learndo the heavy lifting. On a real problem, you’d never write an optimization algorithm by hand; you’d count onscikit-learnto be already using a really good one.
Its documentation containsmany, many examplesof what it can do (and, more generally, what machine learning can do).
Visualization
Thematplotlibcharts we’ve beencreating have been clean and functional but not particularly stylish (and not at all interactive). If you want to get deeper into data visualization, you have several options.
The first is to furtherexplorematplotlib, only a handful of whose features we’ve actually covered. Its website contains manyexamplesof its functionality and aGalleryof some of the more interesting ones. If you want to create static visualizations (say, for printing in a book), this is probably your best next step.
You should also check outseaborn, which is a library that (among other things) makesmatplotlibmore attractive.
If you’d like to createinteractivevisualizationsthat you can share on the Web, the obvious choice is probablyD3.js, a JavaScriptlibrary for creating “Data Driven Documents” (those are the three Ds). Even if you don’t know much JavaScript, it’s often possible to crib examples from theD3 galleryand tweak them to work with your data. (Good data scientists copy from the D3 gallery; great data scientistsstealfrom the D3 gallery.)
Even if you have no interest in D3, just browsing the gallery is itself a pretty incredible education in data visualization.
Bokehis a projectthat brings D3-style functionality into Python.
R
Although you can totally getaway with not learningR, a lot of data scientists and data science projects use it, so it’s worth getting at least familiar with it.
In part, this is so that you can understand people’s R-based blog posts and examples and code; in part, this is to help you better appreciate the (comparatively) clean elegance of Python; and in part, this is to help you be a more informed participant in the never-ending “R versus Python” flamewars.
The world has no shortage of R tutorials, R courses, and R books. I hear good things aboutHands-On Programming with R, and not just because it’s also an O’Reilly book. (OK, mostly because it’s also an O’Reilly book.)
Find Data
If you’re doing data science as part of your job, you’ll most likely get the dataas part of your job (although not necessarily). What if you’re doing data science for fun? Data is everywhere, but here are some starting points:
§ Data.govis the government’s open data portal. If you want data on anything that has to do with the government (which seems to be most things these days) it’s a good place to start.
§ reddit has a couple of forums,r/datasetsandr/data, that are places to both ask for and discover data.
§ Amazon.com maintains a collection ofpublic data setsthat they’d like you to analyze using their products (but that you can analyze with whatever products you want).
§ Robb Seaton has a quirky list of curated data setson his blog.
§ Kaggleis a site that holds data science competitions. I never managed to get into it (I don’t have much of a competitive nature when it comes to data science), but you might.
Do Data Science
Looking through data catalogs is fine, but the bestprojects (and products) are ones that tickle some sort of itch. Here are a few that I’ve done.
Hacker News
Hacker Newsis anews aggregation and discussion site for technology-related news. It collects lots and lots of articles, many of which aren’t interesting to me.
Accordingly, several years ago, I set out to build aHacker News story classifierto predict whether I would or would not be interested in any given story. This did not go over so well with the users of Hacker News, who resented the idea that someone might not be interested in every story on the site.
This involved hand-labeling a lot of stories (in order to have a training set), choosing story features (for example, words in the title, and domains of the links), and training a Naive Bayes classifier not unlike our spam filter.
For reasons now lost to history, I built it in Ruby. Learn from my mistakes.
Fire Trucks
I live on a major street in downtown Seattle, halfway between afire station and most of the city’s fires (or so it seems). Accordingly, over the years, I have developed a recreational interest in the Seattle Fire Department.
Luckily (from a data perspective) they maintain aRealtime 911 sitethat lists every fire alarm along with the fire trucks involved.
And so, to indulge my interest, I scraped many years’ worth of fire alarm data and performed asocial network analysisof the fire trucks.Among other things, this required me to invent a fire-truck-specific notion of centrality, which I called TruckRank.
T-shirts
I have a young daughter, and an incessantsource of frustration to me throughout her childhood has been that most “girls shirts” are quite boring, while many “boys shirts” are a lot of fun.
In particular, it felt clear to me that there was a distinct difference between the shirts marketed to toddler boys and toddler girls. And so I asked myself if I could train a model to recognize these differences.
Spoiler:I could.
This involved downloading the images of hundreds of shirts, shrinking them all to the same size, turning them into vectors of pixel colors, and using logistic regression to build a classifier.
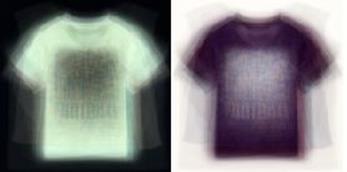
One approach looked simply at which colors were present in each shirt; a second found the first 10 principal components of the shirt image vectors and classified each shirt using its projections into the 10-dimensional space spanned by the “eigenshirts” (Figure 25-2).
Figure 25-2.Eigenshirts corresponding to the first principal component
And You?
What interests you? What questions keep you up at night? Look for a data set (or scrape some websites) and do some data science.
Let me know what you find! Email me atjoelgrus@gmail.comor find me on Twitter at @joelgrus.