Total Information Risk Management (2014)
PART 2 Total Information Risk Management Process
CHAPTER 10 TIRM Process Application Example
Abstract
This chapter demonstrates how the TIRM process can be applied in an industry using a fictitious case study of an energy utility company.
Keywords
Case Study; Application Example; Energy Utility
What you will learn in this chapter
![]() Learn from a fictitious case study of LightBulbEnergy Inc.
Learn from a fictitious case study of LightBulbEnergy Inc.
![]() An electricity utility company uses the TIRM process to assess information risks and evaluate an information technology investment
An electricity utility company uses the TIRM process to assess information risks and evaluate an information technology investment
Introduction
In this chapter, we present a full case study of how the TIRM process can be applied in the energy industry. It is a story about LightBulbEnergy Inc., an energy utility company that applies the TIRM process to understand the risks that arise from poor information quality and evaluate an IT investment that aims to mitigate the information risks. Note that this case study and the company are fictitious. Nevertheless, the case study represents a realistic example that draws on our experiences of applying the TIRM process in a number of different companies.
Stage A: Establish the context
Step A1: Set the motivation, goals, scope, responsibilities, and context of the TIRM process
A.1.1 Formulating the motivation for the TIRM process
LightBulbEnergy Inc. manages a vast amount of distributed physical assets as part of the electricity network. It requires huge investments on a regular basis to ensure that the electricity network runs smoothly. For optimal asset management, high-quality asset information is absolutely essential. A large proportion of the asset information is not reliable and suffers from many different data defects. For several years, LightBulbEnergy Inc. has observed the advances in information technologies in the areas of mobile geographic information systems (GISs), which can potentially improve the quality of asset information. While these new technologies promise many benefits, the implementation of them is a substantial commitment, financially and organizationally. Although being a national leader in the energy market, LightBulbEnergy Inc. is hesitant in adopting new technologies too quickly. A few years ago, the company decided to wait until the technologies had sufficiently advanced, being anxious to avoid investing prematurely. Today, the head of engineering believes that the time to invest in some modernizing technologies has come. In his opinion, the technologies together with the worldwide product identification standards have sufficiently matured to make an investment worthwhile. He feels that missing out on the chance of investing now would be a strategic error. The CFO of the company, however, remains very skeptical. He would only be convinced if he can see sufficient evidence that the benefits will exceed the costs and implementation risks of the investment. Listening to the debate between the CFO and the head of engineering, the CIO suggests applying the TIRM process to establish the impact of the (potentially) improved asset information quality of the planned investment. She believes that the executive board can make a better-informed management decision by understanding what the impact of not having availability to the new technology-driven information could be. The head of engineering and the CFO are both happy to proceed with the idea suggested by the CIO.
A.1.2 Defining the goals of the TIRM Process
The CIO also convinces the other members of the executive board who agree to implement the TIRM process to evaluate the planned investment in more detail. Moreover, the CIO is curious as to whether there might be any other information treatments that could help the company cope with existing information risks. The goals of the TIRM process are summarized by trying to address two particular questions:
1. Should the company invest in a mobile GIS?
2. What other information risk treatments could be of high value to the organization?
A.1.3 Defining the scope of the TIRM process
It is decided that the scope of the TIRM process should be limited to the power distribution part of the organization. From the very beginning, it was clear that the TIRM process should focus on risks that arise from poor asset information. As there are only a limited amount of resources available for implementing the TIRM process, it is decided that the process should focus only on business processes that are expected to be most substantially affected by the planned changes in GIS technology. It is recommended that TIRM process facilitators should determine the most affected business processes by interviewing managers from different divisions in the organization. Moreover, they should find out which information resources and information quality dimensions could potentially be affected by the change in technologies. These activities are planned as part of investigating the information environment.
A.1.4 Defining the responsibilities for the TIRM process
The head of engineering offers to become the sponsor of the TIRM program, as he is the executive who is most keen to see the investment being realized. He suggests that the CIO and CFO join him in the TIRM steering council, and it is agreed that the head of engineering takes on the leadership of this council. Both the CFO and the CIO are happy to participate, but have different reasons for doing so: the CFO because he would like to ensure, with his presence, that the analysis is done objectively, and the CIO, because she thinks that the results from the TIRM program will provide a great opportunity for the IT department to engage with the rest of the business and to generate tangible business results for the entire enterprise. Moreover, she hopes that applying the TIRM process will generate valuable insights about the business for IT and might help to push the new GIS initiative through, which would be a major project for the IT function.
Two weeks later the steering council convenes for a kickoff meeting to define the details of the TIRM program. Beforehand, the CIO was asked by the head of engineering to identify the most suitable manager from her IT department to lead the TIRM initiative operationally. The CIO therefore brings Bill Mighty to the meeting, who is an experienced IT project manager. He proposes that Bill becomes the TIRM process manager. After a quick introductory conversation, the three steering council members agree that Bill, who has experience in data governance, manufacturing IT, and risk management, is the appropriate person for the position of the TIRM process manager. They also agree that there should be three TIRM process facilitators to assist Bill in implementing the TIRM process, and that one should be chosen by each member of the TIRM steering council. It is decided that the TIRM managing committee that is responsible for the implementation of the process should consist of the three TIRM process facilitators and be led by the TIRM process manager. Moreover, two employees from the IT department are chosen to act as the IT system and database representatives.
A.1.5 Defining the context of the TIRM process
The third issue that is discussed in the kickoff meeting of the steering council is how the TIRM process should be integrated within the organization. As the primary reason for implementing the TIRM process is to evaluate an IT investment, the CFO suggests that the TIRM process should be run under the organizational umbrella of an investment evaluation project. The steering council members suggest that the most important information risks should be reported to the enterprise risk officer. In the event that the TIRM process would be further used, independent of any particular investment project, after project completion, it would be evaluated to extend the TIRM process to an independent enterprise-wide program.
Step A2: Establish the external environment
LightBulbEnergy Inc. competes in an energy utility market that is fully privatized. The regulation in the market determines the prices that are allowed to be charged to the consumers and the quality of service that has to be delivered. It also sets high requirements regarding environmental protection and health and safety. Usually, one energy company dominates a particular regional market and is a less dominant player in other regions. Expansion often occurs through mergers and acquisitions.
Step A3: Analyze the organization
A.3.1 identify the business model
The business model of the company is fairly simple: producing electricity and distributing it to end consumers and business consumers.
A.3.2 Identify business processes
The project manager invites the business process modeling group leader to the first TIRM managing committee meeting to help identify which business processes could benefit most from the mobile GIS technologies. Together, they identify the following three most affected business processes:
1. Incident management
2. New connections
3. Capital asset replacement/refurbishment
A.3.3 Identify the organizational structure
There are three main business units: energy production, energy distribution, and general IT and management services.
A.3.4 Identify the organizational culture
LightBulbEnergy Inc. is proud of its engineering tradition, having been able to provide its clients with reliable energy for over six decades. It places an emphasis on cutting-edge energy generation technologies and owns numerous patents created by its employees. The different departments have very different cultures and therefore they often build silos and do not exchange enough information. There is often mistrust by the engineering staff at different local sites of the managers who are based in the headquarters several hundred miles away from other offices; they often impose changes that are not reasonable from the perspective of the technical personnel. The culture at LightBulbEnergy Inc. is very much engineering oriented, but information management is not a popular topic in the company, as it is often associated with staff being made redundant through automation. The approach to information management is therefore quite ad-hoc. Moreover, some staff are suspicious of new information technologies, fearing that they might not be able to cope with the new technologies or that their job roles will be replaced by technology.
Step A4: Identify business objectives, measurement units, and risk criteria
By analyzing the corporate mission and interviewing senior leadership, the TIRM process facilitators identify three core business objectives that the organization aims to achieve and propose them to the TIRM steering council. Together with the TIRM steering council, the following business objectives, measurement units, and risk criteria were chosen:
1. Operate the Business in a Cost-effective Manner
Short name: Cost effectiveness
Measurement unit: Lost USD yearly
Risk criteria:
|
Very high |
Above $5 million |
|
High |
Above $1 million and up to $5 million |
|
Medium |
Above $0.5 million and up to $1 million |
|
Low |
Above $0.1 million and up to $0.5 million |
|
Very low |
Below or equal to $0.1 million |
2. Provide Reliable Services to the Customer
Short name: Service reliability
Measurement unit: Number of hours of service disruptions per client and per year
Risk criteria:
|
Very high |
Above 2 million hours |
|
High |
Above 500,000 and up to 2 million hours |
|
Medium |
Above 100,000 and up to 500,000 hours |
|
Low |
Above 10,000 and up to 100,000 hours |
|
Very low |
Below or equal to 10,000 hours |
3. Always Operate Safely and Take Care of the Environment
Short name: Safety and environment
Measurement unit: Custom scale measuring the damage in points:
>10,000 points: Very high impact. A number of employees get seriously injured or die in work accidents. There is a major fire or another type of major public accident in which members of the public get seriously injured or killed, or a large number of properties get damaged. A hospital or another critical building has no electricity supply. A major pollution or damage to the natural environment.
1000–9999 points: High impact. One or more employees get seriously injured or die in a work-related accident. There is a fire or another type of major public accident in which members of the public get injured, or a number of properties get damaged. Major inconvenience for the public (e.g., causing a large traffic jam). A significant pollution or damage to the natural environment.
100–999 points: Medium impact. One or more employees get injured or nearly injured in a work-related accident. A public accident is caused in which members of the public could have gotten potentially injured, or a number of properties could have gotten potentially damaged. Medium inconvenience for the public. A medium pollution or damage to the natural environment or a medium noncompliance to natural protection laws.
1–99 points: Low impact. Smaller noncompliance with health and safety. Minor inconvenience for the public. Minor noncompliance to natural protection laws.
0–0.9 points: Very low impact, nonsignificant.
Risk criteria:
|
Very high |
Above 10,000 points |
|
High |
Between 3000 and 9999 points |
|
Medium |
Between 1000 and 2999 points |
|
Low |
Between 100 and 999 points |
|
Very low |
Below 99 points |
Step A5: Understand information environment
As part of this step, the TIRM process facilitators analyze a map of the IT systems landscape at LightBulbEnergy Inc. and identify for each business process whether or not an IT system is used. Moreover, they preliminarily identify information quality problems from the perspective of the IT department. To understand the information environment, the TIRM process facilitators organize meetings with the two IT system and database representatives of LightBulbEnergy Inc. The results from this investigation are summarized in the following subsections.
A.5.1 Understand relevant IT systems and databases
Four key IT systems in the scope of the process application were identified and analyzed with the IT system and database representatives:
• Geographical information system (GIS)
• Maintenance planning (MP) system
• Customer relationship management (CRM) system
• Enterprise resource planning (ERP) system
Each IT system runs on a separate database. The TIRM process facilitators collect information flow diagrams that were created by the IT department. An example is shown in Figure 10.1.
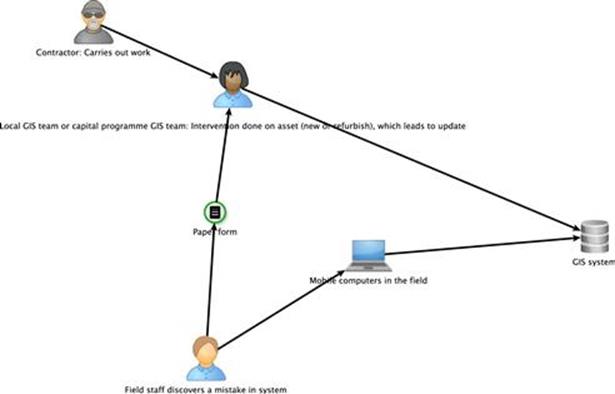
FIGURE 10.1 Information flow diagram example.
Existing models of the enterprise architecture do exist, but they show the interrelationship between IT systems and business processes only at a very high level. The TIRM management committee thinks that an improved modeling of the enterprise architecture, although reasonable in the future, would exceed the planned budget for the TIRM process. The high-level model is used as an orientation point without going into further detail.
A.5.2 Understand relevant information management processes
Currently, a large proportion of infrastructure asset data in the company is captured and updated manually. As part of step A5, the company has organized an information quality management maturity assessment by interviewing IT and data managers and information users, using a questionnaire that evaluates the level of maturity in 13 process areas, as shown in Figure 10.2. The results indicate that the company fulfills the criteria for maturity level 2, but only partially fulfills for maturity level 3 or higher. LightBulbEnergy Inc. has well-defined basic management processes (e.g., for information needs analysis, information storage management, and access control management), but when it comes to managing information quality itself, it does not have formalized business processes.
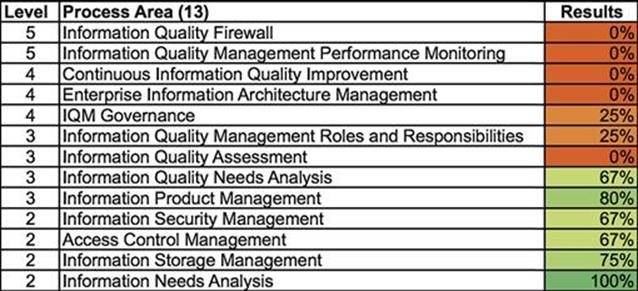
FIGURE 10.2 Information quality management maturity.
A.5.3 Investigate potential information management and information quality issues
A preliminary list of information quality issues has been created by the TIRM process manager by interviewing IT and database representatives and based on existing data profiling results (Table 10.1).
Table 10.1
Preliminary List of Information Management Issues
|
Issue No. |
Known Information Quality Issue |
|
1 |
Asset missing in GIS |
|
2 |
Asset location inaccurate |
|
3 |
Asset location inconsistent |
|
4 |
Asset location difficult to interpret |
|
5 |
Wrong classification of asset type on GIS |
|
6 |
Asset size is incorrect or missing |
|
7 |
Asset age is incorrect or missing |
|
8 |
Missing information on past rehabilitation |
|
9 |
Condition assessment is out of date or missing |
|
10 |
Performance is not using the right factors or is out of date or missing |
|
11 |
Inaccurate or missing material information |
Stage B: Information risk assessment
After having established the context, the TIRM steering council decides to move on to the information risk assessment stage. The TIRM process manager organizes a one-day workshop for each business process with the TIRM process facilitators and the previously chosen business process representatives for steps B1 to B8. The results of each workshop are described in the following commentary, for each of the business processes separately. The output of the workshops is then used for information risk evaluation in step B9, which is done during only one workshop for all business processes.
Business process 1: Incident management
Step B1: Analyze tasks in each business process
The incident management process reacts to power outages, health and safety issues, and other failures in the electricity network that require immediate attention (Figure 10.3). Approximately 1000 times per month on average, a customer reports an incident to the customer service center of LightBulbEnergy Inc. For each of the incident reports, a decision has to be made if further resources should be allocated to investigate and resolve it. In most cases, it is not a real incident or it is connected to an issue that is already known; the reported incident may not appear to have been recorded or many customers telephoning to report supply problems will be affected by incidents that have already been recorded. However, roughly 300 times per month on average, a reported incident requires further investigation or action.
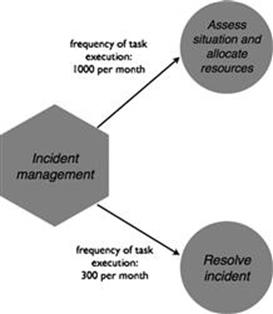
FIGURE 10.3 Incident management process.
Step B2: Examine information needed for each task
In this step, only information related to the GIS is considered, as decided in the scoping of the TIRM process in step A1. Half of the incidents that are reported to the customer service center are not actually related to the electricity network; an example would be a short circuit fault in a household. In such an instance, the customer is told that the responsibility does not lie with the company. However, each time the incident is related to the electricity network (approximately 50% of the reported incidents), further information is needed that is used to assess the situation and allocate resources, as shown in Figure 10.4. One piece of information is about current maintenance and repair activities that take place in the electricity network that prevents field staff being sent out twice. Often, LightBulbEnergy Inc. is already aware of the problems that are reported and help has already been scheduled. Moreover, information about known problems in the network is required to be able to inform the customer that the problem has already been taken care of and, usually, no further resources have to be allocated.
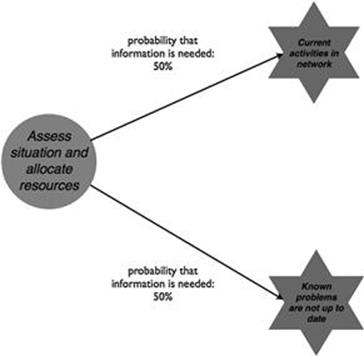
FIGURE 10.4 Information needs for incident management, part 1.
Once an incident has been assigned to the field engineers or a special task force, three pieces of information are always an essential input to resolve the issue, as illustrated in Figure 10.5. Information about ongoing repairs and maintenance activities in the network problems are important since sometimes a repair has to wait until another activity is finished. Information about the asset location is needed as the faulty asset needs to be found to be fixed. Also, information about asset properties is key to make the right decision about asset replacement and repairs, and to take the necessary safety precautions.
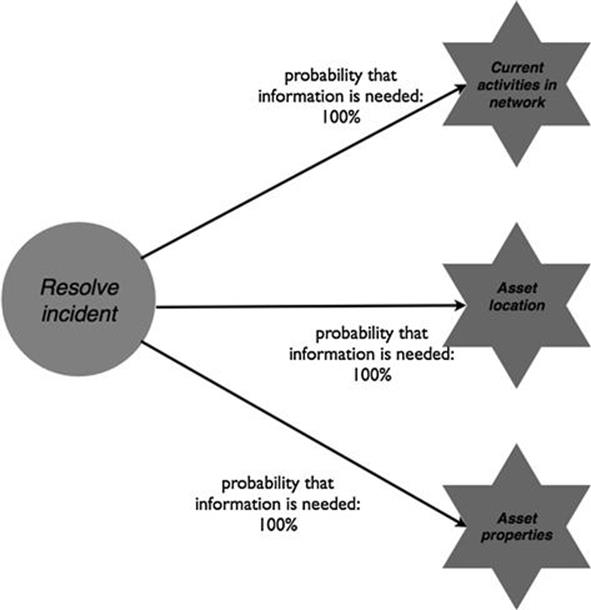
FIGURE 10.5 Information needs for incident management, part 2.
Step B3: Identify information quality problems during task execution
The business process representatives for incident management identify a number of information quality problems that appear in the business process, as shown in Figure 10.6. Information about ongoing maintenance and repair activities in the electricity network are not always shared by the field engineers and, therefore, in 5% of cases is incomplete when used for one of the two tasks in the process. Also, one in ten problems that engineers are aware of are not kept up to date in the IT systems.
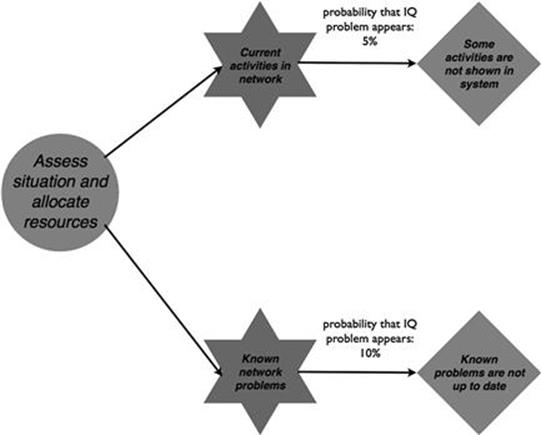
FIGURE 10.6 Information quality problems in the incident management process, part 1.
For resolving the incident (Figure 10.7), the same information quality problem occurs when it comes to current activities in the electricity network—that is, 5% of the activities are not displayed in the IT system. Also, information about the asset location is often incorrect; in fact, this includes approximately 20% of the data. Moreover, in half of the cases, when the engineer needs the information about asset location and information about asset properties, it cannot be accessed, because the engineer is out in the field and does not have connection to the IT system.
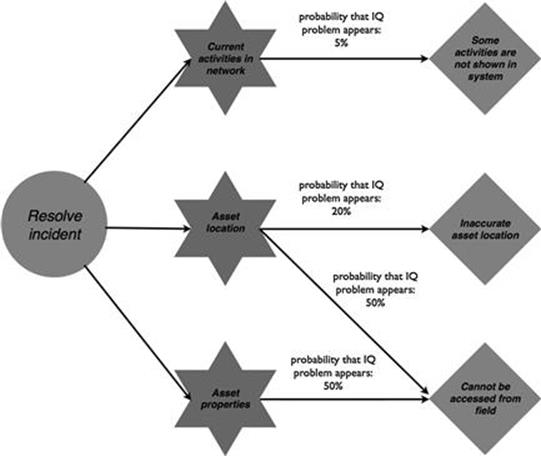
FIGURE 10.7 Information quality problems in the incident management process, part 2.
Step B4: Identify consequences of information quality problems
Both information quality problems in the assess situation and allocate resources task can lead to the same direct consequence—that a poor decision is made to send out field resources, as shown in Figure 10.8. Because of the poor information on current activities in the network, the customer service center is not aware that there are already ongoing maintenance activities taking place or the problem is already known. The intermediate consequence is that several engineers might be working on the same issue and be unaware of each other, which can lead to time and materials that are wasted and even to potential health and safety issues.
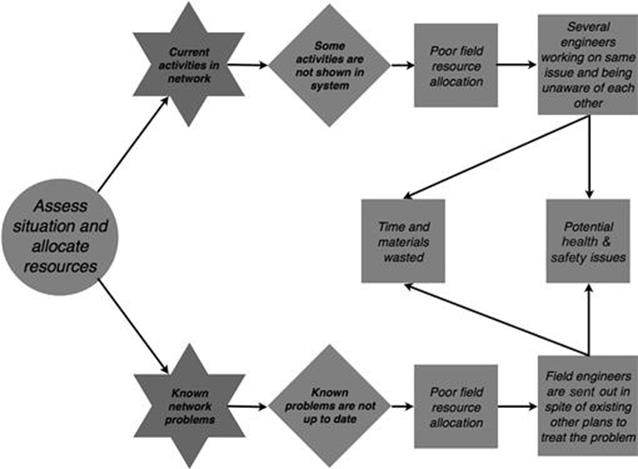
FIGURE 10.8 Consequences in the incident management process, part 1.
When the customer service center is unaware that a reported problem is already known and that there might be plans in place to tackle the problem, again field resources are sent out unnecessarily. In some cases, a known problem might, for example, require special protective equipment and is therefore not addressed straight away because it takes time to obtain that special equipment. Being unaware of this, the customer service center might send out a field resource without the right equipment, which can lead to potential health and safety issues.
The second task to resolve the incident has three potential direct consequences of information quality problems, as shown in Figure 10.9. When a field engineer is not aware of ongoing activities in the electricity network that might affect his or her work, there might be problems regarding health and safety. Incorrect asset location information leads to time and resources being wasted to find the right location of the asset. When asset location or asset properties information is needed in the field, it cannot be accessed, and therefore, the engineer has to drive back to the office to print out the information. In both cases, the repair can take longer, which can lead to a lengthier disruption of service. Moreover, occasionally the incident might cause hazards for people and the environment, therefore a longer repair time creates a higher exposure to risk in terms of health and safety.
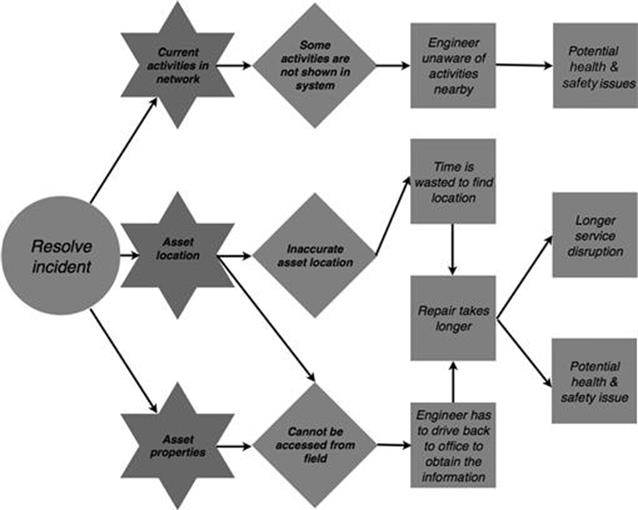
FIGURE 10.9 Consequences in the incident management process, part 2.
Step B5: Identify for each consequence the business objectives that are affected
In this step, the impact of each consequence on the business objectives identified in step A3 is identified. Figure 10.10 shows which business objectives are affected by poor information quality in the assess the situation and allocate resources task. The consequence of time and materials being wasted has an impact on the business objective of cost effectiveness, whereas the consequence of potential health and safety issues has an impact on the business objective of safety and environment.
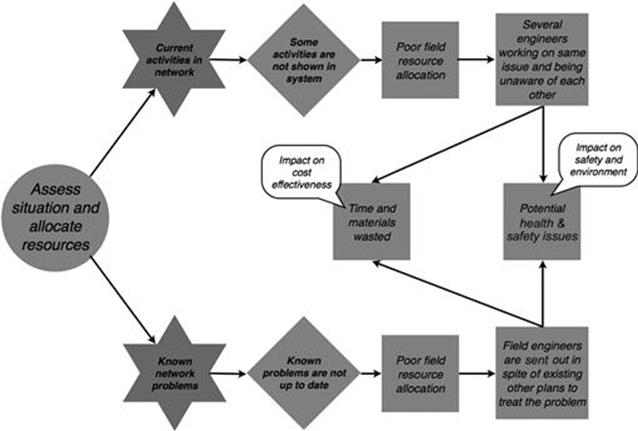
FIGURE 10.10 Affected business objectives in the incident management process, part 1.
Figure 10.11 shows which business objectives are affected by poor information quality in the resolve incident task.
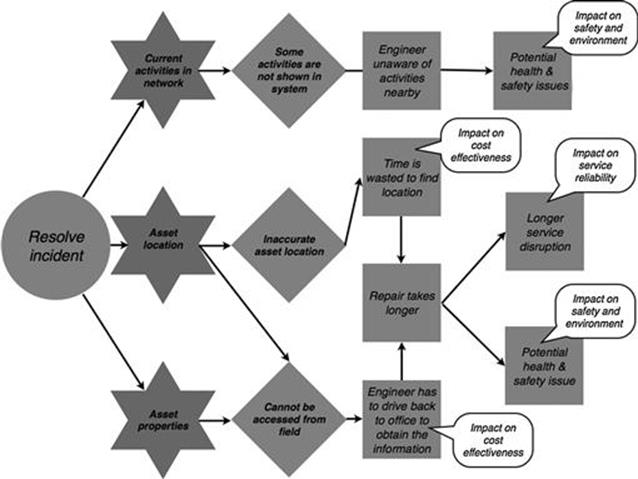
FIGURE 10.11 Affected business objectives in the incident management process, part 2.
Step B6: Examine existing risk controls
When assessing the situation and allocating resources, ongoing activities in the network and information about known problems are crucial to make the right resource allocations. To prevent poor information quality leading to a wrong allocation, in important cases managers from different departments are called to make sure that the information is complete and accurate (Figure 10.12). Engineers who resolve the incident to prevent safety risks, as shown in Figure 10.13, undertake the same actions. This risk control is nevertheless quite time intensive and costs the company on average around $20 USD because of the lost time. Still, this only partially prevents the consequences from ensuing, as issues regarding information quality are not being discovered.
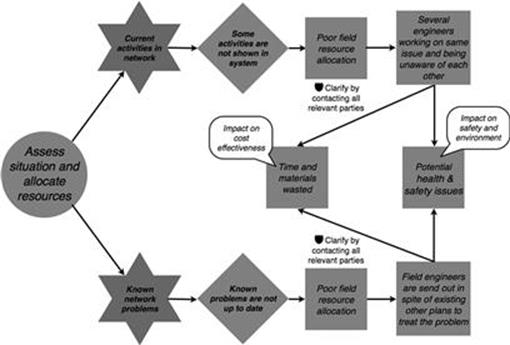
FIGURE 10.12 Risk controls in the incident investments process, part 1.

FIGURE 10.13 Risk controls in the incident investments process, part 2.
When engineers plan to go offsite, they often print out data about asset properties and asset location, as they know that they cannot access the data from the field (Figure 10.13). However, this risk control only works in certain cases, because often engineers cannot foresee which data they will actually need. The printing costs each time are around $5 USD on average.
Step B7: Estimate likelihood and impact of each consequence
Figure 10.14 shows the probabilities of consequences and the quantified impact on business objectives for the assess the situation and allocate resources task of the business process. For example, the consequence of poor field resource allocation follows with a 20% probability when information about current activities in the network is needed during task execution and some activities are not shown in the system. Moreover, this risk causes the consequence of several engineers working on the same issue and being unaware of each other with a probability of 10%, which results in potential health and safety issues having an impact of 100 on the scale defined in step A4 on the business objective of safety and environment with a likelihood of 50%. It always leads to time and material being wasted, which costs $1000 per average incident.
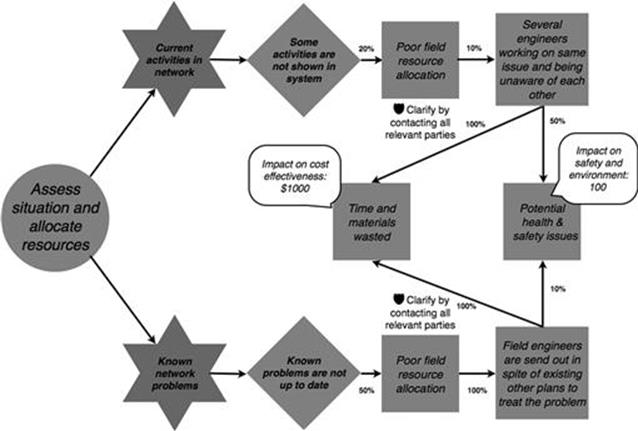
FIGURE 10.14 Probability and impact of each consequence in the incident investments process, part 1.
Figure 10.15 shows the probabilities and the quantitative impact on business objectives of consequences for the resolve incident task of the incident management process.
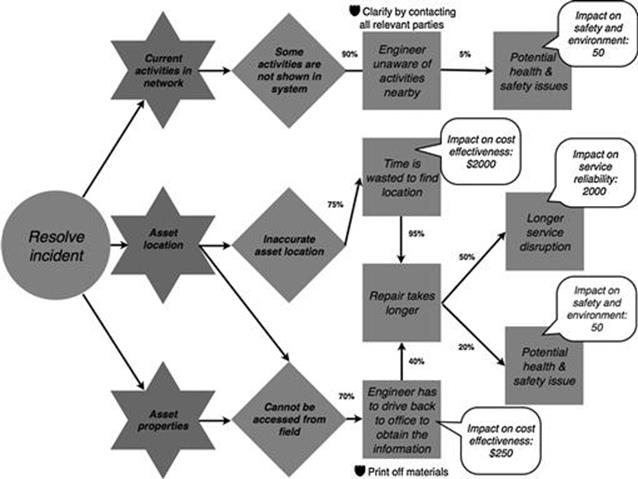
FIGURE 10.15 Probability and impact of each consequence in the incident investments process, part 2.
Step B8: Refine numbers and verify results
For each business process, the TIRM process manager who checked the modeling input and suggested changes identified at least one more subject-matter expert. In some cases, there was some larger disagreement and a meeting was organized to resolve the dispute. The finalized results are discussed here.
The refined and finalized model for the assess the situation and allocate resources task of the incident management process is shown in Figure 10.16. The changes are highlighted with a tools symbol. During the check of the numbers, it came up that poor field resource allocation follows the information quality problem of activities not shown in the system, with a probability of 30% rather than 20%. Also, when information about known network problems is not up to date and a poor field allocation happens, field engineers are not always sent out in vain, but rather in four out of five cases (80%, as highlighted in figure).
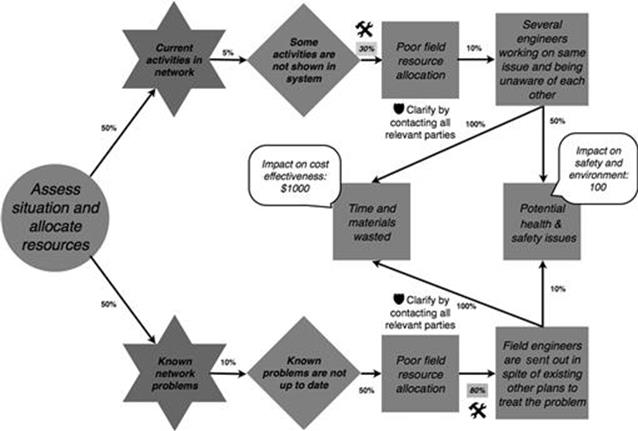
FIGURE 10.16 Finalized refined model of the assess the situation and allocate resources task in the incident investments process, part 1.
Figure 10.17 shows the adjusted model for resolving the incident. An average service disruption caused by a longer repair affects, on average, 1000 customers for one hour, and not 2000 customers as indicated during the initial analysis (highlighted in bold and underlined). Moreover, a potential health and safety issue happens in only 10% of cases, in contrast to 20%, when a repair takes longer (highlighted in gray box).

FIGURE 10.17 Finalized refined model of the resolve incident task in the incident investments process, part 2.
Business process 2: New connections
Step B1: Analyze tasks in each business process
The new connections process handles customer queries for new property developments that need to be connected to the electricity network (Figure 10.18). The requests come from private households as well as professional developers. Each request needs to be evaluated and a quote is given to the customer. There are roughly 200 requests per month, but not all of the requests actually lead to a new connection, for example, because the clients decide not to construct a new building after all. Around 120 times per month a new household or industrial property is actually connected to the electricity network.
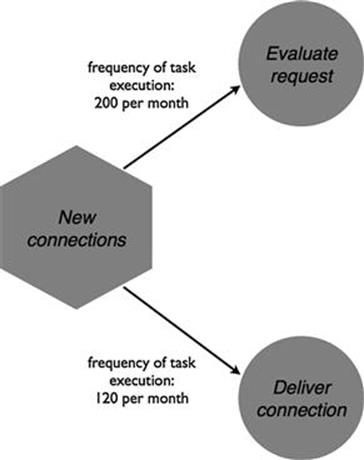
FIGURE 10.18 New connections process.
Step B2: Examine information needed for each task
Two essential pieces of information that are always used for both tasks in the process are information about the asset location and information about the attributes of assets (Figures 10.19 and 10.20). Information about the location is needed during request evaluation to assess the costs of the new connection, which depends on the distance of the new property to the nearest electricity line. However, only certain electricity lines are usable for a new connection, so this is where asset attributes become important. Note that other pieces of information, such as information about the availability of materials and customer payments, are also essential for the new connections process, however, they are out of the scope of the TIRM process application as defined by the TIRM steering council.

FIGURE 10.19 Information needs for new connections, part 1.
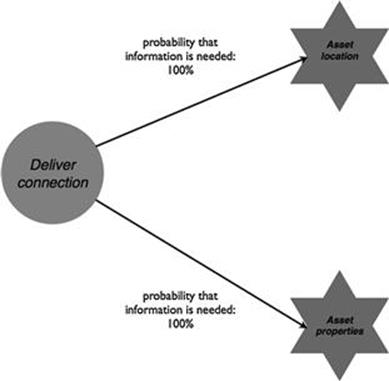
FIGURE 10.20 Information needs for new connections, part 2.
Step B3: Identify information quality problems during task execution
In the new connections process, both tasks suffer from the same information quality problems, as shown in Figures 10.21 and 10.22. In 20% of cases, asset location is not accurate and causes problems. In 10% of the evaluate request tasks and in 30% of the deliver connection tasks, when the engineer needs the information about asset location and asset properties, it cannot be accessed, because the engineer is out in the field and does not have connection to the IT system. Moreover, some information about asset properties that are needed for evaluating requests and delivering the connection are not available in 15% of times.
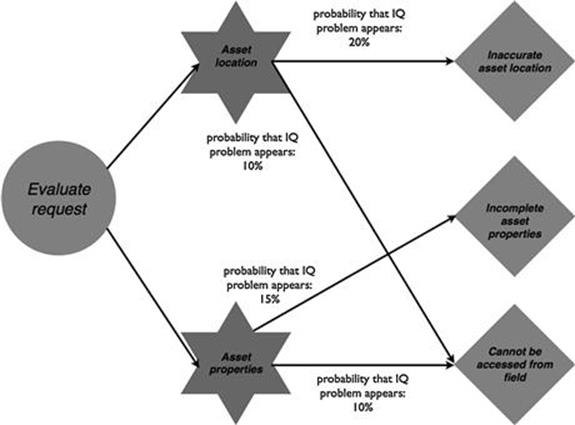
FIGURE 10.21 Information quality problems in the new connections process, part 1.
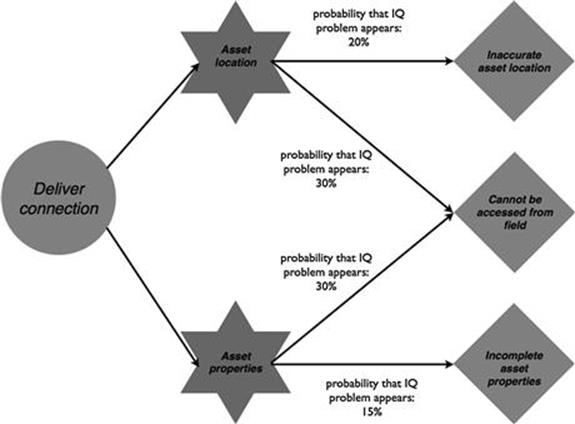
FIGURE 10.22 Information quality problems in the new connections process, part 2.
Step B4: Identify consequences of information quality problems
When a customer request for connecting a new property to the electricity network is being evaluated, inaccurate asset location and incomplete asset properties information can lead to an incorrect cost calculation (Figure 10.23).
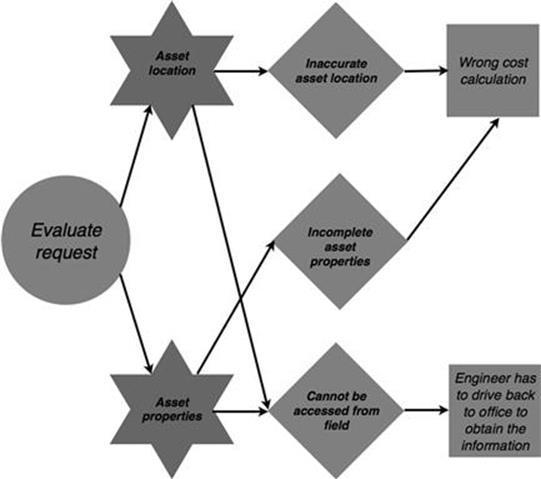
FIGURE 10.23 Consequences in the new connections process, part 1.
When the connection is supposed to be made (Figure 10.24), the same information quality problems can cause a delay of the installation, which is a disruption for the customer and increases the costs for LightBulbEnergy Inc. In both stages of new customer connections, during evaluation of the request and during delivery of the connection, engineers who need the information from the field have to drive back to the office to obtain the information, which is a waste of time and gas.
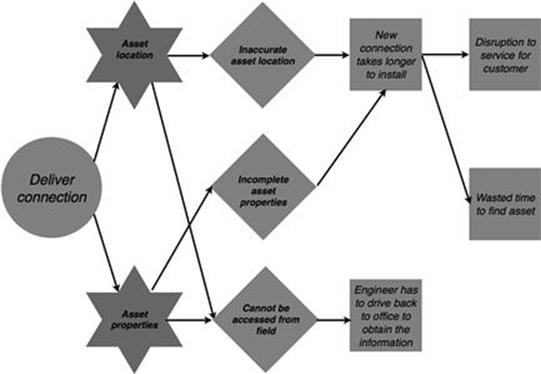
FIGURE 10.24 Consequences in the new connections process, part 2.
Step B5: Identify for each consequence the business objectives that are affected
The consequences of the wrong cost calculation and engineer has to drive back to the office to obtain the information clearly both impact the business objective of cost effectiveness, as illustrated in Figures 10.25 and 10.26. A disruption to the service of a customer has an impact on the business objective of service reliability.

FIGURE 10.25 Affected business objectives in the new connections process, part 1.
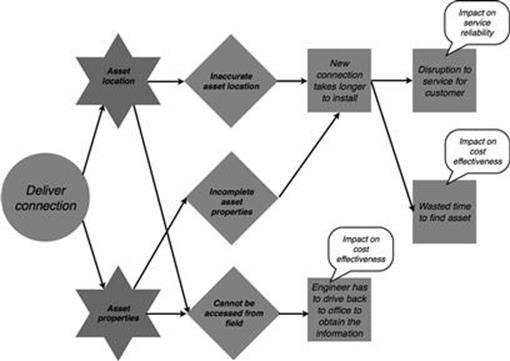
FIGURE 10.26 Affected business objectives the new connections process, part 2.
Step B6: Examine existing risk controls
A risk control in the new connections process is to charge customers more to make up for additional costs when incorrect cost calculations are made during the request evaluation, as shown in Figure 10.27. Moreover, when engineers plan to go offsite to evaluate the request or to deliver the connection, the data about asset properties and asset location is often printed out in paper form as they know that they cannot access the data while in the field (Figures 10.27 and 10.28).
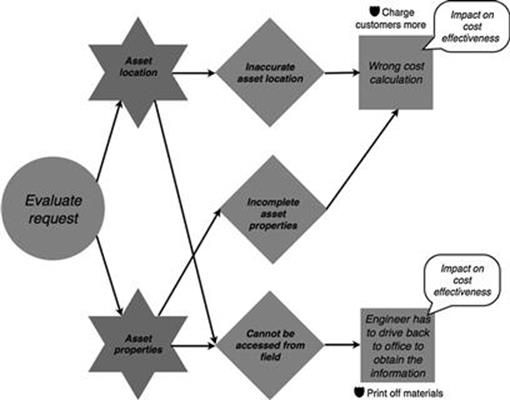
FIGURE 10.27 Risk controls in the new connections process, part 1.
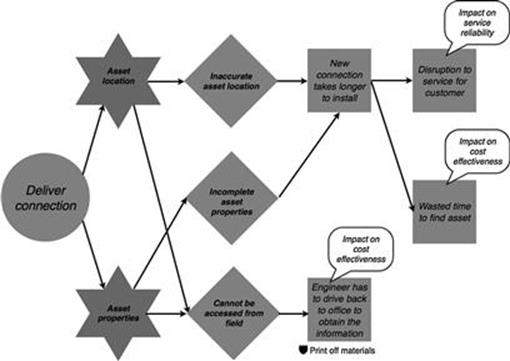
FIGURE 10.28 Risk controls in the new connections process, part 2.
Step B7: Estimate likelihood and impact of each consequence
Figure 10.29 illustrates the probabilities and the quantitative impact on business objectives of consequences for the evaluate request task of the new connections process.
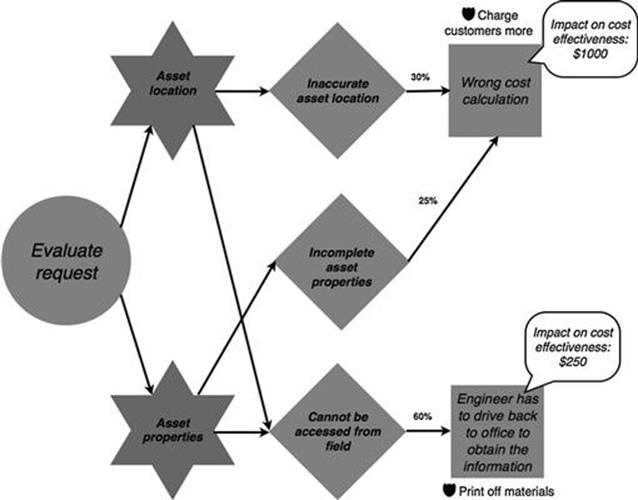
FIGURE 10.29 Probability and impact of each consequence in the new connections process, part 1.
Figure 10.30 displays the probabilities and the impact of each consequence for the deliver connection task of the new connections process.

FIGURE 10.30 Probability and impact of each consequence in the new connections process, part 2.
Step B8: Refine numbers and verify results
The verification of the risk analysis by an additional subject-matter expert, a new connections manager, revealed that the costs of a wrong cost calculation during request evaluation lie, on average, at around $2000 rather than $1000 as originally anticipated (highlighted in Figure 10.31 with the tools symbol).
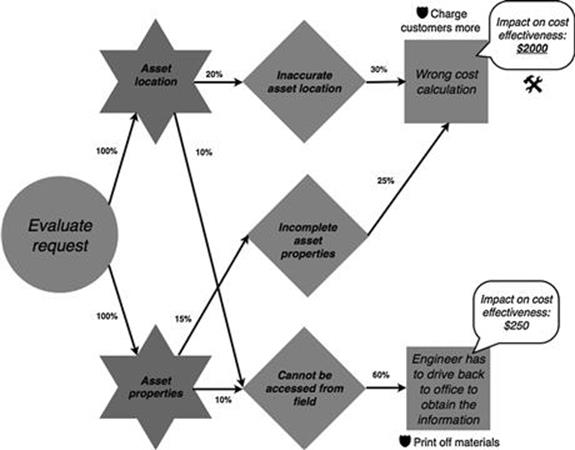
FIGURE 10.31 Finalized refined model of the evaluate request task in the new connections process, part 1.
Furthermore, Figure 10.32 displays the refinements made in the deliver connection task. The costs for wasted time to find an asset are, on average, a bit lower as modeled ($2000 instead of $3000). Also, an engineer has to drive back to obtain information around 60% (and not 40%) of the time when he or she cannot access the required data from the field.
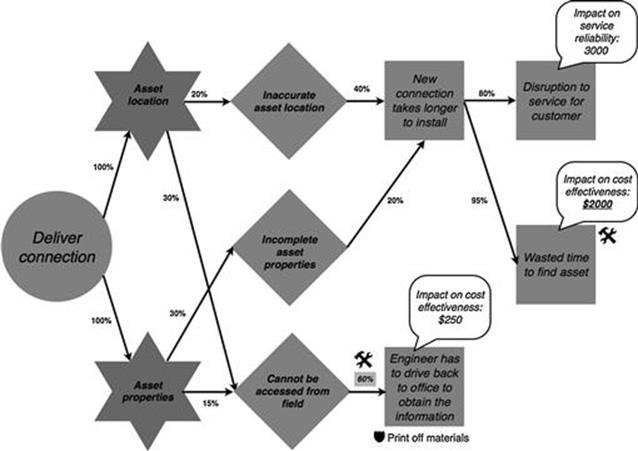
FIGURE 10.32 Finalized refined model of the deliver connection task in the new connections process, part 2.
Business process 3: Infrastructure investments
Step B1: Analyze tasks in each business process
The infrastructure investment process deals with investments in the electricity network, such as refurbishment, replacement, or building new electricity lines and substations (Figure 10.33). In particular, around 50 potential investments are identified per month, of which, on average, 35 per are actually implemented. The identify and select investments task involves the identification of investment needs and making the investment decision based on an evaluation of the costs, benefits, and risks of each investment. The selected investment projects are then planned and implemented (the plan and fulfill investments task).
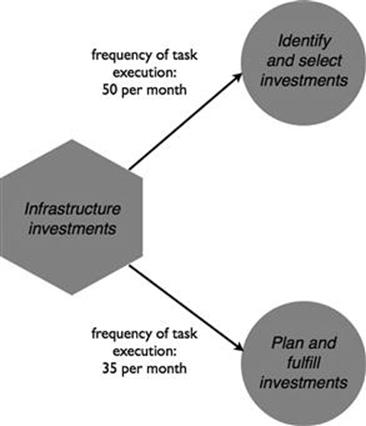
FIGURE 10.33 New connections process.
Step B2: Examine information needed for each task
The last business process that deals with infrastructure investments also suffers from four information quality problems. For identifying and selecting investments, as shown in Figure 10.34, information about the asset condition is needed that gives a measure of the degree of the deterioration of the asset and remaining asset life. Moreover, information about faults occurring with the asset is also used.
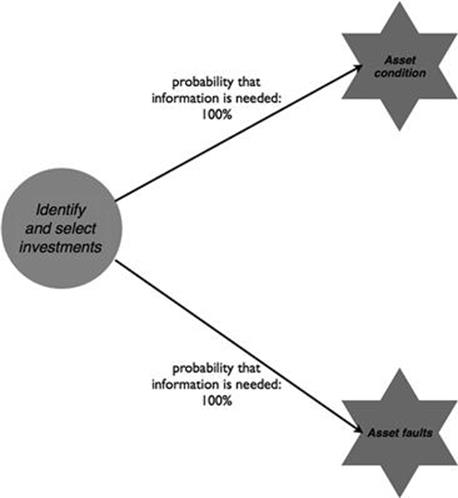
FIGURE 10.34 Information needs for infrastructure investments, part 1.
For planning and executing the investment, shown in Figure 10.35, information about the location and properties of assets is key to understand in which geographical regions asset replacement and refurbishment is necessary and which type of treatment is required.
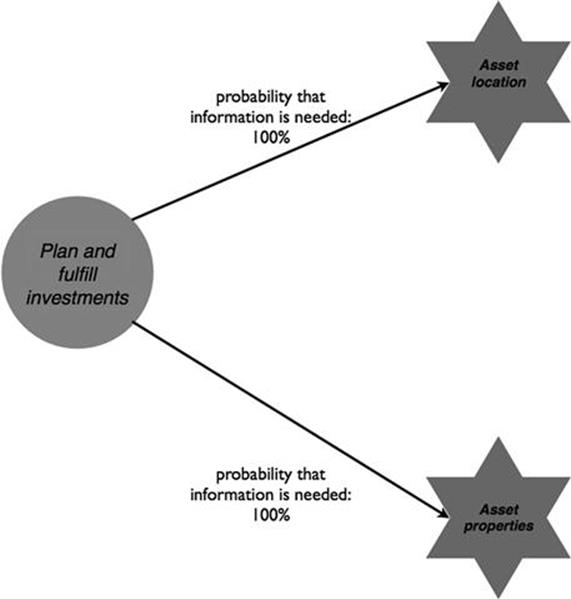
FIGURE 10.35 Information needs for infrastructure investments, part 2.
Step B3: Identify information quality problems during task execution
When investments are identified and selected, in 25% of cases when asset fault data is needed, there are some asset faults missing in the historical records that are used to determine the probability of failure (Figure 10.36). Furthermore, information about the condition of the asset is incorrect in 10% of cases.
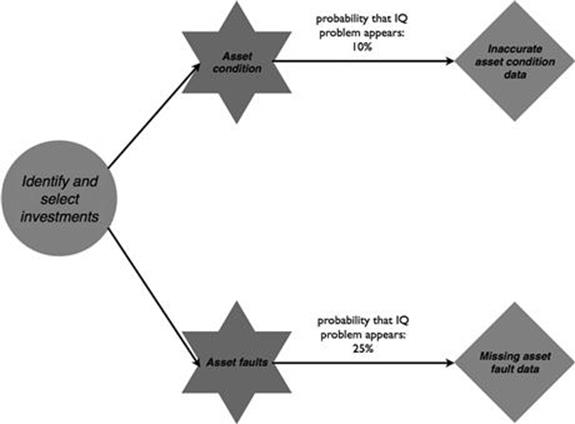
FIGURE 10.36 Information quality problems in the infrastructure investment process, part 1.
During planning and fulfillment of the network investments, information quality problems appear that are similar to those seen when information about asset location and asset attributes was needed (Figure 10.37). The information about the location of the asset is incorrect in 20% of cases and information about key attributes of the asset is not available in 15% of cases. Before engineers go out in the field, the location of assets and their key attributes are printed out on paper. In 10% of cases, additional information is needed in the field that has not been anticipated, which then is not accessible. The problem comes up when additional information is required when the fulfillment engineers are already in the field.
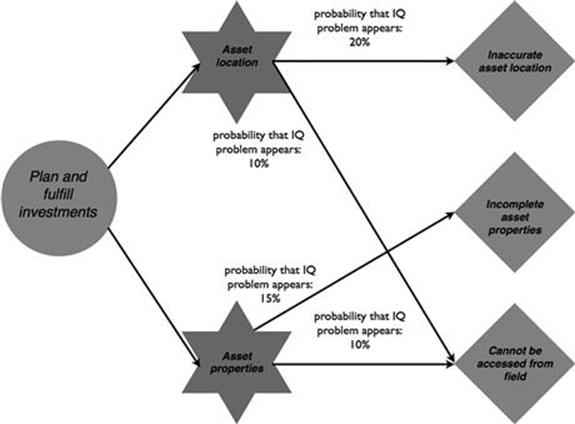
FIGURE 10.37 Information quality problems in the infrastructure investment process, part 2.
Step B4: Identify consequences of information quality problems
The identification and selection of infrastructure investments relies heavily on data about the condition of assets and previously experienced faults (Figure 10.38). The asset condition data is, however, sometimes incorrect and often information about asset faults is missing in the database or is recorded at a higher level because the failed asset could not be correctly identified when the fault was first recorded. Both information quality problems can potentially lead to very similar direct consequences, as they can cause a suboptimal investment decision. Simply speaking, either the assets are refurbished and/or they are replaced too early or too late. Doing it too early causes unnecessary costs, as the asset could have been used for a longer time. Not replacing or refurbishing assets when necessary can lead to asset failures in the electricity network. Asset failures can cause costs for incident management or might lead to disruptions in service to the customer (e.g., power outages). In extreme cases, asset failures can be dangerous for employees, the general population, and the environment.
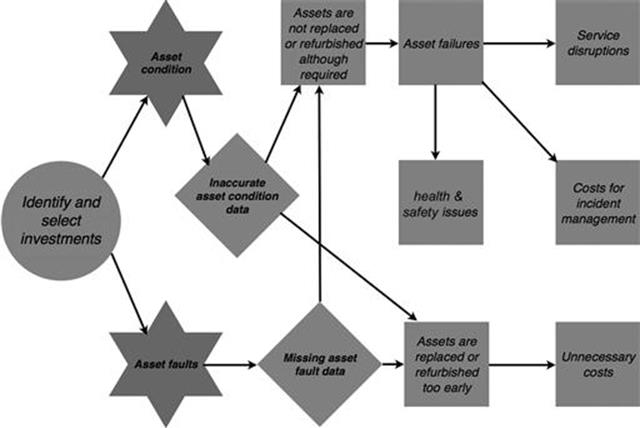
FIGURE 10.38 Consequences in the infrastructure investments process, part 1.
During implementation of the investment, inaccurate asset location and incomplete asset properties can lead to higher implementation costs (Figure 10.39). Moreover, when engineers need the information while being on the construction site, they need to go back to their office to get the information.
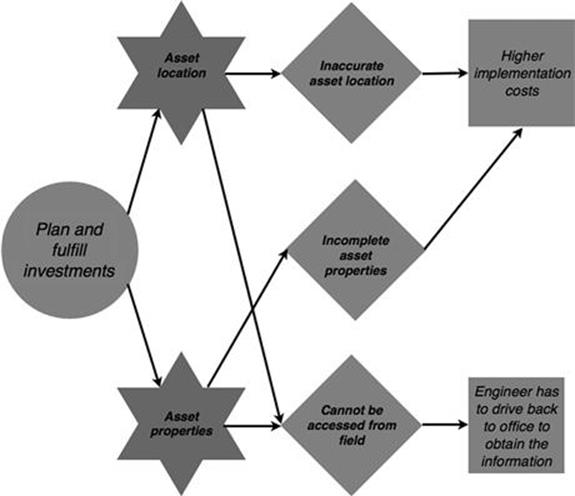
FIGURE 10.39 Consequences in the infrastructure investments process, part 2.
Step B5: Identify for each consequence the business objectives that are affected
Information quality problems have an impact on all three different business objectives when infrastructure investments are evaluated and chosen (Figure 10.40). Service disruptions due to asset failure have an impact on service reliability. Asset failures also increase the costs as the incident has to be managed, which impedes cost effectiveness and in some cases leads to health and safety problems that impact the business objective of safety and environment.
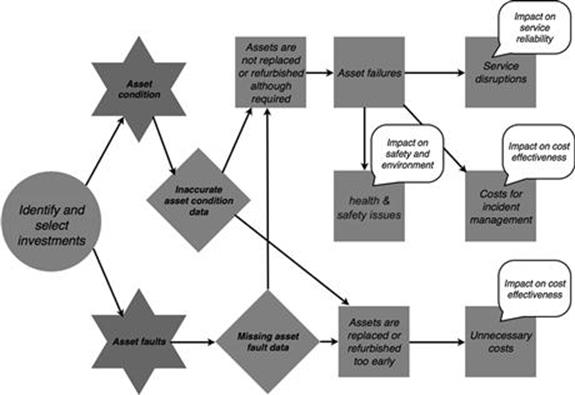
FIGURE 10.40 Affected business objectives in the infrastructure investments process, part 1.
When the investment is planned and fulfilled, higher implementation costs and engineers having to return unnecessarily to the office to obtain data both affect the business objective of cost effectiveness, as illustrated in Figure 10.41.
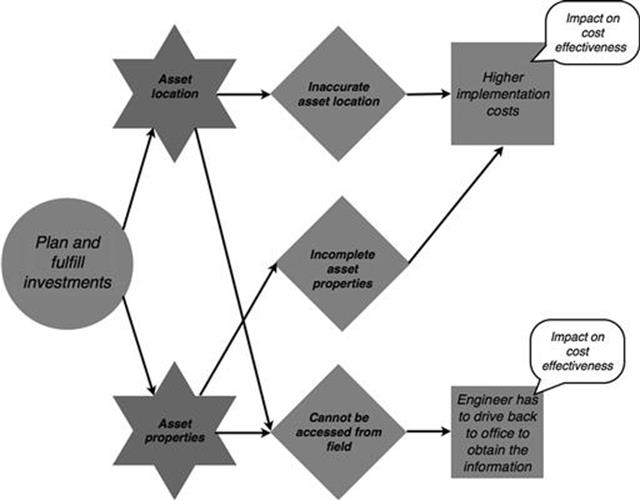
FIGURE 10.41 Affected business objectives in the infrastructure investments process, part 2.
Step B6: Examine existing risk controls
Infrastructure investments based on low-quality data can lead to assets not being replaced or not refurbished when needed. When in doubt, infrastructure investments like refurbishment and maintenance activities are ideally carried out earlier to prevent asset failures from occurring; this is one risk control taken, as illustrated in Figure 10.42. To prevent investments taking a suboptimal time (i.e., too early or too late), an additional risk control is that the assets are checked onsite.

FIGURE 10.42 Risk controls in the infrastructure investments process, part 1.
As before, during planning and fulfillment, engineers print out data about asset properties and asset location, as they know that they cannot access the data from the field, (Figure 10.43).
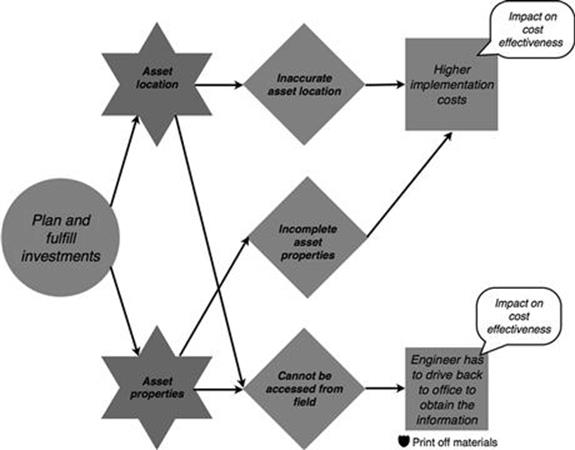
FIGURE 10.43 Risk controls in the infrastructure investments process, part 2.
Step B7: Estimate likelihood and impact of each consequence
Figure 10.44 shows the probabilities and the quantitative impact on business objectives of consequences of information quality problems in the identify and select investments task of the infrastructure investments process.
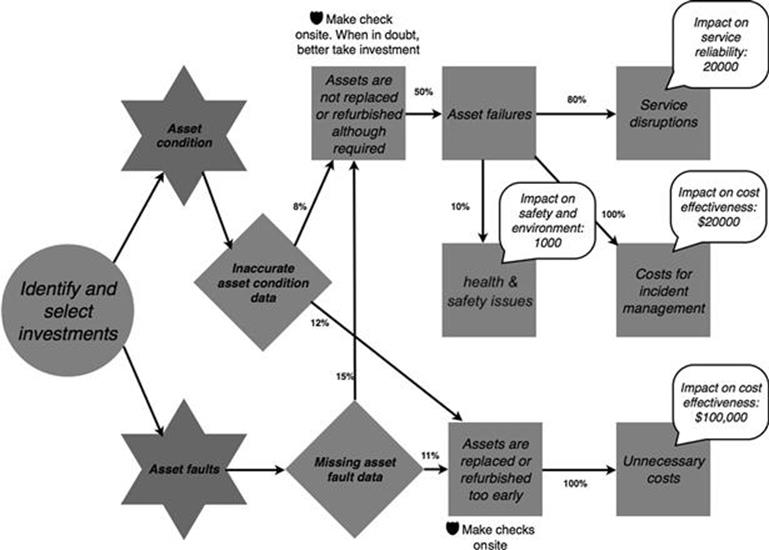
FIGURE 10.44 Probability and impact of each consequence in the infrastructure investments process, part 1.
Figure 10.45 shows the probability and the impact of each consequence of information quality problems in the plan and fulfill investments task of the infrastructure investments process.

FIGURE 10.45 Probability and impact of each consequence in the infrastructure investments process, part 2.
Step B8: Refine numbers and verify results
Figures 10.46 and 10.47 show the refined model of the infrastructure investments process. The changes are again highlighted with a tools symbol. Further investigation revealed that during identification and selection of investments, missing asset fault data leads to the consequence that assets are not replaced or refurbished although required in 7% of cases, so significantly lower than the 11% originally anticipated.
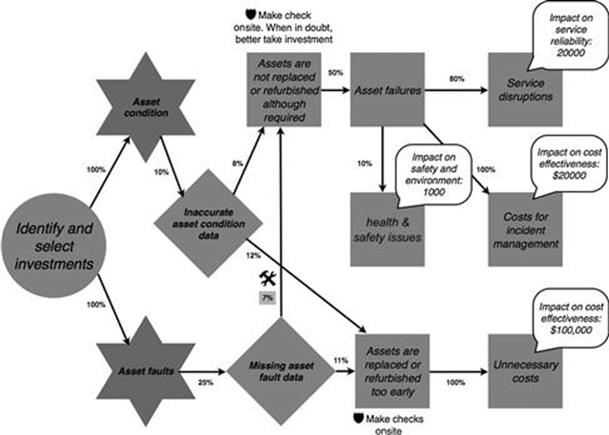
FIGURE 10.46 Finalized refined model of the identify and select investments task in the infrastructure investments process, part 1.
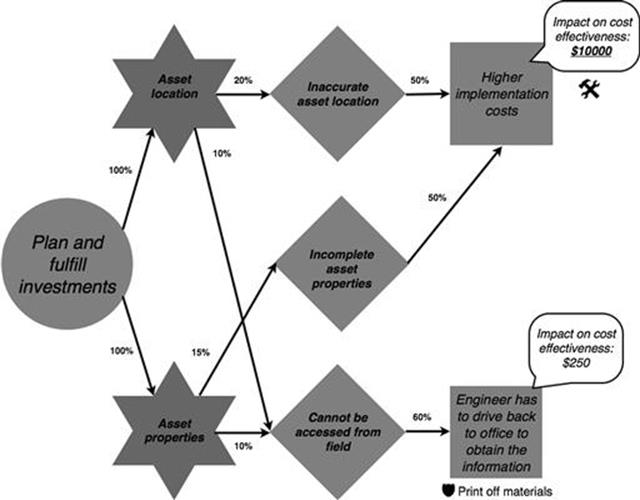
FIGURE 10.47 Finalized refined model of the plan and fulfill investments task in the infrastructure investments process, part 2.
Finally, as part of planning and fulfillment of an investment, historical data was found that shows that higher implementation costs, which are due to inaccurate asset location data or incomplete asset properties data, lies at around $10,000 on average and not $8000 as assumed during the first round of analysis (underlined and bold in Figure 10.47).
Step B9: Evaluate and rank information risks
The total impact of each one of the information quality problems was calculated and the information risks were ranked in an information risk evaluation workshop. The results are summarized in Table 10.2.
Table 10.2
Ranked List of Information Risks (Time Horizon of One Year)
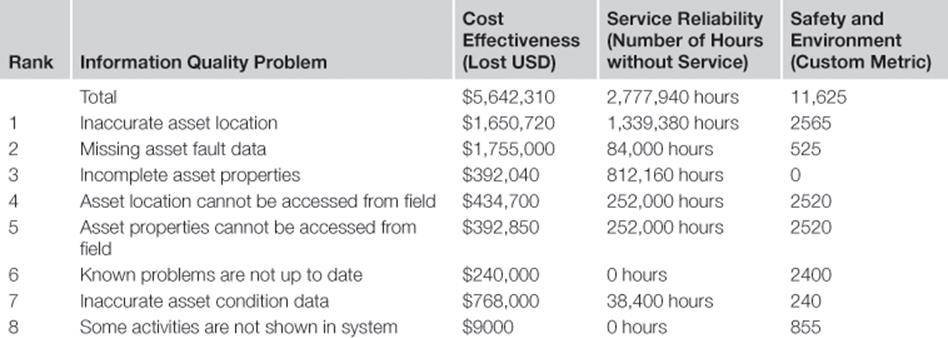
Moreover, each information risk was compared to the risk criteria formulated in step A4 to evaluate it. The result of the evaluation is shown in Table 10.3. It was decided that the highest risk regarding the business objectives should be used as the overall evaluation. It was also determined that for all information risks that are evaluated as high or very high, information risk treatment is necessary.
Table 10.3
Information Risk Evaluation
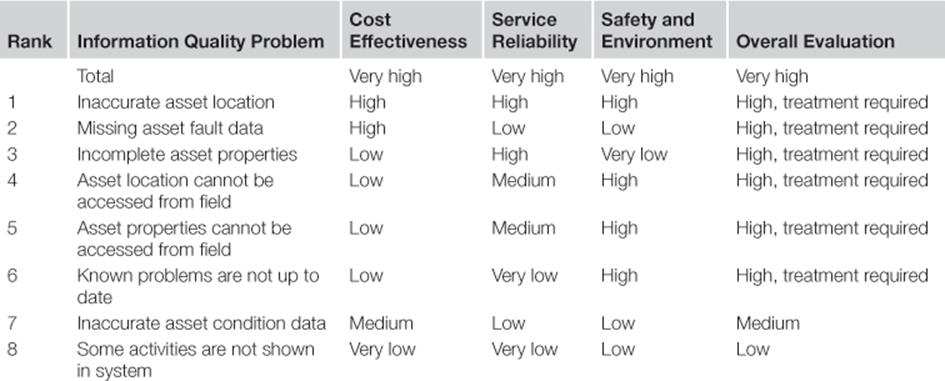
After the information risk evaluation workshop was completed, the TIRM steering council decided that it was now time to move on to the information risk treatment stage.
Stage C: Information risk treatment
The TIRM process manager organized a two-day workshop with the IT system and database representatives, TIRM process facilitators, and selected members of the TIRM steering council.
Step C1: Analyze causes of information quality problems
As a first step, they investigated the root causes of each of the information quality problems that require treatment. This was done by drawing a fishbone diagram and using the categories technology, organization, and people to categorize potential root causes.Figures 10.48 to 10.50 show the results of the root-cause analysis.
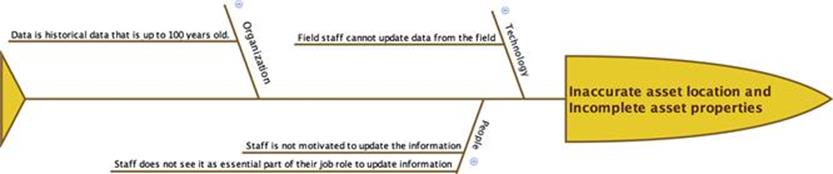
FIGURE 10.48 Root-cause analysis for information quality problems of inaccurate asset location and incomplete asset properties.
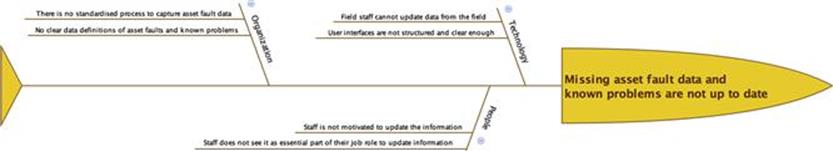
FIGURE 10.49 Root-cause analysis for information quality problems of missing asset fault data and known problems are not up to date.
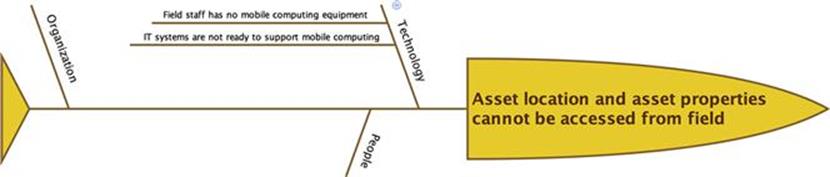
FIGURE 10.50 Root-cause analysis for information quality problems of asset location cannot be accessed from field and asset properties cannot be accessed from field.
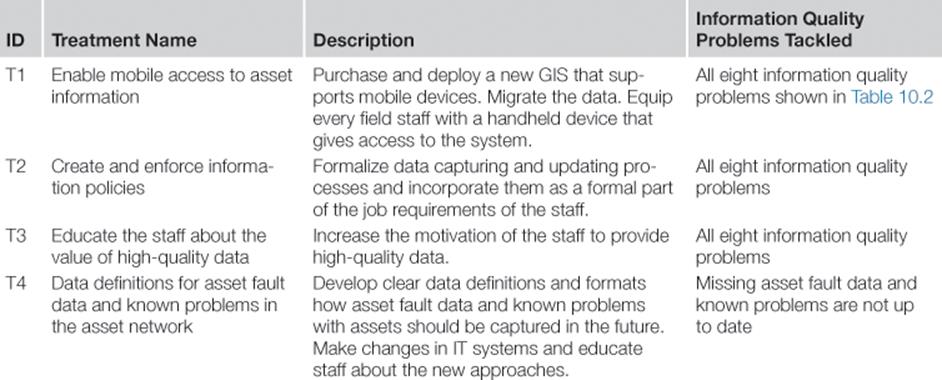
Step C2: Identify and describe treatment options
Next, four potential information risk treatment options were identified, which are shown in Table 10.4. Besides the mobile GIS that was to be investigated as a potential investment as part of the goals of the TIRM process, a number of additional information risk treatments were identified.
Table 10.4
Identified Information Risk Treatments
Step C3: Estimate costs, benefits, and risks of treatment options
The TIRM steering council was aware that information quality improvement is a long-term investment; therefore, a decision was made to look at the costs, benefits, and risks over a ten-year horizon.
Step C3.1: Estimate costs of information risk treatment options
Tables 10.5 to 10.8 show the estimated costs of each information risk treatment. The costs can be classified into four categories: software, hardware, external services, and human resource requirements. Moreover, there are some costs that occur only once at the very beginning of the investment. Other costs are incurred continuously year on year.
Table 10.5
Costs for Information Risk Treatment T1: Mobile GIS
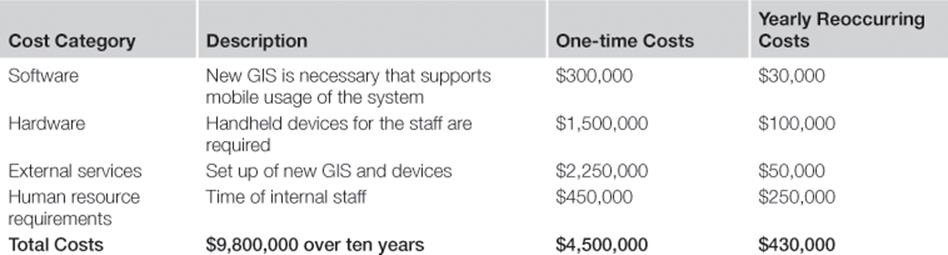
Table 10.6
Costs for Information Risk Treatment T2: Create and Enforce Information Policies
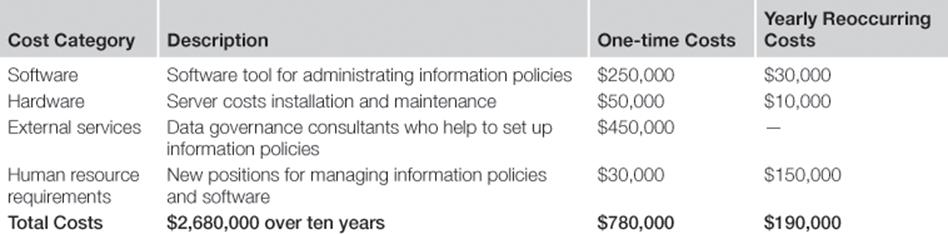
Table 10.7
Costs for Information Risk Treatment T3: Educate Staff about Value of High-quality Data
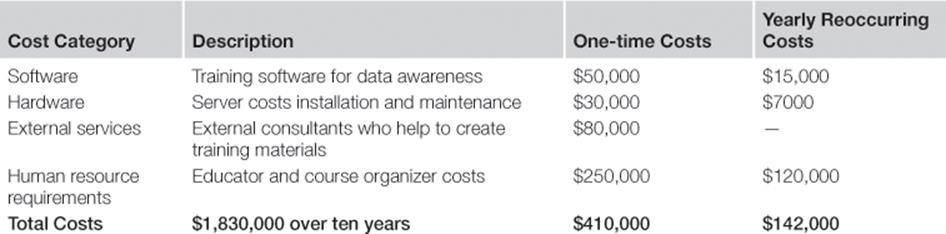
Table 10.8
Costs for Information Risk Treatment T4: Data Definitions for Asset Fault Data and Known Problems in the Asset Network
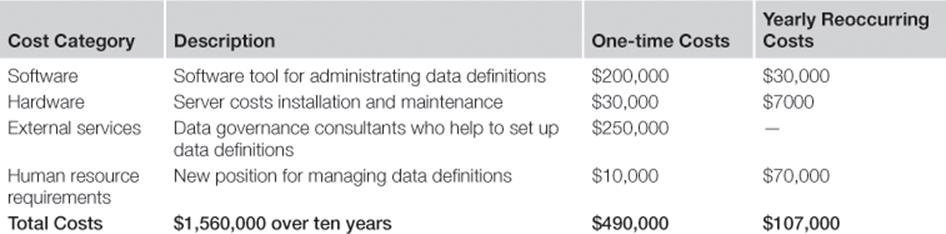
Step C3.2: Estimate benefits of information risk treatment options
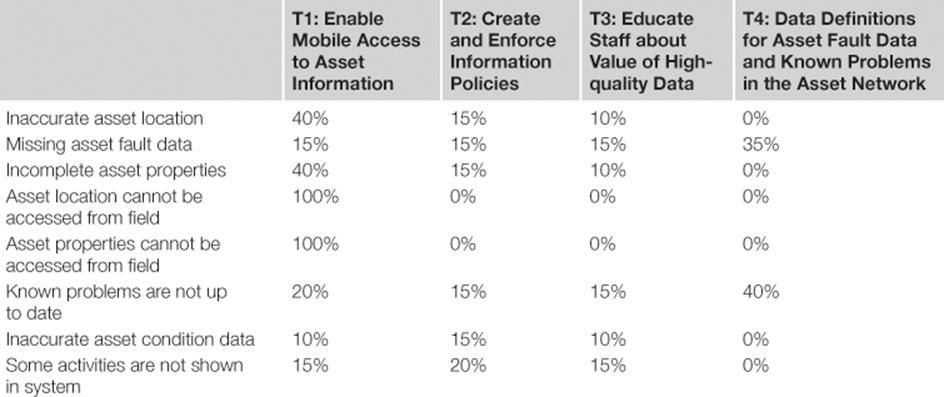
Every information risk treatment will have an effect on some of the information quality problems, which will result in the reduction of the probability that an information quality problem occurs. To determine the benefits, the working group therefore estimated how much the probability of each information quality problem was likely to be reduced through each of the information risk treatments. The results are shown in Table 10.9.
Table 10.9
Effect of Information Risk Treatments on Information Quality Problems
The TIRM process manager is aware that the benefits of the information risk treatments will only be achieved gradually over time, once the treatments are successfully implemented. Therefore, assumptions with regard to when the benefits will be realized were formulated in Table 10.10. The working group has the expectation that after one year, one-third of the benefits will start to be realized. In years four to six, two-thirds of the benefits should be realized, while the full benefits will be only realized after year six.
Table 10.10
Assumptions of Benefit Realization over Ten Years
|
Years |
Percentage of Benefits Realized |
|
Year 0 |
0% |
|
Years 1–3 |
33% |
|
Years 4–6 |
66% |
|
Years 7–10 |
100% |
Based on the total risk figures in Table 10.1 and combining the expected effect of information risk treatments on information quality problems (see Table 10.8) together with the assumptions about benefits realization (see Table 10.9) allows the company to calculate the total benefits for each information risk treatment over the next ten years. Tables 10.11 to 10.14 present the benefits for each information risk treatment T1 to T4 and each information quality problem and business objective. Table 10.11 shows the benefits of enabling mobile access to asset information.
Table 10.11
Benefits over Ten Years of Information Risk Treatment T1: Mobile GIS
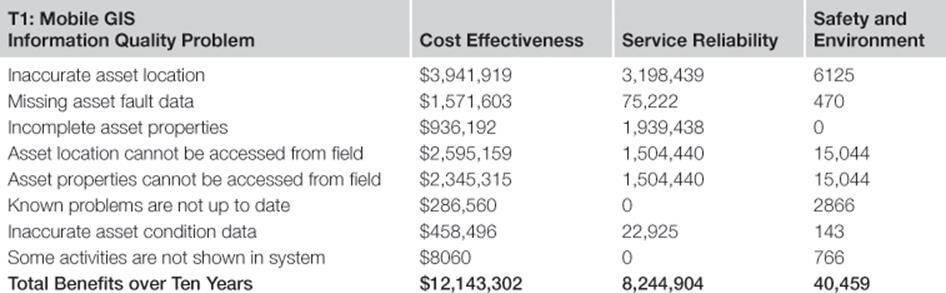
Table 10.12
Benefits over Ten Years of Information Risk Treatment T2: Create and Enforce Information Policies
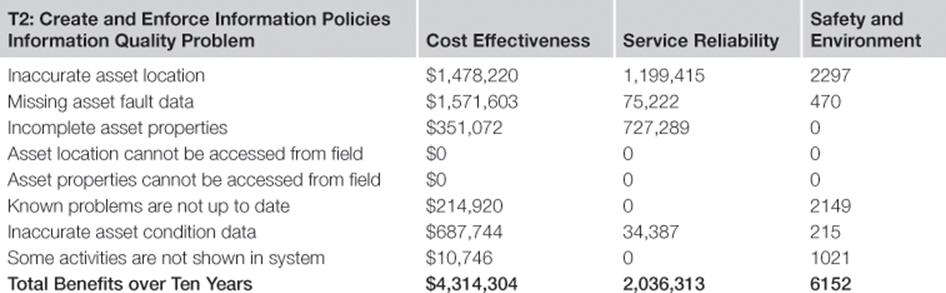
Table 10.13
Benefits over Ten Years of Information Risk Treatment T3: Educate the Staff about Value of High-quality Data
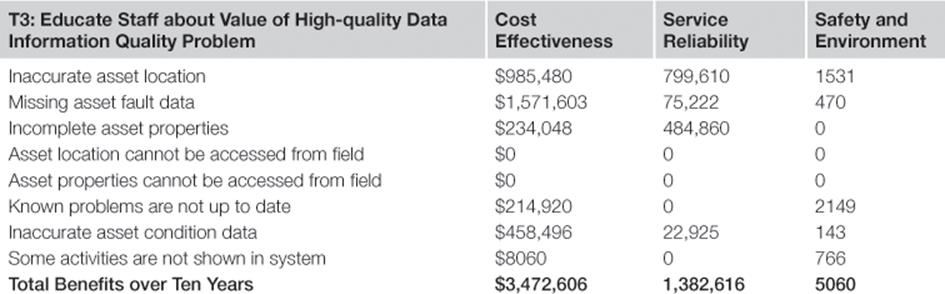
Table 10.14
Benefits over Ten Years of Information Risk Treatment T4: Data Definitions for Asset Fault Data and Known Problems in the Asset Network
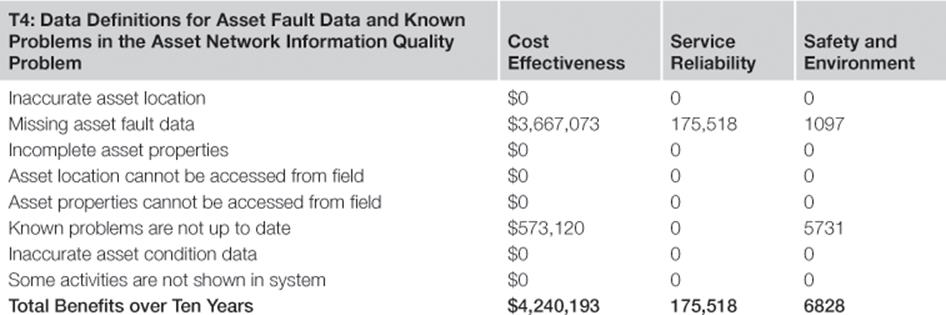
Table 10.12 shows the benefits of creating and enforcing standardized information policies.
Table 10.13 shows the benefits of educating the staff about the value of high-quality data.
Table 10.14 shows the benefits of having standardized data definitions for asset fault data and known problems in the asset network.
Step C3.3: Identify implementation risks for each information risk treatment option
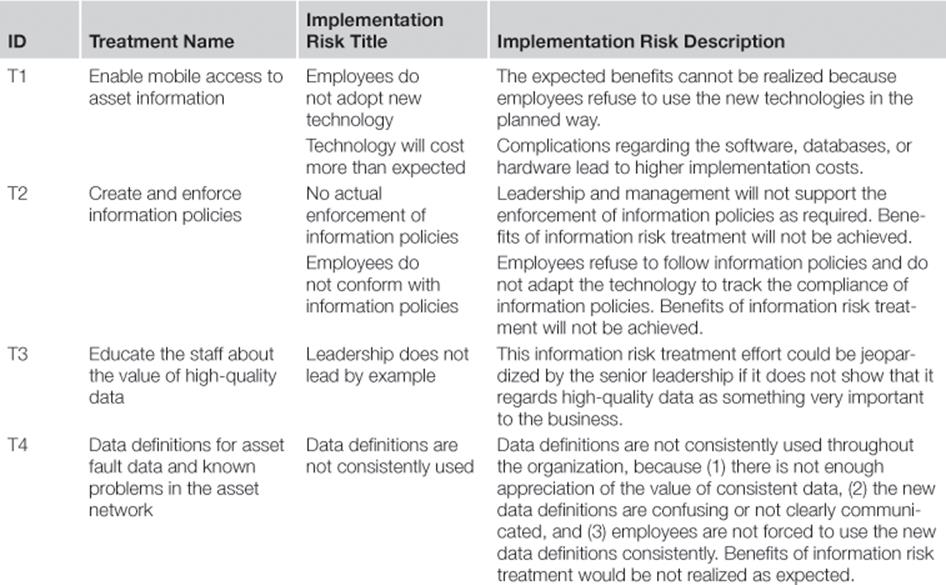
For each information risk treatment option, there are a number of things that could go wrong during their implementation that would affect the assumptions about the costs and benefits of the treatment. A brainstorming session revealed a list of implementation risks, which are presented in Table 10.15.
Table 10.15
Implementation Risk Register for Information Risk Treatments
Step C4: Evaluate and select treatment options
Once the information risk treatments and its costs, benefits, and risks have been identified, it is time for LightBulbEnergy Inc. to make a decision about which information risk treatments should be implemented. The TIRM steering council decided that the net present value (NPV) expected and the return on investment (ROI) should be calculated for each information risk treatment, which is shown in Table 10.16.
Table 10.16
NPV and ROI for Information Risk Treatment Options
|
Information Risk Treatment |
NPV (8.5% Internal Interest Rate) |
ROI |
|
T1: Enable mobile access to asset information |
$1,070,265 |
ROI after seven years |
|
T2: Create and enforce information policies |
$909,742 |
ROI after six years |
|
T3: Educate the staff about the value of high-quality data |
$999,127 |
ROI after five years |
|
T4: Data definitions for asset fault data and known problems in the asset network |
$1,631,237 |
ROI after four years |
The TIRM steering council also determines that a positive NPV and a ROI within eight years should be enough to justify the investment, as each information risk treatment would come with substantial additional benefits besides direct monetary values and would contribute toward the business goals regarding the objectives of service reliability and safety and environment, as presented in Tables 10.11 to 10.14. The implementation risks are considered significant enough to be taken very seriously, but they are not seen as a barrier preventing the company from going ahead with the investments. As all four information risk treatments comply with this criteria and the combination of these treatments is reasonable, it is decided to implement all four of them.
Step C5: Communicate the results to stakeholders
To engage all of the important stakeholders during implementation of the information risk treatments, the TIRM managing committee creates a list of stakeholder groups and creates tailored messages for each of them. The results from the information risk assessment and the selected information risk treatment options are communicated to each group, emphasizing different aspects of the results, as documented in Table 10.17. The TIRM managing committee creates materials that can be handed to each of the stakeholder groups. The TIRM process sponsor is responsible for communicating the results to the other board members and for helping the CEO sell the investments to the shareholders. Moreover, Bill Mighty, the TIRM project manager, organizes a separate presentation with each of the remaining stakeholder groups.
Table 10.17
Communicating Results Tailored to Each Stakeholder Group
|
Stakeholder Group |
Why are They Important? |
Which Message Should be Sent Out? |
|
Board members |
They have a lot of immediate organizational power and can substantially support or hinder the implementation. |
Implementing the information risk treatment measures helps deliver their business objectives. |
|
Shareholders |
Shareholders might not like the investments because it is bad for the short-term cash flow. They might force the board to abandon the investments. |
Investment has positive NPV and would strengthen the company’s position in the market. |
|
Regulators |
Investments need to be justified in front of regulators as they might impact the energy prices for consumers. |
Implementing the information risk treatment measures improves service reliability and decreases prizes in the long term. |
|
Field staff |
Field staff has to adopt the practices and technologies to make the investments worthwhile. |
Safety of field staff is improved. Helps field staff to deliver higher quality of work with less effort. Limits the amount of times work is done unnecessarily. |
|
Middle management |
Middle management is responsible for translating the goals of the executives into measurable outcomes. |
Higher-quality asset information makes it easier for middle management to reach their business targets and control the work performed by field staff. |
|
IT department |
As many information risk treatments rely on new software tools, IT is a key player during implementation of the treatments. |
Information risk treatments require a lot of support of IT and therefore strengthen the role of the IT department. IT staff can help to significantly contribute to achieve tangible business outcomes. |
After one month, the agreement of all the important stakeholder groups was obtained. Some of the stakeholders set particular conditions for the way in which the information risk treatments were to be implemented; this will be considered during the development of information risk treatment plans.
Step C6: Develop information risk treatment plans
Being sure of the support of the most important stakeholders and also receiving their input on how to actually implement the information risk treatments, the TIRM managing committee begins to plan the implementation of the selected information risk treatments. A summary of the information risk treatment plan is shown in Figure 10.51.
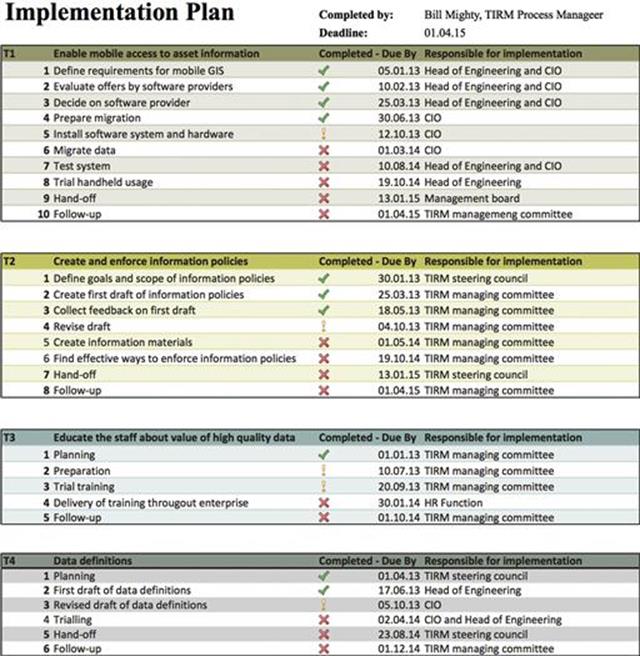
FIGURE 10.51 Summary implementation plan for information risk treatment options.
Once all information risk treatment plans have been finalized, the TIRM steering council decides to take the next important step and start the actual implementation.
Step C7: Implement information risk treatment plans
Bill Mighty, as the TIRM process manager, is responsible for monitoring the progress of the implementation of the four information risk treatments (tracked in Figure 10.51 using the status symbols). For each information risk treatment, a kickoff meeting takes place that includes all parties involved during the implementation. Every milestone shown in Figure 10.51 is reviewed by the TIRM managing committee, which reports the current progress, quarterly, to the TIRM steering council. After one year, first problems arise, as the migration of data to the new mobile GIS turns out to be more difficult than expected. An external IT consultancy is hired to help with the migration. This increased the costs of the information risk treatment by $225,000. The data migration can be completed with a one-month delay. The TIRM managing committee, to support the implementation, initiates active change management activities alongside the implementation of the information risk treatments. Luckily for LightBulbEnergy Inc., some two years later, all information risk treatments have been completed according to plan.
Step C8: Verify effectiveness of information risk treatments
The information risk treatments were implemented on time. But for the TIRM steering council, the more important question was, to what degree could the benefits have been realized? Therefore, after three, six, and ten years, the achievement of the benefits was monitored by updating the numbers for the frequency of the information quality problems and their overall impact from the information risk assessment stage. The actual realized benefits are compared to the planned benefits for each information risk treatment inTables 10.18 to 10.21.
Table 10.18
Planned versus Realized Benefits over Ten Years for Treatment T1
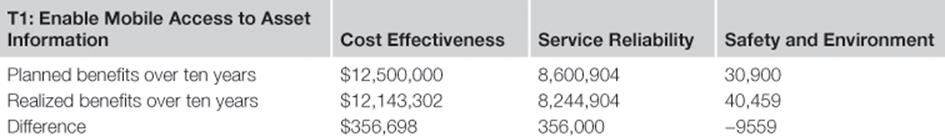
Table 10.19
Planned versus Realized Benefits over Ten Years for Treatment T2
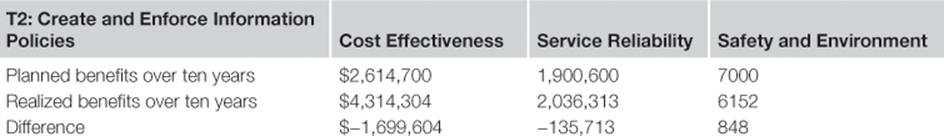
Table 10.20
Planned versus Realized Benefits over Ten Years for Treatment T3
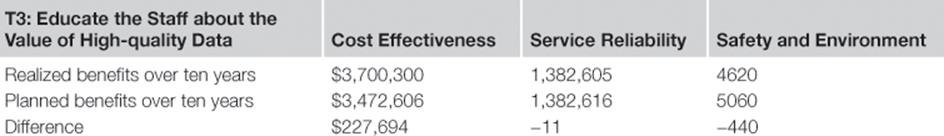
Table 10.21
Planned versus Realized Benefits over Ten Years for Treatment T4
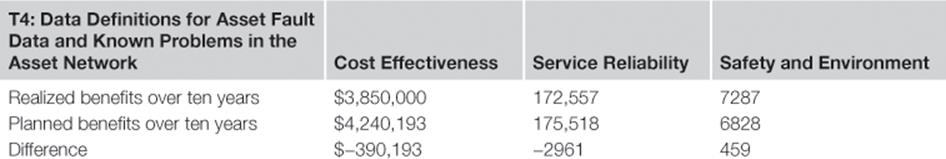
The realized benefits indicate that the projected planned benefits were reasonably accurate.
Summary
The TIRM steering council is fully satisfied with the results of the TIRM process and the realized benefits of the information risk treatment options. The head of engineering is now able to ensure that the business runs better, safer, and more efficiently. The CIO is also very pleased as she can show the contribution that the IT function is bringing to the business, in hard numbers. Learnings and problems encountered during the entire TIRM process have been captured and documented for the future. As the overall results are satisfactory, LightBulbEnergy Inc. decides to expand the scope of the TIRM process to other areas of the business. The TIRM process initially required an investment in resources to run the process that paid off relatively quickly. The assessment of information risks enabled LightBulbEnergy Inc. to focus the information quality improvement efforts on the things that really mattered for the company and also was able to convince other stakeholders in the company about the required information risk treatments. In the fictitious case of LightBulbEnergy Inc., which is very similar to the real-life case studies we have conducted in the past few years with companies in different industrial sectors, the investment in implementing the TIRM process was a real success story.