Total Information Risk Management (2014)
PART 3 Total Information Risk Management Techniques
OUTLINE
Chapter 11 Risk Assessment Techniques for TIRM
Chapter 12 Software Tools
Chapter 13 Establishing Organizational Support and Employee Engagement for TIRM
CHAPTER 11 Risk Assessment Techniques for TIRM
Abstract
This chapter provides a description of a number of existing risk techniques that can help in carrying out the TIRM process.
Keywords
Risk Assessment Techniques; Risk Identification Techniques; Risk Analysis Techniques; Risk Evaluation Techniques; Information Quality Techniques; Bow-Tie Analysis; Root-Cause Analysis (RCA); Failure Mode Effect and Criticality Analysis (FMECA)
What you will learn in this chapter
![]() The techniques available to carry out risk identification, risk analysis, and risk evaluation
The techniques available to carry out risk identification, risk analysis, and risk evaluation
![]() How to apply these techniques to manage information risks
How to apply these techniques to manage information risks
Introduction
The core message of this book has been to emphasize and illustrate the use of risk as a means to quantify the value of good-quality business information. You might be wondering how the TIRM process can be integrated into the risk management techniques already in use in your organization. For instance, your executive team might be using risk matrices to identify critical business risks to help decide priorities and develop a business continuity plan. Or your product designers might be using failure mode and effects analysis or fault-tree analysis to identify different ways in which your product might fail, helping you to redesign the product with improved reliability. You might, therefore, be asking “Do I need to reinvent the wheel and start from scratch to apply the TIRM process?” The answer is “No, you don’t!” and this chapter is devoted to examining how the popular tools and techniques used for risk management in industry may be used in the context of information risk management.
It is critical to understand that if you wish to manage the information risks in your company, you must do so within your existing framework(s) of risk management (unless you do not have any, or feel current practices are not up to scratch). Most organizations where risk management is an embedded activity will be using a suite of tools and techniques to help them effectively identify, assess, analyze, and treat risks. This chapter is particularly useful to managers in those organizations who might want to integrate an instantiation of the TIRM process into the portfolio of current risk management activities and seek to use the tools and techniques already in use for information risk management.
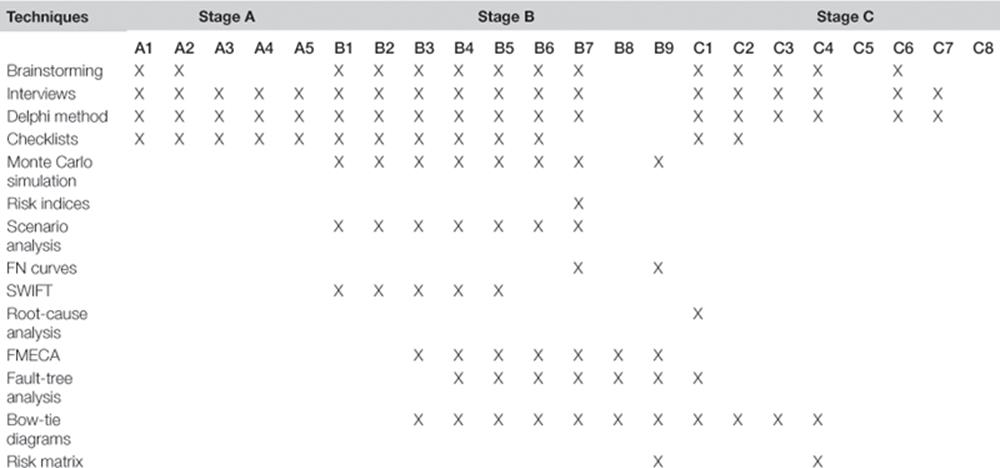
The best place to start looking for risk management techniques is ISO.IEC 31010:2009—Risk Management—Risk Assessment Techniques. This standard provides a comprehensive list of techniques that can be used in the different stages of a business risk management process. On the one hand, some of these tools are qualitative (e.g., brainstorming, checklists) and have widespread use throughout the process. On the other hand, there are tools that are quantitative and specific that are used for particular activities within the risk management process (e.g., FMECA, RCA). Here, we describe a selection of these tools that are relevant to information risk management, and suggest ways to adapt/adopt the tools to use within the TIRM process. A summary of the tools and techniques described in this chapter and their applicability across the different stages and steps in the TIRM process is shown in Table 11.1.
Table 11.1
Summary of Techniques
Brainstorming
“Let us have a brainstorming session to flesh this out!” This has become a very commonly (and often dreaded) phrase in the corporate world today. Brainstorming is probably one of the most frequently used group techniques in business life. The basic idea is to stimulate ideas by allowing thoughts to flow without imposing restrictions on the content of the thoughts. It encourages people to use imagination and to think “out of the box.” Brainstorming is particularly useful when not a lot of real data is available to support decision making, when problems and issues need to be identified, and when new solutions are required. The method is relatively easy to use and does not need a lot of time commitment.
How to use the technique
First of all, a team of people knowledgeable about the aspects that are going to be brainstormed should be assembled. For a successful/productive use of brainstorming, a facilitator (ideally independent—someone who is not affected by the outcomes and therefore unbiased) is needed. The facilitator guides the team throughout the method, and can use prompts and triggers to encourage and direct the thinking of the group. Moreover, a brainstorming process can incorporate rules and also set targets that the facilitator explains to the group at the very beginning of the process. The required (or desired) outputs of the session need to be defined so that there is a goal in mind for all the participants. All the points that are mentioned by the group should be put on a list, without filtering or evaluating the ideas or discussing their appropriateness. The emphasis should be on quantity rather than quality—the assumption here is that if you generate a sufficient number of solutions or ideas, there is bound to be at least one (hopefully a few more) very good ones! The brainstorming is completed when a set time runs out, there are no more new points to be added by the group, or the facilitator decides that the aims of the session have been achieved.
THE FACILITATOR
The key to successful brainstorming is the personality of the facilitator. A good facilitator exudes enthusiasm and invigorates the group, extracting the most out the people and getting them to work together to produce creative output. The facilitator should be knowledgeable in the subject, but not necessarily an expert. Knowledge in the subject is essential for the facilitator to tease out initial ideas from the group members, to ask follow-up questions encouraging the group to think the solutions through. The facilitator must also act as the “law enforcement officer, channeling the group’s energies and discussions in the right direction, stopping “illegal” conversations that digress from the key purpose, ensuring progress against time and required outcomes, while playing the “winning the hearts and minds” game.
You can use brainstorming for several steps in the TIRM process. In particular, brainstorming is useful for information risk identification in process steps B1 to B4 (see Chapter 7) and for information risk treatment identification in process steps C1 and C2. Brainstorming is obviously used if the task is carried out by a team of people, or if more than one person is affected by the problem being investigated. Feasibility is also a criteria—it might just not be practical to bring the different people together to perform brainstorming, in which case, a structured/semi-structured interview with each person might be a more practical solution. For instance, when identifying information quality problems, the facilitator can use a list of critical information quality dimensions as a prompt. For information risk identification, the team should be knowledgeable about the business processes, how information is used, and the organization overall, whereas information risk treatment would require the team to be knowledgeable about different information risk treatment options and the information risks that should be treated.
![]() EXAMPLE
EXAMPLE
An example of information risk in a management consulting company may arise when the customer data is not adequately shared across the enterprise. To identify innovative information risk treatment options as part of the TIRM process, a brainstorming session can be organized. The TIRM facilitator invites three general managers—a change management expert, a principal consultant, and a business process manager—who “feel the pain” of the problem and could create business solutions to the problem, and two people from the IT department who cover knowledge about potential IT solutions to treat the information risk. The TIRM facilitator prepares a stream of thoughts to start off the session. She explains the details of the information risks discovered during the information risk assessment stage. Then, the brainstorming session commences by asking “What might be the reasons for the poor level of quality about our customer data, which is shared across the business?” to identify the causes of the information risk for process step C1. Each one of the participants adds, one by one, a further potential cause of the information risk to the list. At the end, the list is sorted according to the perceived importance of the participants. Then, the TIRM facilitator asks the group to come up with potential information risk treatment solutions that are first simply added to the list as part of process step C2. Afterwards, the group discusses each information risk treatment option.
Semi-structured and structured interviews
Brainstorming is a group activity, whereas interviews are based on an individual. That said, you could use interviews with a number of different people (e.g., those who might have participated in a brainstorming session) when the group cannot be brought together due to some constraint such as clash of schedules. In some situations, a free flow of ideas is not appropriate and more structure is required. A facilitator who prompts questions to the interviewee is also needed. A semi-structured interview also follows a defined structure, but leaves room to discuss issues as they arise. Interviews are particularly useful to gather the opinions of different stakeholders. They are relatively time consuming for the facilitator, but allow more time to explore and discuss relevant issues in more depth. Semi-structured and structured interviews can be applied throughout all stages and steps of the TIRM process.
How to use the technique
Regardless of whether you are planning to conduct a structured or semi-structured interview, the key to success is preparation. The facilitator/interviewer must have a clear set of objective(s) for the interview. A structure or framework that breaks down the higher-level objectives into smaller objectives might help in deciding what to ask during the interview. The interview session needs to be carefully prepared by identifying a list of appropriate questions that are used to guide the interview. A question can be followed by alternative routes of a set of questions, depending on the answer given. For example, some questions might be left out if an information resource is not used (e.g., How often is the information resource used? How is the information resource accessed?), or some questions could be added depending on the answer to the question. Questions should be open-ended to give the interviewee the possibility of expressing his or her opinion. Depending on the goal of the interview, the degree of flexibility of the interview should be determined. During the interview, the questions are read out by the facilitator to all of the interviewees and the answers are, if possible, recorded and transcribed, or at least documented by taking notes, and analyzed after the interview. Interviews of this nature can be done in a far more conversational manner, particularly if the interviewer is knowledgeable in the subject area concerned.
![]() EXAMPLE
EXAMPLE
For understanding the external environment in step A2 (see Chapter 6), different stakeholders in the company are interviewed using a semi-structured questionnaire. The following questions are used by the facilitator to guide the interviewee through the interview:
1. What are important aspects of the social and cultural environment for the organization?
2. How would you define the political, legal, and regulatory environment?
3. Are there any important points regarding the financial environment?
4. How would you describe the technological environment?
5. How competitive would you say is the market that the company operates in?
The interview is conducted separately for each major business with one representative to get a unified view of the external environment.
Delphi method
Similar to brainstorming, the Delphi method requires a group of experts to provide their judgments, but unlike brainstorming, the input is collected independently from each expert who needs to be able to express their opinions clearly enough in written language. It is a good way to engage with key stakeholders and can help to avoid political and personal issues, as the experts provide their answers anonymously, which can bring out insights that would remain hidden otherwise. The method is relatively time consuming since it typically consists of several rounds, and it can sometimes be difficult to consolidate the results from different experts. The strength of this method is that it helps to build a consensus between different stakeholders. Like the previous two methods, you can apply the Delphi method throughout the TIRM process to obtain input from stakeholders.
To apply the Delphi method, a semi-structured questionnaire has to be developed. The questionnaire is aimed at capturing the judgments of the experts, which have to be tested. Then, a sufficient number of appropriate experts have to be identified. The experts will receive the questionnaire. Each expert answers the semi-structured questionnaire individually and anonymously in written form. The experts do not see the answers of other experts before they submit their own judgments. The responses are analyzed, combined, and sent back to the experts, accompanied by a second semi-structured questionnaire that aims to clarify disagreements. Afterwards, experts have the option to change their previous opinion as they see the summarized responses from the first round. The process is repeated until consensus among the experts is reached.
![]() EXAMPLE
EXAMPLE
For step B5 of the TIRM process (see Chapter 7), stakeholders are asked to identify consequences of information quality problems that appear during information usage in a particular business process. A questionnaire with a list of previously determined information quality problems is sent to each business process representative, who are asked to think of potential direct and intermediate consequences of these problems. The results are gathered and analyzed by the TIRM process facilitators and then sent back to the business process representatives in a consolidated form (i.e., a list of direct and intermediate consequences for each information quality problem). Seeing the results from the other stakeholders in an anonymous, summarized form allows them to rethink their own position, and if convenient, resubmit their view of the direct and intermediate consequences of the information quality problems, including a short textual description of their rationales behind these consequences. They can also state the disagreement with the summarized results and give an explanation as to why they disagree. This goes back to the TIRM facilitators who, again, analyze and consolidate the results and check if there is sufficient agreement among the business process representatives. If not, the process is repeated until there is sufficient agreement.
Checklists
Checklists help to make sure that all frequently occurring items are captured based on historical experiences within the organization or current best practices. Using checklists is a less creative process than brainstorming, interviews, and the Delphi method, but it has the advantage of making sure that all commonly found issues are covered.
First, the scope of the application of the checklist needs to be defined. This can be, for example, a particular step during the TIRM process. Then, an appropriate checklist needs to be created or identified. Checklists can be based on historical data from within or outside the organization. Finally, the checklist is applied by checking for each element on the list to see if it is actually occurring in practice.
A checklist is particularly useful for all steps that have to identify something, and where it is possible to find or create an appropriate checklist. This can include most process steps in stage A, process steps B1 to B6 during information risk identification, and to identify root causes of information quality problems in step C1 and during information risk treatment identification in step C2.
![]() EXAMPLE
EXAMPLE
A fast-food chain applies the TIRM process and uses checklists at two points during the process. In step B3, a list of information quality dimensions is used to check if a problem occurs for each dimension. In step C1, a list of frequently identified root causes of information quality problems is used that is based on a research report that analyzes information quality root causes in the fast-food industry.
Monte carlo simulation
The Monte Carlo simulation is a method that allows you to obtain results when modeling the problem mathematically and/or finding that an analytical solution is too complex. Many software tools are available to assist in helping build Monte Carlo simulations, such as the TIRM pilot software tool presented in Chapter 12.
The Monte Carlo simulation uses algorithms that can be run on any computer that creates a large amount of random numbers of a chosen distribution. First, the elements that should be represented and appropriate distributions are chosen for the simulation. Then, mathematical calculations are defined that should be executed on these elements and the number N of simulation runs has to be determined. The simulation generates N random numbers that follow the defined distribution for each of the elements and executes the calculations N times. The average, variance, and confidence intervals can be then calculated to summarize the results of these calculations.
The model, as presented in Chapter 5, is used to make the risk calculations for TIRM process step B9. The Monte Carlo simulation allows the collection of quantitative inputs for TIRM process steps B1 to B7 in the form of a probability distribution, instead of using exact values, which are often difficult to get. It makes it easier for experts to provide these quantitative inputs. For each input a statistical distribution is chosen. Commonly used distributions for Monte Carlo simulations are the uniform distribution, triangular distribution, and normal distribution. The uniform distribution assumes that values are equally distributed between a lower and upper boundary, which requires the expert to estimate a lower and upper boundary as the input. Additionally, the triangular distribution needs an estimate of the mode (i.e., the most likely value), therefore, values are assumed to be in the triangle between the lower and upper boundaries and the mode. The normal distribution also requires the estimation of a lower and upper value as the input, assuming that these are the points between which 95% of the values are supposed to lie and that values follow a normal distribution curve.
![]() EXAMPLE
EXAMPLE
The business process representatives cannot give the exact value for the probability of an information quality problem in TIRM process step B3. But, they do note that the probability of the information quality problem is very likely to be between 30% and 50%. Therefore, 30% and 50% are used as the parameters for the uniform distribution. At the end, in process step B9, risk totals are calculated using the Monte Carlo simulation, which simulates the results by using these parameters as the input.
Risk indices
Risk indices are a profiling methodology that quantify risk levels by examining a range of factors associated with an activity. Numeric scores are allocated to each factor; the resulting scores are a composite enabling comparisons to be made. Undertaken regularly, they can be used to measure changes in the levels of risk. The technique can be used in process step B7 in cases when it is not possible to estimate the likelihood and impact of a consequence.
A risk index is a semi-quantitative measure of risk that is calculated using an ordinal scale. An ordinal scale extends the information of a nominal scale to show order—that is, one unit has more of a certain characteristic than another unit. Scores are applied to each component (e.g., probability, exposure, consequence) or for factors, which increase risk. The result is a composite (a series of numbers) that can be compared with other indices and enable ranking of the levels of different risks.
Developing an index is an iterative approach; a number of different systems for combining the scores may be required before the index is validated.
![]() EXAMPLE
EXAMPLE
In applying the TIRM process at a telecommunications company, the impact of poor data quality regarding Internet usage (leading to incorrect billing) on customer satisfaction was found to be critical. However, customer satisfaction is often hard to measure in real terms (a company may choose to quantify customer satisfaction in terms of potential customers lost, but this often is very difficult to estimate). Therefore, risk indices are used instead, which are measured on a numeric scale from level 1 to 5. The company can define clearly what each level means in quantitative terms in different dimensions. For instance, level 1 could mean a small impact on customer satisfaction, with no potential customers lost and no complaints registered. Level 2 could mean no potential customers lost, but complaints being registered by a minority of customers. This could progress all the way to level 5, which could mean a significant loss of customers and complaints being registered with the regulators, potentially leading to an investigation.
Structured “what if” technique
The structured “what if” technique (SWIFT) is a systematic team-oriented technique for risk identification. Originally developed for use in identifying hazards in chemical processing plants, SWIFT has since been adapted to fit many other situations. It utilizes a set of “prompt” words or phrases to help a team identify risks, such as “What if …?” or “How could …?” or “Has anyone ever …?” It can be used to identify risks for further quantitative evaluation or alternatively provide a qualitative evaluation of risks and recommend action to manage those risks. This technique can be used for information risk identification as part of TIRM process steps B1 to B5. In particular, it can help identify low-probability, high-impact information risks.
There is no single standard approach to SWIFT. This is one of its benefits—it is flexible and can be adjusted to suit the particular circumstances. A suggested way forward is:
![]() A team is brought together under the direction of a facilitator. The team should comprise individuals who are experienced in the systems/processes being analyzed.
A team is brought together under the direction of a facilitator. The team should comprise individuals who are experienced in the systems/processes being analyzed.
![]() Define and agree on the systems/processes and scope of the study.
Define and agree on the systems/processes and scope of the study.
![]() Discuss known risks and hazards, previous experience and incidents, known and existing controls and safeguards, and regulatory requirements and constraints.
Discuss known risks and hazards, previous experience and incidents, known and existing controls and safeguards, and regulatory requirements and constraints.
![]() Discussion facilitated by using prompts “What if …?” or “What would occur if …?” or “Could someone or something …?”
Discussion facilitated by using prompts “What if …?” or “What would occur if …?” or “Could someone or something …?”
![]() Summarize the risks and consider what controls are in place.
Summarize the risks and consider what controls are in place.
![]() Confirm the description of the risk, and its causes, consequences, any safeguards, frequency, and consequences.
Confirm the description of the risk, and its causes, consequences, any safeguards, frequency, and consequences.
![]() Consider if the controls are effective; if not, consider risk treatment tasks and define potential controls. Further “What if …?” questions are asked to identify other risks.
Consider if the controls are effective; if not, consider risk treatment tasks and define potential controls. Further “What if …?” questions are asked to identify other risks.
![]() The facilitator uses the prompts to monitor discussions and suggest additional issues and scenarios for discussion.
The facilitator uses the prompts to monitor discussions and suggest additional issues and scenarios for discussion.
![]() Rank the actions created by prioritizing them; use a qualitative or semi-quantitative risk assessment method, taking into account the existing controls/safeguards and their effectiveness.
Rank the actions created by prioritizing them; use a qualitative or semi-quantitative risk assessment method, taking into account the existing controls/safeguards and their effectiveness.
![]() EXAMPLE
EXAMPLE
As part of identifying information quality problems in an airport, the TIRM facilitator may choose to use the SWIFT technique with representatives from the fuel company and the catering services organizations to identify information quality problems that can potentially occur due to lack of data sharing between the airport, airlines, and these companies. Examples of questions the facilitator may ask are:
![]() “What if a plane gets delayed? Do you get the information instantly from the airport management?”
“What if a plane gets delayed? Do you get the information instantly from the airport management?”
![]() “What would occur if there is a delay in this information being shared?”
“What would occur if there is a delay in this information being shared?”
![]() “What if the delay results in gate changes? Does this information get fed to your systems?”
“What if the delay results in gate changes? Does this information get fed to your systems?”
![]() What if the information is shared to your systems, but key decision makers are not notified of the changes instantaneously?”
What if the information is shared to your systems, but key decision makers are not notified of the changes instantaneously?”
Scenario analysis
Scenario analysis is a model for learning about the future. Scenarios are descriptive models that take into account uncertainties and factors that are complex and do not easily lend themselves to quantitative analysis. Scenario analysis can be used to identify risks by considering possible future developments and exploring their implications. Like the SWIFT technique, scenario analysis is particularly useful to identify information risks that are “out of the box,” or to analyze information risks in different ways to better understand their potential likelihood and impact. The technique can be applied during process steps B1 to B7.
Scenario analysis typically involves the following processes:
![]() Team formed of individuals who have an understanding of the issues and can think in “big picture” terms.
Team formed of individuals who have an understanding of the issues and can think in “big picture” terms.
![]() Participants discuss how they see the future unfolding—consider micro and macro changes in society, technology, politics, governance, etc. These discussions, which reveal perceptions about trends and interrelationships, are often based on intuition and insights.
Participants discuss how they see the future unfolding—consider micro and macro changes in society, technology, politics, governance, etc. These discussions, which reveal perceptions about trends and interrelationships, are often based on intuition and insights.
![]() The team identifies key internal and external uncertainties. The trends and uncertainties are combined into plausible yet wide-ranging scenarios.
The team identifies key internal and external uncertainties. The trends and uncertainties are combined into plausible yet wide-ranging scenarios.
To develop the scenarios, it may be useful to group the negative elements in one scenario and the positive elements in another one. Although these scenarios can sometimes be extreme, they offer a starting point for the development of different yet plausible scenarios.
One of the first organizations to use scenarios was Shell. Since the 1970s their “Shell Scenarios” have gained a global acceptance among governments, academia, and other businesses. Their approach starts with a series of interviews to capture intuition and insights. The process then moves into a phase of workshops and research, in which ideas are gathered, shared, tested, and linked. The final step is crafting stories that embody the critical challenges that have emerged from the process.
![]() EXAMPLE
EXAMPLE
The TIRM facilitator discusses with the business process representatives how particular information risks could evolve in the future, and when changes within the organizations or within the marketplace could happen. This enables the identification of potential future information quality problems in step B3 and potential future consequences as part of step B4 in such situations.
FN curves
FN curves or FN diagrams are used to graphically represent the likelihood and consequence of an undesirable event, which helps with evaluating information risks. The name FN curve comes from the use of the technique for accidents and catastrophes, where Fmeans how frequently a consequence occurs, and N denotes the number of casualties or injuries that are affected by this particular consequence. The technique can be used for TIRM process step B7 during analysis of the impact and likelihood of consequences. The output helps to evaluate and compare information risks in step B9.
The frequency and impact of a consequence is plotted using an FN curve (Figure 11.1). Two lines are drawn that separate the curve into three distinct regions: (1) below the first line are the levels at which the risk is broadly acceptable, (2) below the second line are the risks that are tolerable and should be treated only if the benefits exceed the costs, and (3) above the second line the risks become intolerable and always have to be treated.
![]() EXAMPLE
EXAMPLE
A public transport authority suffers from inaccurate signaling data, which occasionally leads to minor up to major train accidents if signaling equipment remains unmaintained or is not repaired when necessary. In process step B7, an FN curve is drawn that shows the yearly expected frequency of accidents resulting from this information quality problem against the number of injuries that are caused by the accidents.
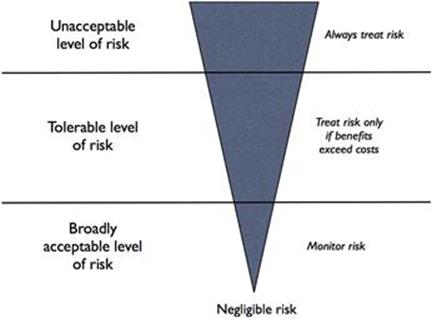
FIGURE 11.1 FN curve.
Root cause analysis
Root-cause analysis (RCA) is a popular method of solving problems that tries to identify the failure mechanisms or the fundamental causes of faults or problems. In the context of TIRM, the RCA can be used to identify the factors that resulted in the nature, magnitude, location, and timing of information quality problems to identify what needs to be changed to prevent recurrence of similar problems. RCA can also be used to identify the lessons to be learned to promote the achievement of better information quality.
When investigating the root causes of information quality problems it is important to think of various categories of causes such as technology (including systems), organizational (including business processes, culture, rules, policies), and people (individual and team behavior, competency, skills, motivation, etc.).
RCA is primarily used as a reactive method of identifying causes, revealing the key problems with a view to solving them. In the context of TIRM, although RCA is performed retrospectively to understand the reasons for poor data quality (i.e., after the “disruptive event” has occurred), insights from the RCA will be useful as a proactive method to forecast or predict probable data quality problems in the future, and indeed to predict any residual data quality problems after improvement. In addition, investigating the root cause of a minor information risk could help prevent it from becoming a major one or a more frequent event.
The general procedure to conduct a RCA is as follows:
1. From the necessary business functions, build a team of experts who are qualified and motivated to explore the problem.
2. Define the information quality problem factually. Include the qualitative and quantitative attributes (properties) of the harmful outcomes. This usually includes specifying the natures of the consequence, the magnitudes, the locations (or business functions), and the timings of possible adverse events.
3. Gather data and corresponding evidence, classifying it along a timeline of events to the final failure or crisis. For every behavior, condition, action, and inaction specify in the timeline what should have been done when it differs from what was done. Typically, this would involve the development of an information flow map across the organization (where time and resources are limited, this analysis could be restricted to the business functions or information systems of interest).
4. Ask why and identify the causes associated with each step in the sequence toward the defined information quality problem. “Why” is taken to mean “What were the factors that directly resulted in the effect?”
5. Classify causes into causal factors that relate to an event in the sequence, and those root causes, which if eliminated, can be agreed to have interrupted that step of the sequence chain.
6. Identify all other harmful factors that have equal or better claim to be called root causes. If there are multiple root causes, which is often the case, reveal those clearly for later optimum selection.
A common obstacle is to identify the stopping condition to digging into the root cause. In the context of information risk analysis, we suggest that the analysis be stopped at the point beyond which the organization cannot exert meaningful and reasonable control over the events. For instance, the primary cause for improper data collection performed by an employee could be the lack of expertise in using data collection equipment. Going further (asking why there is a lack of expertise), the answer could move in the direction of personal issues such as financial constraints that resulted in the lack of education. However, such an analysis is meaningless, as the organization would be unable to rectify those issues (especially if they are past events). However, stopping the analysis at “lack of expertise” might be more meaningful, as the organization might be able to redress the problem by providing proper training to the employee, or indeed replacing the employee with someone with the necessary skills.
![]() EXAMPLE
EXAMPLE
One of the popular techniques used for RCA is Ishikawa diagrams (also known as fishbone diagrams). An example of exploring the causes of a particular information quality problem using an Ishikawa diagram is shown in Figure 11.2. In this example, a company is faced with difficulties in accessing and interpreting data. The possible causes are classified into three broad categories: technology-related causes, people-related causes, and organizational issues. Under technology, the key problem that was identified was the lack of proper functionality of the IT systems. This is further investigated to identify the reasons for the lack of functionality, as shown in the figure.
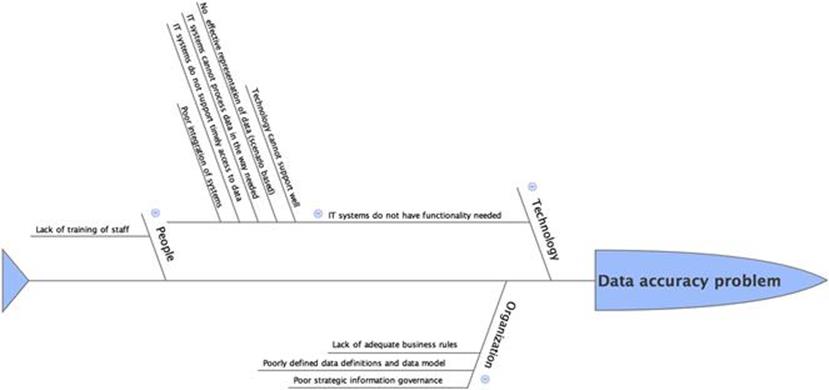
FIGURE 11.2 Ishikawa diagram example.
Failure mode effect and criticality analysis
Failure mode effect criticality analysis (FMECA) is one of the first systematic techniques for risk analysis developed by reliability engineers in the 1940s to study problems that might arise from malfunctions of military systems. This is one of the most established and prevalent techniques in use in most industrial organizations, and the technique that has the most similarity with the TIRM risk assessment phase. There are a number of military and industry standards for FMECA, MIL-P-1629 being the earliest one, published by the U.S. military in 1949. CENELEC published the European standard IEC 60812 in 2006 on FMECA.
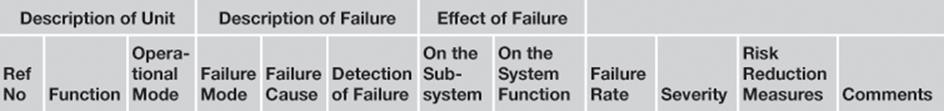
From a general perspective, FMECA involves reviewing the components, assemblies, and subsystems in, say, equipment to identify the different ways in which they can fail (failure modes), and their causes and effects. For each component, the failure modes (and their probability of occurrence) and their resulting effects (and the severity of the effects) on the rest of the system are recorded in a specific FMECA worksheet (Table 11.2).
Table 11.2
FMECA Worksheet
FMECA in its raw form is a full inductive “forward-logic” analysis. However, the failure probability can only be estimated or reduced by understanding the failure mechanism. Therefore, it is important to include RCA along with the FMECA.
Considering that FMECA is predominantly used in the context of failure of physical systems (and in some cases failure of IT systems as well), in the context of TIRM, we need to draw some parallels between the typical terminology used in FMECA and information risks (which in other words is a result of an information system failure; see Table 11.3).
Table 11.3
How to Use FMECA as Part of TIRM
|
FMECA Terminology |
TIRM Equivalent |
|
Failure |
Poor information quality |
|
Failure mode |
Information quality problem/dimension |
|
System |
Information system |
|
System function |
Business function |
|
Failure rate |
Probability that information quality problem appears × probability that the information is used in a business task × the frequency of task execution |
|
Severity |
Impact of a consequence on business objectives |
|
Risk reduction measures |
Risk controls |
Conducting a FMECA on information risks would involve the following steps:
1. Identify the different information quality problems that result from the information resource (step B3 in TIRM) (i.e., the failure modes).
2. Describe the effects of the information quality problem that can actually appear (step B4 in TIRM).
3. Describe how this information quality problem is detected (if it can be detected).
4. Estimate the inherent provisions that are to be provided in the design of the information system or the management system to compensate for these problems (step B6 in TIRM).
5. Describe the criticality of these failure modes in terms of the probability of the effect and the consequence of the effects (step B7 in TIRM).
![]() EXAMPLE
EXAMPLE
An example of a FMECA worksheet that can be used for information risk assessment is shown in Table 11.4.
Table 11.4
FMECA Worksheet Example

Fault-tree analysis
Fault-tree analysis (FTA) is a deductive technique mainly used in safety and reliability engineering for analyzing failures. FTA is applicable in scenarios where an undesired state of a system can be examined using Boolean logic to combine a series of causes. It is used to build a logical understanding of the conditions that cause system failures. Consequently, FTA can be applied for analyzing the reasons for information quality problems in a logical and structured manner. Moreover, due to the mathematical nature of Boolean logic used in FTA, this technique can also be used to calculate the likelihood of information quality problems and their consequences. FTA is described in several industry and government standards, including the European standard IEC 61025. Similar to RCA, this technique can be used in the information risk treatment phase for analyzing the causes of information quality problems (TIRM process step C1). Moreover, conducting FTA early on in the TIRM process (i.e., not doing it as part of stage C, but within stage B when assessing the information risks) will help in quantifying the probability and the impact of information quality problems.
In the context of TIRM, FTA can be used for:
![]() Identifying the reasons for information quality problems.
Identifying the reasons for information quality problems.
![]() Identifying the pathways from business impact to information quality problems (backward analysis).
Identifying the pathways from business impact to information quality problems (backward analysis).
![]() Quantifying the probability of information quality problems.
Quantifying the probability of information quality problems.
![]() Quantifying the probability of business impacts.
Quantifying the probability of business impacts.
The “undesired effect” is taken as the root or top event of the tree of logic. The undesired effect could either be taken as the business impact or the information quality problem. Traditionally in FTA, only one undesired effect is considered at a time, therefore, there will only be one top event. However, when using FTA for information risk analysis, multiple undesired effects need to be considered in a single analysis since there could be many interdependencies between information quality problems and business impact (e.g., one problem affecting multiple business objectives).
Once the undesired effect is identified, each situation that could cause the effect is added to the tree as a series of logic expressions. Such trees are also known as fault-tree diagrams. Once each node in the tree is labeled with probabilities, the resultant probabilities of the undesired effect can be then computed. It is possible to use software tools to make the calculations.
![]() EXAMPLE
EXAMPLE
Figure 11.3 shows an example of a fault-tree diagram exploring the possible causes of data unavailability and unusability.
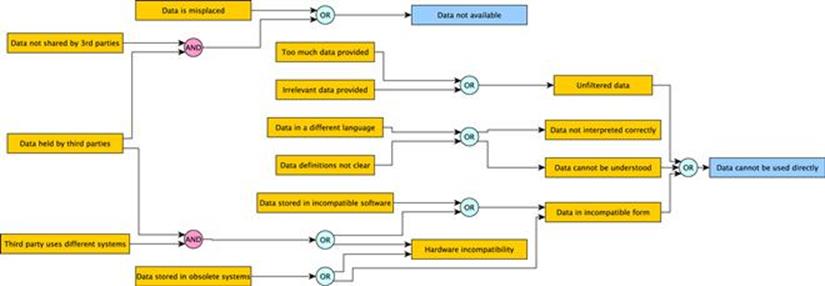
FIGURE 11.3 Fault-tree analysis.
Bow-tie diagrams
Bow-tie diagrams (Figure 11.4) are a risk evaluation technique that can be used to analyze and demonstrate causal relationships between a sequence of causes of an undesired event, and the sequence of outcomes of the undesired event. For example, the sequence of causes could be the improper training of personnel leading to improper inspection of sensors leading to faulty sensors; an undesired event could be data inaccuracy; and the sequence of outcomes of the undesired event could be the wrong maintenance decision leading to machine failure leading to production loss leading to drop in profit.
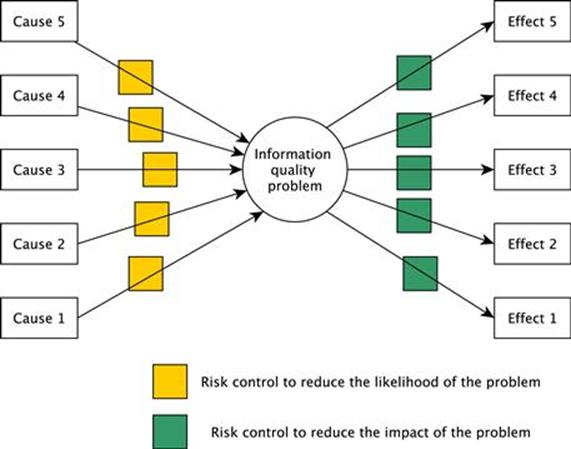
FIGURE 11.4 Bow-tie diagram.
In addition to the causal relationships, bow-tie analysis also identifies the possible control measures that can be put in place to reduce or eliminate the likelihood of the undesired event (also known as preventive controls), and also to reduce the impact of the undesired event (also known as recovery preparedness).
Essentially, the key steps in performing a bow-tie analysis are:
1. Establish the links between causes and the information quality problem (e.g., using RCA).
2. Establish the links between the information quality problem and its consequences (e.g., using FMEA).
3. Identify existing risk controls in place on both sides of the bow tie.
4. Identify risk treatment solutions to reduce the risk (either the likelihood or the impact).
In the context of TIRM, this technique is applicable for analyzing information risks as well as identifying information risk treatment methods. Specifically, the right side of the bow-tie diagram is useful for identifying and visualizing the chain of consequences arising from information quality problems right up to the impact on business objectives. The left side of the bow-tie diagram is useful for identifying and visualizing the different causes of the information quality problem and existing controls to manage the risk. Once the bow-tie diagram is completed, the analyst can examine both sides of the bow tie to identify possible treatment options and evaluate them.
Risk matrix
Risk is defined as the product of the probability (or frequency) and the impact (or severity) of the consequence of an undesired event. A risk matrix is a graphical technique used during risk assessment to explicitly represent different levels of risks as the product of probability and severity of the consequences of the undesired event on a numeric/verbal scale. Table 11.5 shows examples of numeric and verbal scales.
Table 11.5
Risk Matrix
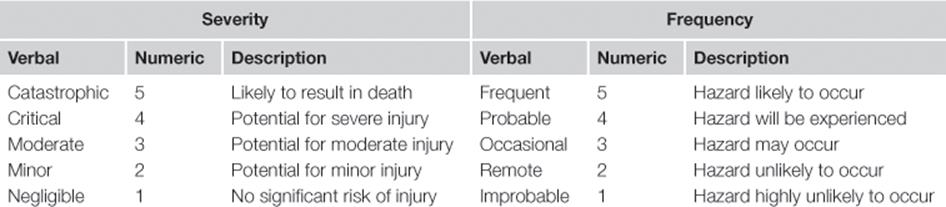
Once these scales are identified, it is easy to come up with a numeric matrix, where one can highlight the risk “zones” in terms of their level of acceptability; see the example in Figure 11.5.
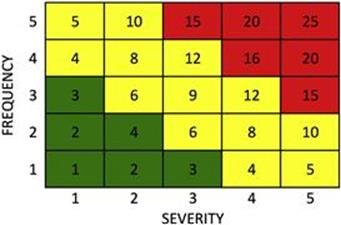
FIGURE 11.5 Risk matrix.
In the risk matrix shown in the figure, we have a low-risk (acceptable risk, no action needed) grey (green in online version) zone and a high-risk (unacceptable risk, immediate action required) very dark grey (red in online version) zone. Evidently, there is a rather large light grey (yellow in online version) zone, where the risk tolerance is unclear. For risks that fall into this zone, further analysis might be required to determine what action (if any) needs to be taken. The highly visual nature of this technique makes it very suitable for presentation of risks to executive decision makers and to aid business decision making.
Although risk matrices are very popular in many industries, the technique is often criticized for its poor resolution and ambiguity. However, these shortcomings are mostly associated with particular implementations of the technique instead of being a problem with the technique itself.
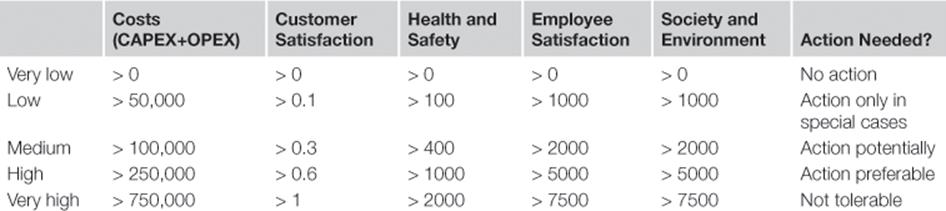
The key starting point in the development of an information risk matrix is to identify the organizational objectives, measurement units, and risk criteria (step A4). For instance, a company may identify different business objectives to be considered for the analysis, develop numeric scales for each objective, and assign risk tolerance levels as shown in Table 11.6.
Table 11.6
Risk Criteria
After performing information risk assessment steps B1 to B8, the risk matrix can be used to present a one-shot quick overview of various risks and help in ranking. An example of such a risk matrix is shown in Figure 11.6, where a scale of 1 to 4 is applied to the different consequences arising from an inaccurate asset register.
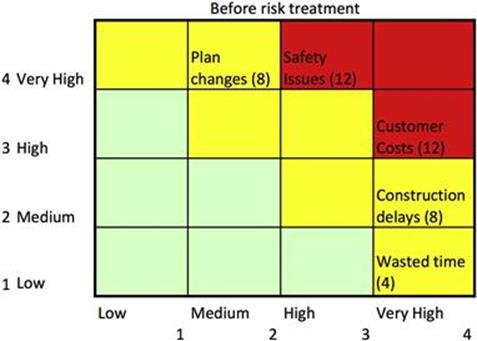
FIGURE 11.6 Risk matrix example.
Clearly, the safety issues and customer costs lie in the high-risk category, and therefore this information quality problem is a good candidate for further investigation and rectification.
Summary
The message of this chapter is clear and simple: there is no need to reinvent the wheel. The critical thing is to effectively embed TIRM within the risk management practices in the organization. Since TIRM is derived and based on fundamental risk management theory and practice, it is quite straightforward to adapt and adopt existing tools and techniques to information risk management. This chapter provides a glimpse of how this can be achieved using a few examples found in risk management practice. This by no means is an exhaustive list of tools. By careful understanding of the similarities and differences between information risks and other types of risks, other tools can also be used in appropriate areas within TIRM.