Drush for Developers Second Edition (2015)
Chapter 3. Running and Monitoring Tasks in Drupal Projects
Looking at Wikipedia for the definition of a task (http://en.wikipedia.org/wiki/Task), I found two of them. Here they are:
· In project management, an activity that needs to be accomplished within a defined period of time
· In computing, a program execution context
Some examples of tasks in Drupal projects are clearing caches, indexing content into a search engine, or importing content from a third-party API. These can be classified in the following types:
· One-off: This includes Drupal's database updates
· On demand: This includes reindexing all content in Apache Solr
· Periodic: This would be the case of Drupal's cron
Drush is really good at running long tasks in an isolated process. It supports both Batch and Queue APIs, so the workload can be either split into batches or workers, respectively. In this chapter, we will see some tips and examples of best practices to run tasks against a Drupal project using Drush. Here are the main topics:
· Running periodic tasks with cron
· Running a task outside cron
· Running long tasks in batches
· Evaluating code on the fly and running scripts
· Logging messages in Drush
· Redirecting Drush output into a file
· Running a command in the background
Running periodic tasks with cron
The first place to go to set up periodic tasks is Drupal's cron (https://www.drupal.org/cron). Cron is a built-in tool that runs periodically to perform tasks such as clearing caches, checking for updates, or indexing content subject to be searched. Modules canimplement hook_cron() (https://api.drupal.org/api/drupal/modules%21system%21system.api.php/function/hook_cron/7) in order to have their tasks executed via cron.
Drupal's default behavior is to run cron automatically every three hours. It can also be triggered manually through the administration interface or using Drush. Running cron with Drush is desirable for the following reasons:
· Drush runs using a different PHP.ini configuration than the web server that does not have a request timeout. Furthermore, other PHP variables such as memory_limit can be adjusted to higher values, if needed.
· Cron's output can be logged in to a file and monitored, so actions can be taken if there is an error.
· Drush can easily trigger cron on remote Drupal sites.
It is desirable to evaluate which tasks run in Drupal's cron and how often it runs. Here are some examples of what could happen if you don't keep an eye on this:
· If cron takes too long to complete, it won't run at the frequency that you set it to and tasks will pile up.
· If cron has to run tasks A, B, and C, and if task B provokes a PHP error, the whole process will terminate and task C won't be processed. This gets worse over time if the PHP error keeps happening on successive runs as task C won't be processed until the error is fixed.
Disabling Drupal's cron
Drupal has a mechanism to trigger cron automatically by injecting a small piece of AJAX within a client's response, which makes a request to http://mysite.example.com/cron.php?cron_key=some_token. If we are about to trigger Drupal's cron exclusively through Drush, then we should disable this.
Verifying the current cron frequency
The Drupal variable that defines how often cron should be triggered is called cron_safe_threshold. This variable has a default value in Drupal's source code of 10800 seconds (3 hours) while Drush hardcodes it to 0. Let's check the current value of the variable in a clean Drupal project:
$ cd /home/juampy/projects/drupal
$ drush variable-get cron_safe_threshold
cron_safe_threshold: 0
We see that it has a value of 0. However, this time, Drush is fooling us as it hardcodes it to 0 while bootstrapping Drupal. Drupal's variables are first searched in the variable table of the database and then they can be overridden via the global $conf variable (this is normally done in settings.php). Let's look for this variable in the database to see whether it has a value:
$ cd /home/juampy/projects/drupal
$ drush sql-cli
Welcome to the MySQL monitor. Commands end with ; or \g.
mysql> select value from variable where name = 'cron_safe_threshold';
Empty set (0.00 sec)
mysql> exit
Bye
Gotcha! The variable does not exist in the database. Let's open the Cron settings page at Drupal's administration interface to see what is set there:
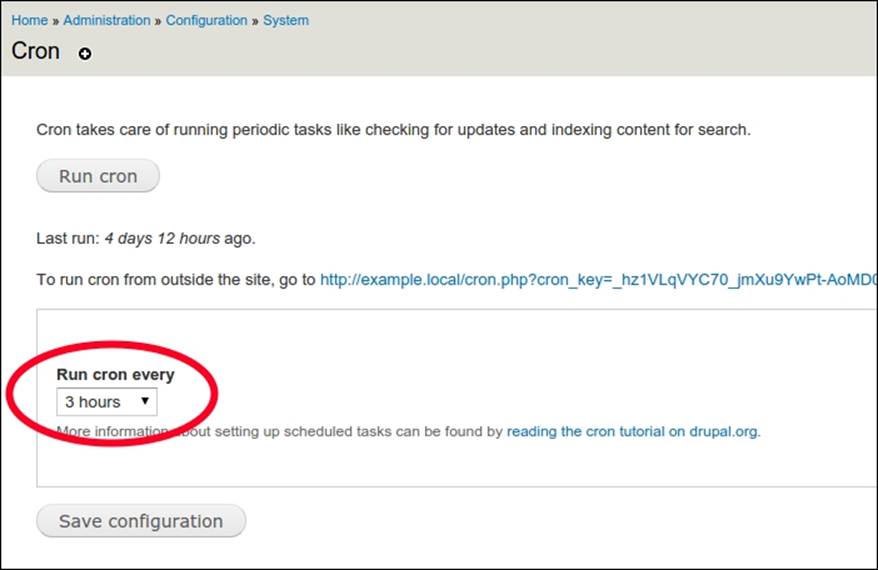
As we can see, it is set to 3 hours. The reason is that Drupal requests the value for this field from the Drupal variable cron_safe_threshold. If this variable is not set, it defaults to the constant DRUPAL_CRON_DEFAULT_THRESHOLD, which has a value of 3 hours. Here is the line of code in Drupal core for this particular page:
# ./modules/system/system.admin.inc:1634:
'#default_value' => variable_get('cron_safe_threshold',
DRUPAL_CRON_DEFAULT_THRESHOLD),
Overriding cron frequency and exporting it to code
Now, we will set this variable to 0 in the database and then export it into code with the Features module, which we have already installed in the previous chapter. In order to export Drupal variables into code, we need to download and install the Strongarm module (https://www.drupal.org/project/strongarm):
$ drush pm-download strongarm
Project strongarm (7.x-2.0) downloaded
to sites/all/modules/contrib/strongarm. [success]
$ drush --yes pm-enable strongarm
The following extensions will be enabled: strongarm, ctools
Do you really want to continue? (y/n): y
strongarm was enabled successfully. [ok]
ctools was enabled successfully. [ok]
Next, let's set the value of the cron_safe_threshold variable to 0 in the database:
$ drush variable-set cron_safe_threshold 0
cron_safe_threshold was set to "0". [success]
Next, we will check whether the right value has been set in the database. Remember that when we looked for it before, the value did not exist in the variable table:
$ drush sql-cli
Welcome to the MySQL monitor. Commands end with ; or \g.
mysql> select value from variable where name = 'cron_safe_threshold';
+----------+
| value |
+----------+
| s:1:"0"; |
+----------+
1 row in set (0.00 sec)
That's correct. We now have the right value in the database as a serialized string, therefore, we can export it into code. The Features module classifies Drupal configuration into component types such as field_base, image, or user_role. The features-componentscommand lists all available components to be exported. Let's figure out the component's machine name for the cron_safe_threshold variable:
$ drush features-components
Enter a number to choose which component type to list.
[0] : Cancel
[1] : all
[2] : dependencies
[3] : field_base
[4] : field_instance
[5] : filter
[6] : image
[7] : menu_custom
[8] : menu_links
[9] : node
[10] : taxonomy
[11] : user_permission
[12] : user_role
[13] : variable
13
Available sources
variable:admin_theme
variable:clean_url
variable:comment_page
variable:cron_key
variable:cron_last
variable:cron_safe_threshold
variable:css_js_query_string
...
We found it. The component machine name is variable:cron_safe_threshold. As this is a site-wide setting, we will create a new module called mysite and store the variable here. This module can also accommodate site-wide custom code:
$ drush features-export mysite variable:cron_safe_threshold
Will create a new module in sites/all/modules/mysite
Do you really want to continue? (y/n): y
Created module: mysite in sites/all/modules/mysite [ok]
Now, we can commit these changes into our version control system and deploy them into other environments, so that Drupal won't run cron automatically once the configuration has been imported with the features-revert command. We are now ready to set up cron with Drush, which we will cover in the following section.
Running cron with Drush
This is how we can run cron with Drush:
$ cd /home/juampy/projects/drupal
$ drush core-cron
Cron run successful. [success]
Some cron tasks, such as indexing content with Apache Solr's search engine, need to know the current hostname. Drush is unable to figure this out by itself, so we will provide this information with the --uri option, as in the following example:
$ drush --uri=http://d7.local core-cron
Cron run successful. [success]
Scheduling cron runs with Jenkins
There are several ways to run cron periodically with Drush. The most common ones are:
· Using Linux's crontab (http://en.wikipedia.org/wiki/Cron), a command-line job scheduler
· Using a Continuous Integration system such as Jenkins (http://jenkins-ci.org)
For the former, there is plenty of documentation within the drush topic docs-cron command, so we won't cover this option although it is worth reading it. The latter has the benefit that it provides a web interface that makes it very easy to monitor and trigger alerts, such as sending an e-mail when Drupal cron fails. In the following section, we will set up Jenkins to run Drupal's cron.
Installing Jenkins
Jenkins can run jobs in the local environment where it is installed and in remote environments, providing a set of SSH credentials (http://en.wikipedia.org/wiki/Secure_Shell). In this case, we will go for the simplest possible example; we will install Jenkins in our local environment to trigger cron for our Drupal project.
The installation process for Jenkins varies depending on the operating system, so refer to the official documentation at https://wiki.jenkins-ci.org/display/JENKINS/Installing+Jenkins in order to get it working.
Once the installation is complete, open http://localhost:8080 in your web browser and proceed to create the job that will run Drupal's cron.
Creating a job through the web interface
We will now create and configure the job that will run and monitor Drupal's cron runs. Let's start by clicking on New Item in the top-left corner of the web interface and fill in the form to create our new job:
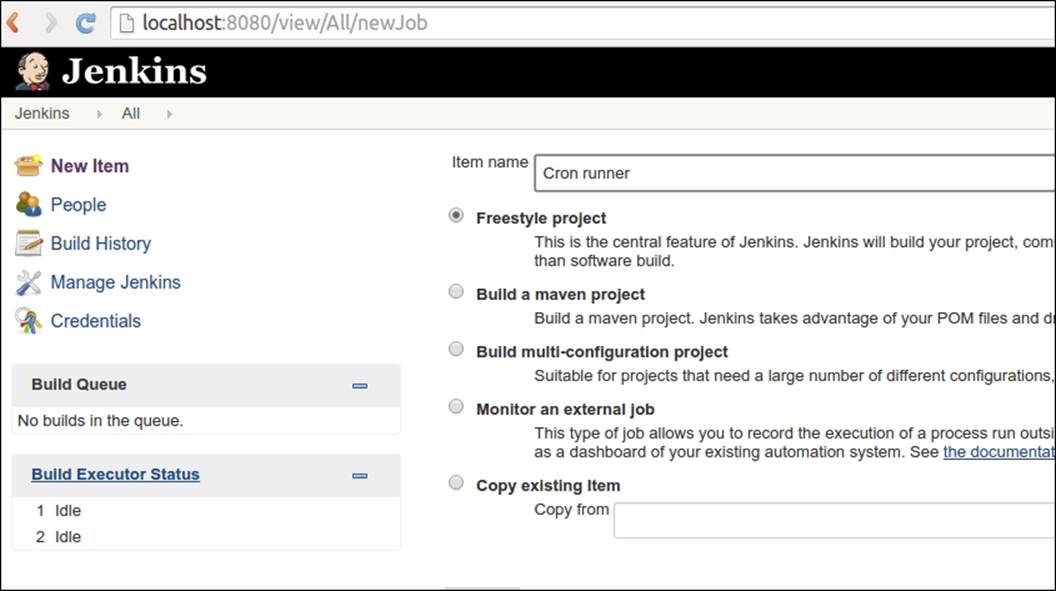
We have called our job Cron runner and chose the Freestyle project type. Once we submit the form, we are redirected to the job settings form. The first thing we want to set is how often this job will run. In the following screenshot, we will set it to run every two hours:
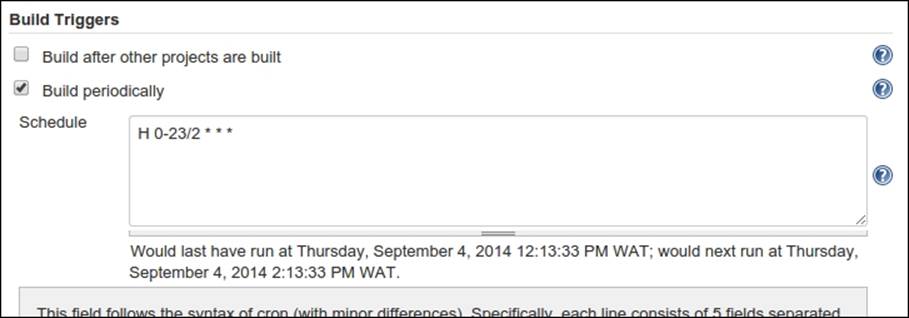
The syntax used to define the frequency of execution is very similar to the one for crontab. This syntax is flexible but tricky, so to make sure we got it right, Jenkins prints a human-readable version of what we entered right under the Schedule text area.
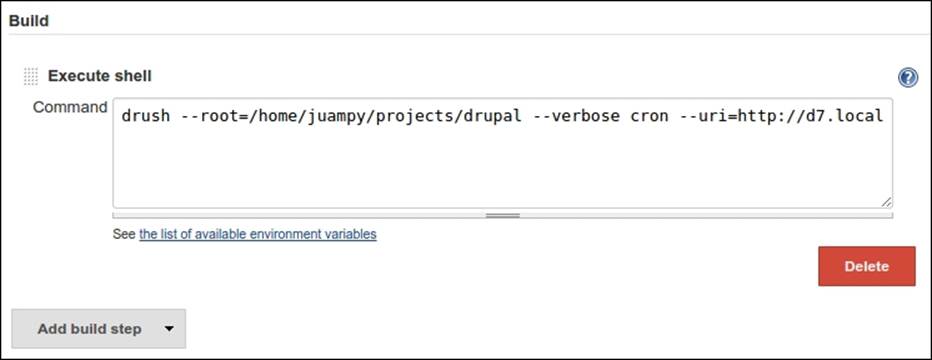
The next section to complete in this form is to add Build steps to the job. For this, we will have just one build step that will consist of running a few commands in order to run Drupal's cron through Drush. The following screenshot illustrates this:
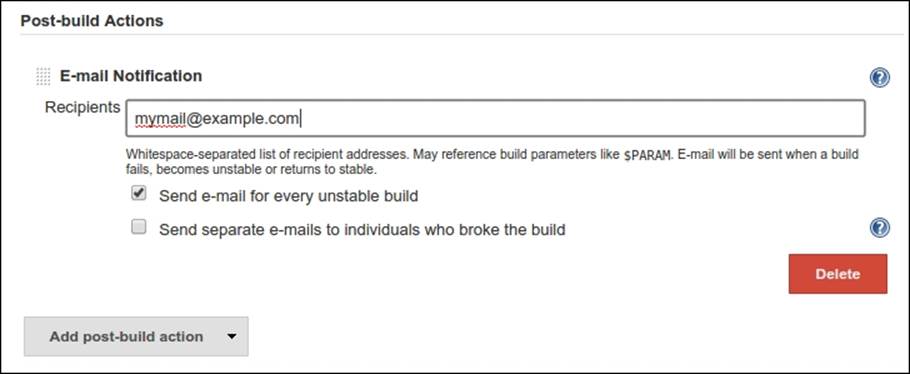
If there are any errors in the preceding step when the job is running, Jenkins will notice them as it will evaluate the output. This is useful for the following section that we will configure: Post-build Actions. We will add an action here to be notified via e-mail if a build fails:
We are done setting up our Jenkins job. We can now click on Save and build the job manually by clicking on Build Now on the left sidebar to test it. Here is the output of the job:
Started by user anonymous
[EnvInject] - Loading node environment variables.
[EnvInject] - Preparing an environment for the build.
[EnvInject] - Keeping Jenkins system variables.
[EnvInject] - Keeping Jenkins build variables.
[EnvInject] - Injecting contributions.
Building in workspace /var/lib/jenkins/jobs/Cron runner/workspace
[workspace] $ /bin/sh -xe /tmp/hudson1449097994163880172.sh
+ cd /home/juampy/projects/drupal
+ /usr/share/drush/drush --verbose cron --uri=http://d7.local
Initialized Drupal 7.29-dev root directory at
/home/juampy/projects/drupal [notice]
Initialized Drupal site d7.local at sites/default [notice]
Indexing node 316. [ok]
Cron run successful.
[success]
Finished: SUCCESS
As we can see from the preceding output, it is like running the command directly. Now, we can let Jenkins take care of running cron for us from now on.
Monitoring cron runs
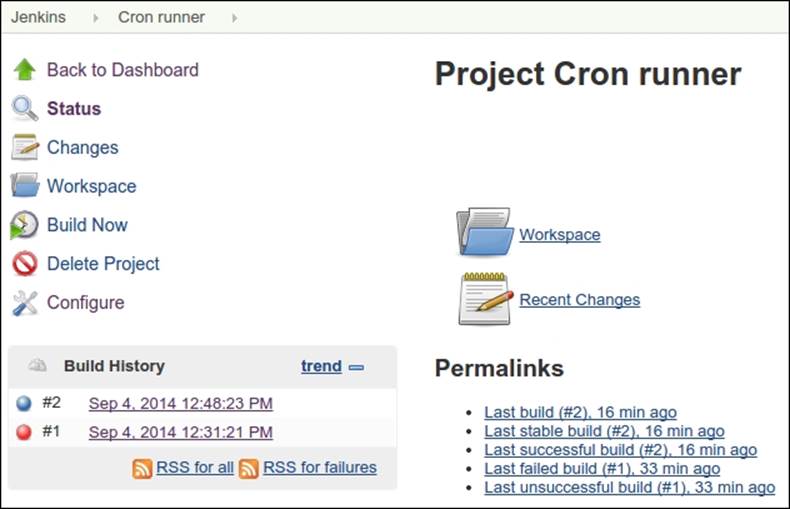
Jenkins will keep a list of past builds with all its related information such as input parameters, start and end time, output, and some useful statistics that will help you figure out the status of the job:
This was just a basic example of how to set up a Jenkins job to run Drupal's cron with Drush. Jenkins has a huge community that maintains a long list of plugins that extend its functionality. You can browse them at the official website (https://wiki.jenkins-ci.org/display/JENKINS/Plugins) or by navigating to Manage Jenkins | Manage Plugins through the administration interface of your Jenkins installation.
Running a task outside cron
So far in this chapter, we have seen how to disable Drupal's automatic cron and how to schedule it to be run by Drush. Now, we have got to the point where we can evaluate whether there are any tasks running at cron in our Drupal project that should be moved out of it.
Here are the reasons why a task that runs within hook_cron() (https://api.drupal.org/api/drupal/modules%21system%21system.api.php/function/hook_cron/7) might need to be moved to its own process:
· The task might take a variable time to complete; sometimes, it will run in a couple of seconds, whereas for others, it might take an hour
· You want to run the task manually if you need to, and enter different input parameters depending on the circumstances
· The task's runtime log is highly valuable; therefore, it has to be saved into a different logfile with its own purging strategy
Whatever the reason, you can run any code within a custom Drush command and then schedule its processing through any of the methods mentioned in the previous section.
Example – moving a Feeds importer from Drupal's cron to Drush
Modules add their tasks to Drupal's cron through hook_cron(). The Feeds module (https://www.drupal.org/project/feeds), for example, can import content from external sources with cron. Let's suppose that we have a Feeds importer that reads BBC's World Service RSS feed (http://feeds.bbci.co.uk/news/world/rss.xml) and creates articles in our Drupal site. We initially configured the Feeds importer to run within Drupal's cron, but for now, we want to create a Drush command that triggers it so that we can run this process out ofhook_cron() in an independent process.
Exporting the Feeds importer into code
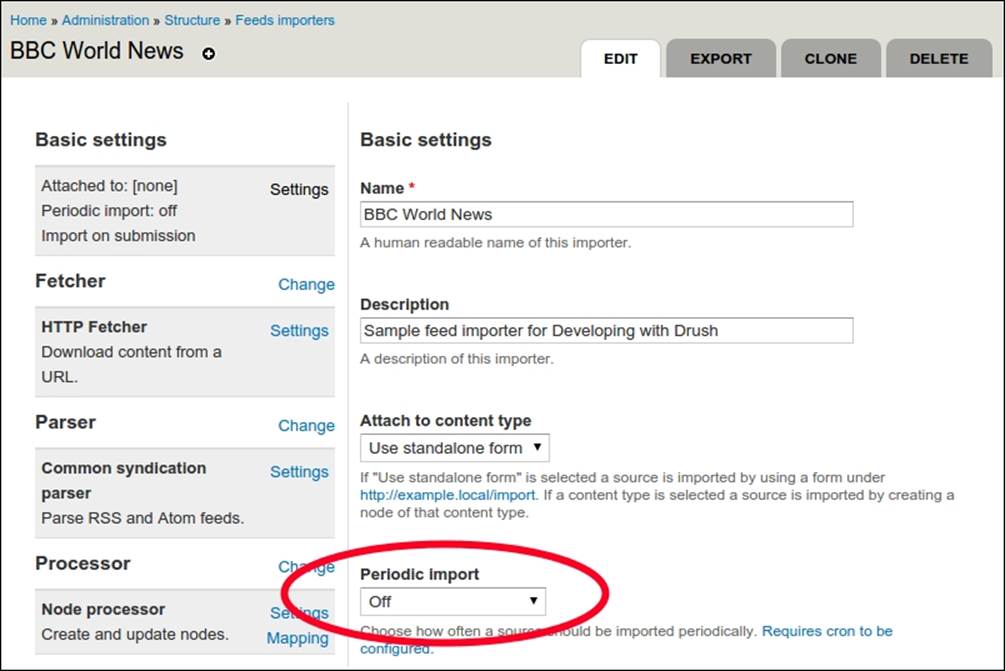
The first thing that we should do is to disable the Feeds importer from running in cron. Here is what the main settings of our feed look like in Drupal's administration interface:
Now, in order to have everything in one module, we will export the Feeds importer into code and then write a custom Drush command to trigger it from the command line. In order to export the Feeds importer, we need to figure out its component machine name with theFeatures module:
$ drush features-components
Enter a number to choose which component type to list.
[0] : Cancel
[1] : all
[2] : dependencies
[3] : feeds_importer
[4] : field_base
[5] : field_instance
[6] : filter
[7] : image
[8] : menu_custom
[9] : menu_links
[10] : node
[11] : taxonomy
[12] : user_permission
[13] : user_role
[14] : variable
[15] : views_view
3
Available sources
feeds_importer:bbc_world_news
feeds_importer:node Provided by: feeds_import
feeds_importer:opml Provided by: feeds_news
feeds_importer:user Provided by: feeds_import
The Feeds importer's machine name is feeds_importer:bbc_world_news. We can now export it to a new custom module:
$ drush features-export newsfetcher \
--destination=sites/all/modules/custom feeds_importer:bbc_world_news
Will create a new module in sites/all/modules/custom/newsfetcher
Do you really want to continue? (y/n): y
Created module: newsfetcher
in sites/all/modules/custom/newsfetcher
[ok]
Writing a Drush command to trigger the Feeds importer
When we exported the feed into code, we created a custom module: newsfetcher. We will now add a custom Drush command at sites/all/modules/custom/newsfetcher/newsfetcher.drush.inc that will take care of triggering the import process. Here are its contents:
/**
* Implements hook_drush_command().
*
* Defines the command to fetch news.
*/
function newsfetcher_drush_command() {
$items = array();
$items['news-fetch'] = array(
'description' => "Fetches latest news from BBC's RSS feed.",
);
return $items;
}
The preceding code uses the bare minimum settings to define a Drush command. The following function is the command implementation:
/**
* Implements drush_hook_COMMAND().
*
* Callback for news-fetch Drush command.
*/
function drush_newsfetcher_news_fetch() {
// Load the Feeds importer.
$source = feeds_source('bbc_world_news');
// Set the import URL.
$fetcher_config = $source->getConfigFor($source->importer->fetcher);
$fetcher_config['source'] = 'http://feeds.bbci.co.uk/news/world/rss.xml';
$source->setConfigFor($source->importer->fetcher, $fetcher_config);
$source->save();
// Execute the import.
$source->startImport();
}
In order to test our new command, let's install our newsfetcher module and then run it to see its result:
$ drush pm-enable newsfetcher
The following extensions will be enabled: newsfetcher
Do you really want to continue? (y/n): y
newsfetcher was enabled successfully. [ok]
$ drush news-fetch
Created 55 nodes. [status]
That's it! Now, we can run this task either manually or by scheduling it through crontab or any other job scheduling mechanism. As we just saw, the process of moving a task out of cron consists of figuring out how the task integrates with Drupal's cron, then disabling this integration, and finally writing a custom Drush command that triggers the task.
If you want to read further on how to write custom Drush commands, take a look at the Drush documentation by running drush topic docs-commands and drush topic docs-examplecommand. The drushify command is a very helpful resource too as it creates a templatecommand file for a given module (https://www.drupal.org/project/drushify).
Running long tasks in batches
There might be times where a task (for example, a Drush command or a PHP script) might take so long to complete that it hits one of PHP's constraints such as memory_limit, max_execution_time, or max_input_vars. In these cases, when you foresee that a task might take a considerable amount of time or resources to complete, it is safer to split the work into chunks that can be completed in smaller, independent, and consecutive processes. This is what Drupal's Batch API (https://www.drupal.org/node/180528) is for. In this section, we will explain how it works and examine how a contributed module uses it in order to complete a large task safely.
The most common errors we might find during a long process are:
· Allowed memory size of [some number] bytes exhausted: This means that our script attempted to use more memory than the maximum allowed to PHP at the memory_limit setting.
· Fatal error: Maximum execution time of 30 seconds exceeded: This means that our script took longer than the maximum amount of seconds defined by the PHP setting max_execution_time.
· MySQL server has gone away: This happens when we hit a timeout in the MySQL server. It can be provoked for various reasons (http://dev.mysql.com/doc/refman/5.0/en/gone-away.html) and sometimes can be fixed by adjusting my.cnf, but in essence, this is just another symptom of the fact that our process is trying to accomplish too much in just one go.
Drupal's Batch API is tricky. The real challenge is not that the API is badly architected, but that you need to make sure that the code that will run on each pass does not hit any PHP constraint.
Note
This book won't cover Queue API. If you are interested, you can research its API reference section at https://api.drupal.org/api/drupal/modules!system!system.queue.inc/group/queue/7.
A sample Drush command using the Batch API
Content revisioning is one of the most powerful features of Drupal. It gives editors the chance to edit a node and, if they are unhappy with their edits, they can roll back to a previous version of the content. The drawback of this feature is that the database size can grow quite quickly in certain scenarios. Here are a couple of them:
· A particular set of nodes is constantly being updated by editors; thus, the amount of revisions for them can grow up to hundreds or even thousands, which affects its performance
· A Feeds importer that runs periodically updates a long list of nodes on every run, generating new revisions for these nodes, which would increase the database size considerably over time
There might be some cases when we realize that we do not even need revisioning for a given content type. If this is the case, we can switch it off at the content type settings (warning, you will still need to delete old revisions of the existing content in order to recover the database space). In other content types such as Page and Article, you might prefer to keep the latest 10 revisions and automatically delete the older ones.
The Node Revision Delete module (https://www.drupal.org/project/node_revision_delete) is a contributed module used to delete old revisions of content. It can perform this task periodically through Drupal's cron or can be triggered through the administration interface or Drush. When run from Drupal's cron, it will just delete a few revisions. When triggered through the administration interface or Drush, it will delete all the older revisions of the selected content types. The latter can be quite a lengthy process on databases with a lot of revisions.
The following is the approach of the Node Revision Delete module: you first run the Drush command in order to do an initial, long, content revision pruning. Then, through the administration interface, you configure the module; so on every cron run, it evaluates whether it has to delete revisions from a list of selected content types.
Here is the command implementation. Note the use of the Batch API in order to prepare the job:
// http://cgit.drupalcode.org/node_revision_delete/tree/node_revision_delete.drush.inc#n37
/**
* Implements drush_COMMANDFILE_COMMANDNAME().
*/
function drush_node_revision_delete($content_type, $revisions_to_keep) {
// Set up the batch job.
$batch = array(
'operations' => array(
array('node_revision_delete_batch_process', array($content_type, $revisions_to_keep))
),
'title' => t('Node Revision Delete batch job'),
'init_message' => t('Starting...'),
'error_message' => t('An error occurred'),
'finished' => 'node_revision_delete_batch_finish',
'file' => drupal_get_path('module', 'node_revision_delete') . '/node_revision_delete.batch.inc',
);
// Start the batch job.
batch_set($batch);
drush_backend_batch_process();
}
A batch job defines an array of operations to run (these are the ones that will do the actual processing) and a finished callback (the one that will evaluate results at the end and render a report). In this case, these are node_revision_delete_batch_process andnode_revision_delete_batch_finish, respectively. Let's see them in detail.
Batch API operations
An operation within a batch set is composed of a callback function plus a list of parameters needed by this callback. We define this while setting up the batch job in the following lines:
'operations' => array(
array('node_revision_delete_batch_process', array($content_type, $revisions_to_keep))
),
The node_revision_delete_batch_process callback takes care of the following functions:
· Defining the list of target nodes whose revisions will be deleted
· Deleting a number of revisions
· Updating the current state of the batch operation
Let's see each of these steps one by one in the source code of the function:
1. Setting up the list of target nodes whose revisions will be deleted.
2. /**
3. * Callback to delete revisions using Batch API.
4. */
5. function node_revision_delete_batch_process($content_type, $max_revisions, &$context) {
6. if (!isset($context['sandbox']['nids'])) {
7. // Set initial values.
8. $context['sandbox']['nids'] = node_revision_delete_candidates($content_type, $max_revisions);
9. $context['sandbox']['current'] = 0;
10. $context['sandbox']['total'] = count($context['sandbox']['nids']);
}
In the preceding snippet, the $context['sandbox'] array is being used to store the current progress of the batch operation plus the list of nids, which have revisions to be deleted. Take into account that the node_revision_delete_batch_process callback function will be called as many times as needed until the $context['finished'] flag is set to 1. You are free to use the $context['sandbox'] array any way you want in order to implement the logic that decides when the batch job is completed. Let's move on to step two.
11. Deleting a number of revisions.
12. // Perform the actual revision deletion.
13. $nid = $context['sandbox']['nids'][$context['sandbox']['current']];
14. $deleted_revisions = _node_revision_delete_do_delete($nid, $max_revisions);
15.
16. // Evaluate if we are done with the current node.
17. if (empty($deleted_revisions->pending)) {
18. $context['sandbox']['current']++;
}
The preceding piece of code deletes a few revisions and then updates numbers within the $sandbox array. The $context['sandbox']['current'] array is used to determine the current node that we are pruning. Now, we will see how we evaluate whether the job has completed.
19. Updating the current state of the batch operation.
The last part of the process callback starts by gathering some details that will be used to report how many revisions for each node ID were deleted:
// Save some details for the final report.
if (isset($context['results'][$nid])) {
$context['results'][$nid] += $deleted_revisions->count;
}
else {
$context['results'][$nid] = $deleted_revisions->count;
}
Finally, the status of the batch operation is updated. As we mentioned before, if $context['finished'] equals to 1, then the batch operation is completed successfully. If it is not completed, $context['finished'] will contain the progress in a scale from 0 to 1. What we are doing in the following code is dividing the amount of processed nodes with the total amount of nodes to process:
// Inform the batch engine that we are not finished,
// and provide an estimation of the completion level we reached.
$context['finished'] = empty($context['sandbox']['nids']) ? 1 : $context['sandbox']['current'] / $context['sandbox']['total'];
}
Running the command and verifying the output
Given a Drupal site with a few nodes and a lot of revisions, here is the sample command output that deletes the old ones. In the following output, we are just keeping the last two revisions of the Article content type. We are also using the --verbose option, as we want to see how Drush spawns new processes for each loop when deleting revisions:
$ drush --verbose node-revision-delete article 2
/home/juampy/.composer/vendor/drush/drush/drush.php --php=/usr/bin/php
--php-options=' -d magic_quotes_gpc=Off -d magic_quotes_runtime=Off
-d magic_quotes_sybase=Off' --backend=2 --verbose
--config=.git/../drush/drushrc.php --root=/home/juampy/projects/drupal
--uri=http://default batch-process 17 17 -u 0 2>&1
Command dispatch complete [notice]
/home/juampy/.composer/vendor/drush/drush/drush.php --php=/usr/bin/php
--php-options=' -d magic_quotes_gpc=Off -d magic_quotes_runtime=Off
-d magic_quotes_sybase=Off' --backend=2 --verbose
--config=.git/../drush/drushrc.php --root=/home/juampy/projects/drupal
--uri=http://default batch-process 17 17 -u 0 2>&1
...
...
Deleted 49 revisions for node with nid 307. [status]
Deleted 44 revisions for node with nid 305. [status]
Deleted 39 revisions for node with nid 311. [status]
Deleted 38 revisions for node with nid 306. [status]
Deleted 32 revisions for node with nid 309. [status]
Deleted 29 revisions for node with nid 312. [status]
...
Command dispatch complete [notice]
What we see in the preceding code is that Drush is spawning a new process to continue executing the task as it is not completed. It does so by invoking a command called batch-process. It stays on this loop until it's finally completed.
On a Drupal project with hundreds or thousands of revisions, the task will take a long time to complete, but it won't fail as it does the processing in small pieces of work. If you ever need to face a task where the amount of data to process is huge, consider making use of this approach.
Evaluating code on the fly and running scripts
Sometimes, you need to test a piece of code after Drupal has bootstrapped, but you do not know how. I remember, when I started using Drupal, that I would copy index.php in test.php, replace the last line with whatever code I wanted to test, and then open this file in the web browser to see its result. This was an easy approach, but I felt it was wrong because I was hijacking Drupal's router: index.php.
Drush has two commands to let you run code after Drupal has been bootstrapped. This accomplishes the same goal as the approach mentioned in the preceding code (copying and hijacking index.php), but in a cleaner way. These commands are:
· php-eval: This lets you run PHP code in the command-line interface. It is useful when you want to test a few statements. This is like using the PHP's interactive shell (http://php.net/manual/en/features.commandline.interactive.php), but in a Drupal context.
· php-script: This executes a given script file after Drupal has been bootstrapped. It is ideal to run small snippets of code.
The php-eval command
The php-eval command evaluates the given argument after bootstrapping Drupal, using the PHP's eval() function (http://php.net/manual/en/function.eval.php). It can format the output of the script in plain text plus other formats such as JSON or YAML. This comes in handy whenever you need to test a particular API or want to pipe the output of a PHP statement into something else as part of a larger script. Let's see some examples that illustrate this:
Print the title of node with nid as 314:
$ drush php-eval 'return node_load(314)->title;'
'This is the title of node 314'
You can enter several statements by separating them with semicolons:
$ drush php-eval '$node=node_load(314); return $node->title;'
'This is the title of node 314'
It is best to wrap the PHP statements with single quotes because using double quotes will result in the command-line interface evaluating the string:
$ echo $HOME
/home/juampy
$ drush php-eval "return file_unmanaged_copy('$HOME/Pictures/image.jpg', 'public://image.jpg');"
'public://image.jpg'
In the preceding command, the $HOME variable is being replaced by its value (/home/juampy). Knowing this subtle difference will save you time and headaches when using this command. For example, see the error that Drush reports back when we run one of the following statements wrapped in double quotes:
$ drush php-eval "$node=node_load(314); return $node->title;"
PHP Parse error: syntax error, unexpected '=' in /home/juampy/.composer/vendor/drush/drush/commands/core/core.drush.inc(1074) : eval()'d code on line 1
The preceding command throws a PHP error because the command-line interface interprets the string wrapped in double quotes attempting to replace $node with its value, which turns into an empty string when passed to the Drush command. Using single quotes, we can prevent a string that contains a $ symbol from being treated as a variable and being expanded by the shell before execution.
Finally, you can use the --format option if you want to transform the output for later processing. In the following command, we will load a node and return its data as a JSON structure:
$ drush php-eval --format=json 'return node_load(316);'
{
"nid": "316",
"uid": "1",
"title": "Sample node",
"log": "",
"status": "1",
...
"body": {
"und": [
{
"value": "Body of the node.",
"summary": "",
"format": "filtered_html",
"safe_value": "Body of the node.",
"safe_summary": ""
}
]
},
...
}
The php-script command
The php-eval command is very useful for quickly testing one or two PHP statements, but there will be times where you need to run a few lines of code. As I discovered the php-eval command, I find myself using it more and more. If you ever need to check out how a certain Drupal API works or want to browse it in a data structure (a node, for example), write a small script to test this and then run it with the php-eval command.
Let's see this in action with a practical example. Consider that we have added an Image field to our Page content type. Then, when we are about to work with the field data, we realize that we do not know its structure. Here is a little script that will let us discover it:
<?php
/**
* @file
* Prints the contents of the image field of a node.
*
* Usage: drush php-script image_field.php
*/
$node = node_load(315);
print_r($node->field_image);
After saving the preceding snippet at the root of our Drupal project, we can run it with the following command:
$ drush php-script image_field.php
Array (
[und] => Array (
[0] => Array (
[fid] => 1
[uid] => 1
[filename] => face.jpg
[uri] => public://face.jpg
[filemime] => image/jpeg
[filesize] => 49324
[status] => 1
[timestamp] => 1409675594
[rdf_mapping] => Array ()
[alt] =>
[title] =>
[width] => 376
[height] => 503
)
)
)
Easy, isn't it? All of Drupal's APIs are available for this script as Drush has bootstrapped our Drupal project right before running it.
A script to create nodes and revisions
Here is a longer example. Previously in this chapter, we reviewed how Node Revision Delete uses the Batch API to delete the older revisions of content. Before actually running the command, we needed to create some nodes with a lot of revisions otherwise the Drush command wouldn't have found anything to delete. Here is the script that we used in order to create such context prior to run drush --verbose node-revision-delete article 2:
<?php
/**
* @file
* Script to create a bunch of nodes with revisions.
*
* Usage: drush php-script create_revisions.php
*/
$nodes_to_create = 10;
while ($nodes_to_create > 0) {
// Minimum default values. We enable revisions with 'revision' => 1.
$values = array(
'type' => 'article',
'uid' => 1,
'status' => 1,
'revision' => 1,
);
// Create the node entity and then use a wrapper to work with it.
$entity = entity_create('node', $values);
$node_wrapper = entity_metadata_wrapper('node', $entity);
// Set a random title and save the node.
$node_wrapper->title->set('Node title ' . rand(1, 100));
$node_wrapper->save();
// Create revisions for this node by simply re-saving the node a few times.
$revisions = rand(20, 50);
while ($revisions > 0) {
$node_wrapper->save();
$revisions--;
}
$nodes_to_create--;
}
We ran the preceding script by entering drush php-script create_revisions.php, which prepared the test content that we needed in order to delete old revisions with Node Revision Delete. This is another example of how writing small scripts and running them with Drush can be very useful in your day-to-day development.
The php-script and php-eval commands are two great tools to have in your belt. Both of them are very useful to debug logic in an isolated environment and to actually run code that does not necessarily need to be reused within a Drupal project.
Logging messages in Drush
Writing log entries helps in spotting flaws as you read the logs to find out where a bug might be. How much we should log messages and prepare to catch errors depends on the nature of the task. A good approach is that the more critical the task, the more logging and error checking it should do. However, overly verbose logging would make our logfiles huge and hard to read. It's better if we log just the minimum needed notices, and all the errors and warnings found.
Drush uses the drush_log() function. This function accepts different logging levels. Here are some of them:
· success: This marks a successful message
· error: This reports an error message
· warning: This is used to alert about something unexpected
· info: This is used to print additional information
Each of the preceding list has synonyms. For example, instead of success, you can also use ok, completed, or status. In order to keep things simple, we will just use the preceding levels in the following examples. Let's see how each of them behave, given the following script:
<?php
/**
* @file logging.php
* Sample script to test drush_log().
*/
drush_log('success: marks a successful message.', 'success');
drush_log('error: reports an error message.', 'error');
drush_log('warning: is used to alert about something.', 'warning');
drush_log('info: is used to print additional information.', 'info');
Here is the output when we run it in the command-line interface:
$ drush php-script logging.php
success: marks a successful message. [success]
error: reports an error message. [error]
warning: is used to alert about something. [warning]
We can see that each message is printed along with its type, which is wrapped with straight brackets. If your command-line interface supports colors, [success] would be in green (yay!), [error] would be in red (ugh!), and [warning] would be printed in yellow (oops!). Here is something to ask ourselves though, why did the [info] statement not show up? We will see this in the following section.
Note
Drush supports Drupal's watchdog() function by converting it into a drush_log() call. This is just for compatibility purposes so that Drupal code can be executed by Drush. When writing Drush commands, always use drush_log().
Tip
It is best practice to use dt() to wrap strings when logging or printing messages in order to support translations and placeholder replacement. However, the examples in the book don't use it, so they are easier to read.
The verbose and quiet modes
By default, Drush will only print warnings and errors on the screen. There are two options which can change this 'margin-left:18.0pt;text-indent:-18.0pt;line-height: normal'>· Drush, running in the verbose mode (--verbose): This will print bootstrap information and all types of log entries
· Drush, running in the quiet mode (--quiet): This will only print warnings and errors
Hence, running Drush in the verbose mode will add [info] messages to the output:
$ drush --verbose php-script logging.php
success: marks a successful message. [success]
error: reports an error message. [error]
warning: is used to alert about something. [warning]
info: is used to print additional information. [info]
Command dispatch complete [notice]
There you are! Now, our [info] entry is shown in the output plus an extra [notice] message added by Drush itself was printed. Now, let's verify what happens if we run Drush in the quiet mode. We should see just errors and alerts:
$ drush --quiet php-script logging.php
error: reports an error message. [error]
warning: is used to alert about something. [warning]
There is some reasoning in the conditional behavior of drush_log(). It is intended to give you flexibility to decide what should be logged. Drupal's cron is a great example. According to the documentation at drush topics docs-cron, this is the recommended way to run cron (some options have been removed for clarity):
$ /usr/local/drush/drush --root=/path/to/drupal \
--uri=mysite.example.com --quiet cron
In the preceding command, Drupal's cron was executed in the quiet mode. Why would we want that? The reason is that some scheduling systems (such as crontab) will send an e-mail alert if the job that got executed returned any output. The quiet mode skips the[success] messages, leaving just [alerts] and [warnings]. This is very useful because it will avoid us getting an e-mail every time cron runs. Instead, with the quiet mode, we will only be notified by e-mail if there was something unexpected in the process logged as a warning or as an error.
Redirecting Drush output into a file
Some Drush commands will take time to complete and generate a long output. In such cases, it is useful to record the output into a logfile. After running a migration script, for example, you would like to thoroughly read the log, so you can check whether each migration step is completed as expected. As for cron runs, you would like to keep a log of them so that when you receive an alert, you can look at the log of the last cron runs to debug it.
Now, before you decide to redirect the output of a command into a log, you should be aware of the nature of input and output streams (http://en.wikipedia.org/wiki/Standard_streams). Each process (Drush executing a command, for example), will have three streams:
· STDIN: This is the standard input stream used to receive data (when you request the user to choose a topic out of a list using the drush topic command).
· STDOUT: This is the standard output stream used to print back results. If you are running a command in the command-line interface, the screen would be the one receiving this data and printing it for you.
· STDERR: This is the standard error stream used to log errors. If you are running a command and viewing its results, messages logged to STDERR will be printed on the screen, but you can choose to print them somewhere else. We will see some examples of this.
The drush_log() function prints messages to STDERR. If you run a Drush command, messages logged with drush_log() will appear on the screen once the command is completed. However, when redirecting the output of a command into a file, you should be explicit about exactly what you want to log, or you risk not logging everything you want. Let's see an example that outlines this, given the following script that we will run with Drush:
<?php
/**
* @file iostreams.php
* Sample script to test I/O streams.
*/
drush_log('Success message using drush_log()', 'success');
drush_print('Message using drush_print()');
print 'Simply printing a message with PHP\'s print function';
Here is the output when we execute it with Drush; redirect the output into a logfile named iostreams.log, and then print the contents of the resulting file:
$ drush php-script iostreams.php > iostreams.log
Success message using drush_log() [success]
$ cat iostreams.log
Message using drush_print()
Simply printing a message with PHP's print function
Now, this is interesting. The message that logged using drush_log() was printed on screen as it was written to STDERR, while the other two were saved to iostreams.log as both drush_print() and print write messages to STDOUT. This, most probably, is not what you want. We would prefer everything to be logged into our logfile (or if not everything, warnings, errors, and useful information). We need to be specific if we want both STDERR and STDOUT streams to be piped into a file. Here is how this can be achieved:
$ drush php-script iostreams.php &> iostreams.log
$ cat iostreams.log
Success message using drush_log() [success]
Message using drush_print()
Simply printing a message with PHP's print function
Depending on your needs, you might want to log both STDOUT and STDERR or just one of them. You can find great examples on how to redirect output into a file at http://tldp.org/HOWTO/Bash-Prog-Intro-HOWTO-3.html.
There is a nice article on why there is a different stream to log errors and how it works. If you are curious to dig further, you can visit http://www.jstorimer.com/blogs/workingwithcode/7766119-when-to-use-stderr-instead-of-stdout. Furthermore, PHP defines constants for each of the available streams. Visit http://php.net/manual/en/features.commandline.io-streams.php for more information.
Implementing your own logging mechanism
The drush_log() function uses an internal function to format and print messages called _drush_print_log(). By looking at Drush's source code, we can see that this function is obtained through a Drush context called DRUSH_LOG_CALLBACK. Here is an excerpt of the function taken from Drush's source code:
// /home/juampy/.composer/vendor/drush/drush/includes/drush.inc
function drush_log($message, $type = 'notice', $error = null) {
$log =& drush_get_context('DRUSH_LOG', array());
$callback = drush_get_context('DRUSH_LOG_CALLBACK', '_drush_print_log');
$entry = array(
'type' => $type,
'message' => $message,
'timestamp' => microtime(TRUE),
'memory' => memory_get_usage(),
);
$entry['error'] = $error;
$log[] = $entry;
drush_backend_packet('log', $entry);
return $callback($entry);
}
In the preceding function, Drush uses a context variable to obtain the function name that is used to write the log message. By overriding this context variable, we would be able to implement our own function. Let's take a simple example that implements a logging function that prints to STDOUT whatever we log with drush_log():
<?php
/**
* @file custom_logging.php
* Sample script to test drush_log().
*/
/**
* Prints all log messages to STDOUT.
*
* @param
* The associative array for the entry.
*
* @return
* TRUE in all cases.
*/
function mycustom_log($entry) {
$message = '[' . $entry['type'] . '] ' . $entry['message'];
return drush_print($message, 0, STDOUT);
}
// Overrides Drush default's logging callback.
drush_set_context('DRUSH_LOG_CALLBACK', 'mycustom_log');
// Logs some messages to test the new setting.
drush_log('Success message using drush_log()', 'success');
drush_print('Message using drush_print()');
print 'Simply printing a message with PHP\'s print function';
Now, let's run the preceding code and simply redirect the STDOUT stream into a file; then, print the contents of the resulting file:
$ drush php-script custom_logging.php > custom_logging.log
$ cat custom_logging.log
[success] Success message using drush_log()
Message using drush_print()
Simply printing a message with PHP's print function
[debug] Returned from hook drush_core_php_script
[notice] Command dispatch complete
[memory] Peak memory usage was 8.63 MB
We can see that our context override statement worked like a charm; we got all log messages printed to STDOUT including the one using drush_log(). We also saw that Drush itself logged some extra messages while shutting down using drush_log() and these got logged here too. If you want to apply this to an entire Drupal project (warning! this would need thorough testing), you could add the following snippet at sites/all/drush/customlog.drush.inc:
<?php
/**
* Custom callback to log messages.
*
* @see _drush_print_log()
*/
function mycustom_log($entry) {
$message = '[' . $entry['type'] . '] ' . $entry['message'];
return drush_print($message, 0, STDOUT);
}
/**
* Implements hook_drush_init().
*
* Overrides Drush's callback to write log messages.
*/
function customlog_drush_init() {
drush_set_context('DRUSH_LOG_CALLBACK', 'mycustom_log');
}
With the preceding code in place, every time our code or Drush itself uses drush_log(), it would go through our custom logging callback.
If you just want to see messages in real time on the screen, then use drush_print(), which prints messages immediately to STDOUT.
Running a command in the background
Imagine the following scenario: a new release is ready to go into the production environment. It contains changes for how articles are indexed into Apache Solr. The team has decided that once the new release has been deployed into production, you will log in to it via SSH and run a couple of Drush commands to mark the Article content type to be reindexed and to run the Drush command to reindex content so that all articles are submitted again to Apache Solr. This process, on large databases with a lot of content, might take a few hours to complete. If the SSH connection breaks or if we close it, the process would be killed automatically. Therefore, we should instruct it to run in the background.
Here is an example where we access the production environment and run the command in the noninteractive mode; so, even though we close the SSH connection, it would still run and save the output into a log that we can read once it finishes:
$ ssh produser@www.example.com
Welcome to the Production environment!
(Production) $ cd /var/www/exampleproject/docroot
(Production) $ drush solr-mark-all article
Marked content for reindexing
(Production) $ nohup drush --verbose solr-index \
--uri=www.example.com &> /tmp/solr_reindex.log &
[1] 12804
The preceding command returned to us the process identifier (PID) of the background process that is running our command (12804). It uses a few functions that you might have not seen before. These include the following:
· nohup: This is used to run a command that will ignore hangup signals. A hangup signal is the one sent by a process to all its subprocesses if it closes. This is what avoids the process to be killed when we close the SSH connection with the production environment.
· &> /tmp/solr_reindex.log: We have seen in the previous section that if we want to ensure that messages printed to STDOUT and STDERR get saved in a logfile, we need to redirect the output using &>. This is what we are doing here.
· &: This is the ampersand symbol at the end. This is used to run the command as a subprocess in the background. This lets us trigger the command and allows us to keep interacting with the command-line interface to monitor its progress or simply exit to close the SSH connection.
So, our process is running on its own now. If we list all running processes and filter them out by the keyword solr, we can see it listed here:
(Production) $ ps -aux | grep solr
produser 12804 6.0 0.8 331708 71548 pts/12 S 15:42 0:02 /usr/bin/php -d
magic_quotes_gpc=Off -d magic_quotes_runtime=Off -d magic_quotes_sybase=Off
/usr/share/drush/drush.php --php=/usr/bin/php --php-options= -d magic_quotes_gpc=Off
-d magic_quotes_runtime=Off -d magic_quotes_sybase=Off solr-index
--uri=www.example.com
Note that the two first things listed are the user who triggered the process (produser) and the process identifier or PID (12804), while the last bit is the actual Drush command. Now, if we view the logfile interactively with the tail command, we can see that the process is redirecting the output of the command here as expected:
$ tail -f /tmp/solr_reindex.log
Indexing node 15674. [ok]
Indexing node 15675. [ok]
WD Apache Solr: Adding 200 documents. [notice]
WD Apache Solr: Indexing succeeded on 200 documents [info]
Inspected 200 of 41045 entities. Submitted 200
documents to Solr [ok]
Indexing node 15676. [ok]
Indexing node 15677. [ok]
...
Indexing node 15678. [ok]
Indexing node 15878. [ok]
WD Apache Solr: Adding 200 documents. [notice]
WD Apache Solr: Indexing succeeded on 200 documents [info]
Inspected 400 of 41045 entities. Submitted 400
documents to Solr [ok]
Indexing node 15879. [ok]
...
Now, we can close the SSH connection and come back later and check whether the process was completed. If for any reason we would need to terminate the process, we can do it with the kill command plus the PID:
(master)$ kill 12804
[1]+ Terminated nohup drush solr-index --uri=www.example.com &>
/tmp/solr_reindex.log
Summary
Running tasks in a Drupal project becomes more and more important as the project matures and scales. Things like monitoring, cleaning up and upgrading our project need to be performed in a way that the task won't stress the system too much so that Drupal doesn't crash.
Drupal's cron is a very easy and convenient mechanism to run periodic tasks. We explained how to make Drupal not fire cron when serving regular web traffic and then we moved this responsibility to Drush plus a scheduling system: Jenkins. In the next section, we saw how to decouple a particular task from cron so that it runs as an independent process. Long tasks can use the Batch API in order to split the workload into smaller chunks that can complete safely.
We closed the chapter with a few tips on how to log a command's output into a file, such as the different output modes that Drush offers (verbose or quiet).
In the next chapter, we will dive even deeper into how Drush runs commands by adding error handing and discovering a few debugging tools.
All materials on the site are licensed Creative Commons Attribution-Sharealike 3.0 Unported CC BY-SA 3.0 & GNU Free Documentation License (GFDL)
If you are the copyright holder of any material contained on our site and intend to remove it, please contact our site administrator for approval.
© 2016-2026 All site design rights belong to S.Y.A.