Praise for Gray Hat Hacking: The Ethical Hacker’s Handbook, Fourth Edition (2015)
PART III. Advanced Malware Analysis
CHAPTER 23. Next-Generation Reverse Engineering
In a problem-solving activity such as reverse engineering, there is no good or bad way of doing things. Solutions are usually evaluated based on the amount of time and work needed to perform them. Like in any activity, reversers can also fall into a comfortable routine that allows them to tackle almost any problem but which may not be an optimal way of approaching it. This chapter is aimed at showcasing some relatively new tools and analysis techniques that, if given a chance, may improve your usual workflow. It is mainly oriented for malware analysis and vulnerability research, but ideas can be applied to almost any reverse-engineering task.
In this chapter, we cover the following topics:
• Improving malware analysis methodology and workflow using the IDAscope plug-in
• Improved IDB annotation and collaboration using IDA Toolbag plug-in.
• Distributed reverse engineering and collaboration with IDA
• Getting a head start with honeypots and sandbox technology
Notable IDA Plug-ins
No reverse-engineering discussion can go without a mention of IDA. This section explores ways to improve IDA functionality and usability by using various plug-ins. These extensions were developed by IDA users who wanted to improve their workflow and overcome problems encountered during analysis. As such, they serve as good examples of common problems and solutions to problems people encounter while doing malware or vulnerability research.
IDAscope
This interesting open-source plug-in, developed by Daniel Plohmann and Alexander Hanel, was awarded second place in the 2012 Hex-Rays plug-in contest. It’s mainly oriented on reversing Windows files, but it does have extensible structure making it easy to modify and add functionality. Here’s a list of some of the functionality offered by this plug-in:
• Renaming and annotating functions
• Converting code blocks to functions
• Identification of cryptographic functions
• Integrated Windows API documentation in IDA
• Semantic code coloring
You can install this plug-in by downloading the archive containing all the necessary files and extracting it to your desired location. To start the plug-in, run the IDAscope.py script from IDA. If the plug-in initializes successfully, the following information will be present in the IDA output window:
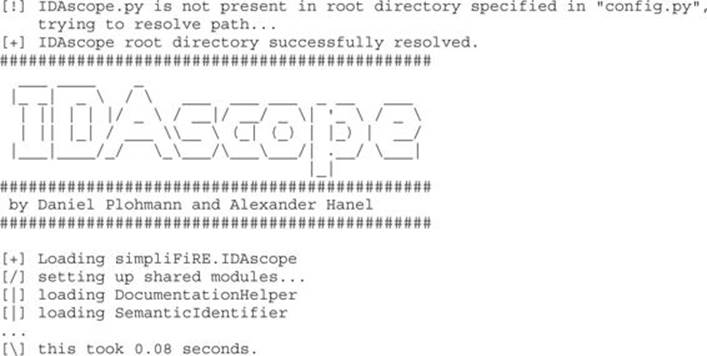
Figure 23-1 shows the IDAscope user interface in IDA. The plug-in provides a great set of functionality that can help with the initial file analysis. Following is a typical workflow using this plug-in when working on a new sample:
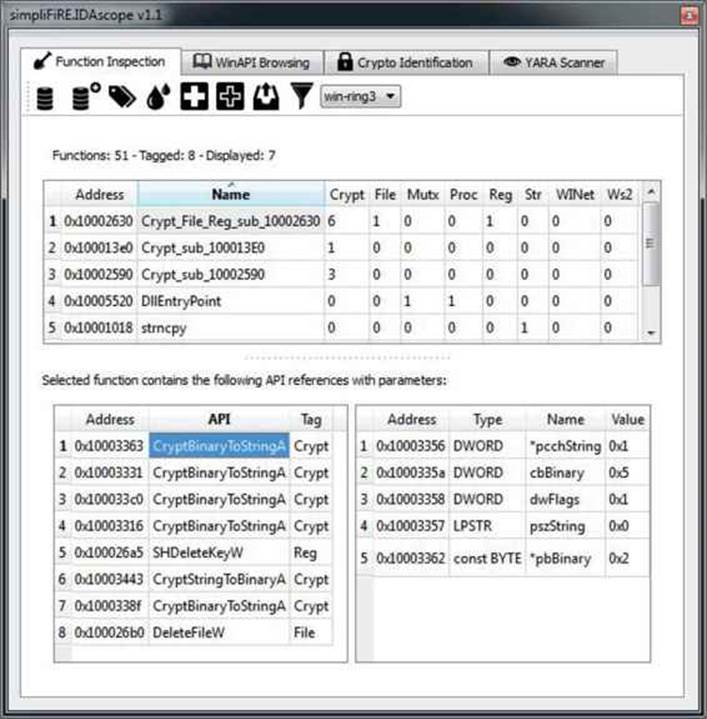
Figure 23-1 IDAscope plug-in user interface
1. Fix all unknown code to functions. Several heuristics are used to convert data and code not recognized as functions in IDA into proper IDA functions.
a. This pass will first perform the “Fix unknown code that has a well-known function prologue to functions,” as described in the plug-in documentation.1 This ensures that during the first pass, only code that has better indicators gets converted to a function. In this case, the standard function prolog (push ebp; mov ebp, esp or 55 8B EC) is used as a heuristic. After that, the plug-in will try to convert all other instructions into function code.
2. Rename potential wrapper functions. This is a quick and easy way to get free and high-quality annotations for IDB. A wrapper function is typically a simple function that implements error-checking code for another function (for example, an API). In this context, a function wrapper can call only one other function, which makes it trivial to determine which function is wrapped and to apply that name to the wrapper. Wrapper functions use the following naming template: WrappingApiName + _w (for example, CreateProcessA_w).
3. Rename the function according to identified tags. This is a very cool approach that can significantly improve the reverse-engineering process. The approach is based on grouping API functions and adding the group name as a prefix to the function name. For example, the functionsub_10002590 that calls CryptBinaryToStringA will be renamed to Crypt_sub_10002590. In cases where a function calls APIs from multiple groups, it will get prefixed with all group names (for example, Crypt_File_Reg_sub_10002630).
4. Toggle semantic coloring. This will color every basic block that calls an API function from a predefined group, similar to the previous step. Different colors represent different API groups, which allows for easier location of interesting basic blocks based on color. This can come in especially handy in bigger graphs when you’re looking at a graph overview to get an idea how different functions are called across the graph.
At this point, IDB should be populated with all the annotations from the IDAscope plug-in and sample analysis can begin.
When you’re reverse engineering on Windows, it is common to come across API function names with which you aren’t familiar. In those situations, the most common approach is to look for their descriptions on Microsoft Developer Network (MSDN). The WinAPI Browsing tab in IDAscope supports looking up MSDN function description pages directly from the IDA UI (see Figure 23-2). These pages are accessible in two modes: online and offline. For online mode, it is necessary to have Internet connectivity, and APIs can be looked up. For the offline availability, it is necessary to download API descriptions and unpack them to the default location of C:\WinAPI, after which it is no longer necessary to have Internet connectivity to search for and read the descriptions.
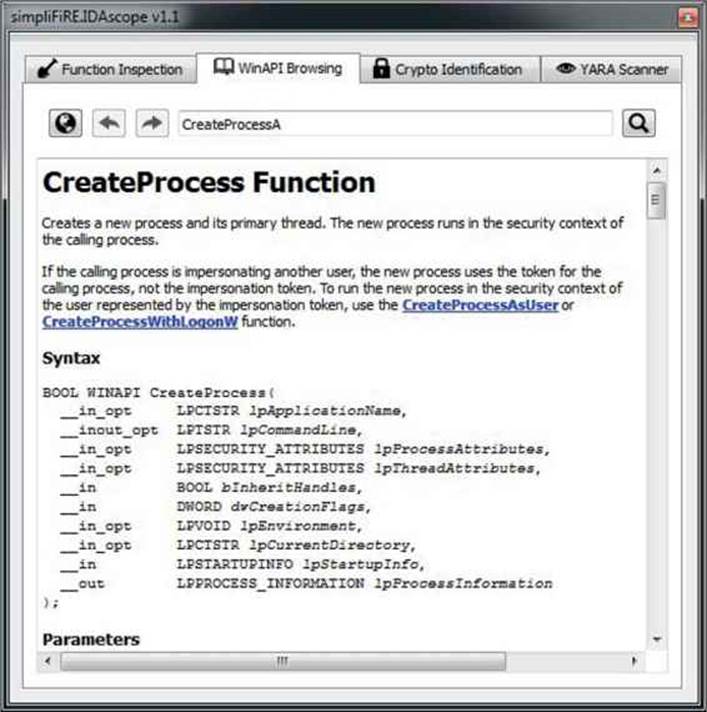
Figure 23-2 IDAscope WinAPI Browsing tab
Reverse-engineering malware is often about identifying and classifying the correct malware family. YARA is probably the most popular and well-known tool for writing malware signatures in the open-source world. It supports writing simple byte signatures with wildcards but also more complex regular expressions.
As more researchers and malware intelligence feeds support and include YARA signatures in their reports, it comes in handy to check them directly from IDA. IDAscope can load and check all the available YARA signatures against the loaded sample. It outputs a table containing information of how many signatures from each file are triggered and at which locations. Following is a simple signature for the Tidserv threat analyzed in Chapter 22:
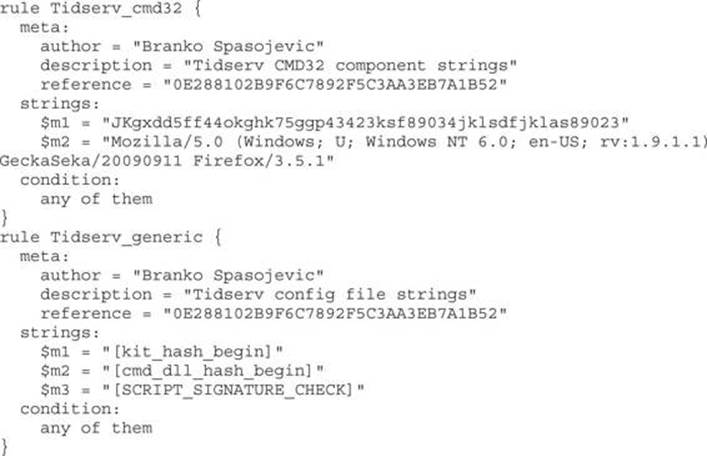
Checking the previous signature against the Tidserv sample (MD5: 0E288102B9F6C7892F5C3AA3EB7A1B52) gives us the results shown in Figure 23-3.
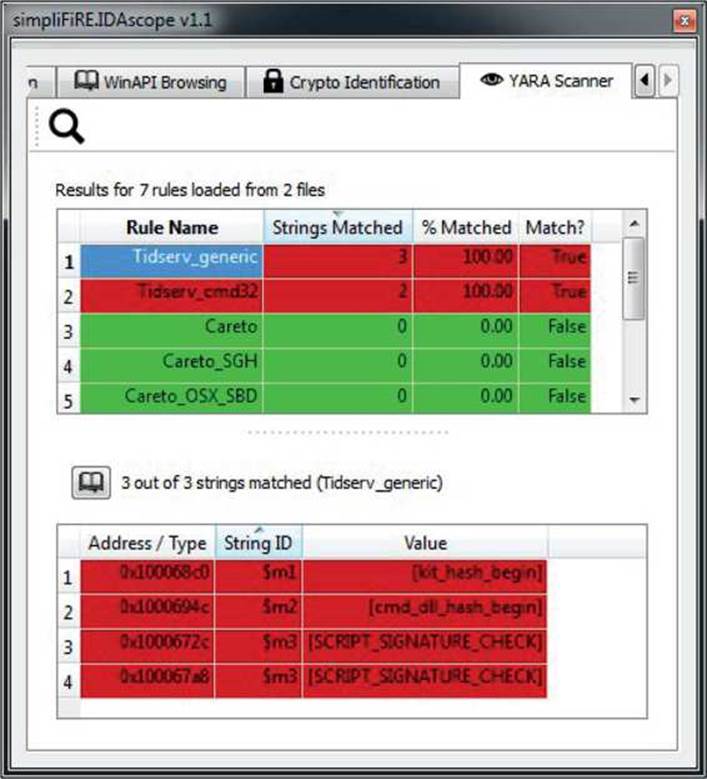
Figure 23-3 IDAscope YARA scanner table
Figure 23-3 shows that two YARA rules—Tidserv_generic and Tidserv_cmd32—matched all their string signatures. From here, it is possible to analyze and check for potential false positive matches by inspecting the addresses at which the matches occurred.
 NOTE YARA signatures are a good way to document malware analysis and create a personal repository of signatures. These signatures can be used for malware clustering purposes or threat intelligence to track specific attacker groups and associate malware variants with them.
As a final step in exploring this plug-in’s functionality, we’ll use it to identify cryptographic functions. The first and most common way to identify cryptographic functions is to identify various cryptographic constants. There are many other plug-ins for IDA and other debuggers that implement this functionality, such as FindCrypt, FindCrypt2, KANAL for PeID, SnD Crypto Scanner, CryptoSearcher, and various others. IDAscope, in addition to this standard approach, also implements a static heuristic based on loops to detect cryptographic code. The detection heuristic consists of three configurable parameters:
• ArithLog Rating These limits are used to determine minimum and maximum percentage of arithmetic instructions in a basic block. A high percentage of arithmetic instructions inside a loop is a good indicator of an encryption, decryption, or hashing-related functionality.
• Basic Blocks Size Defines the minimum and maximum range for the number of instructions a basic block needs to have.
• Allowed Calls Defines the minimum and maximum range for the number of calls a basic block needs to have.
It is very difficult to recommend the best configuration of parameters because it greatly depends on the implemented crypto. The best approach is to modify parameters and examine the results in an iterative manner. If a specific parameter configuration doesn’t produce satisfactory results, lower the boundaries in case of a small number of results or increase the limits for noisy results.
Figure 23-4 shows an example configuration of parameters for identifying the XOR decryption locations that precede the RC4.
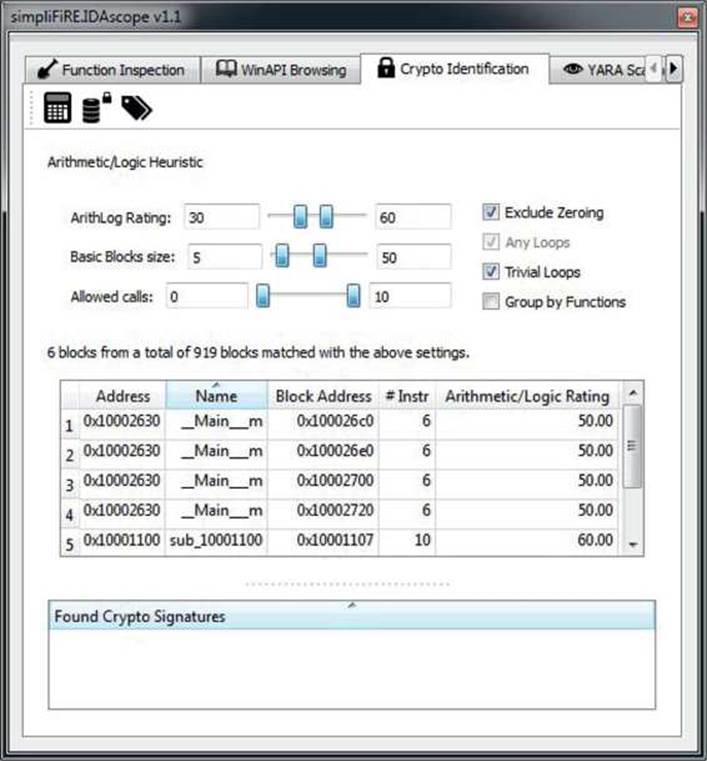
Figure 23-4 IDAscope crypto identification
Examining the code at the reported addresses, the XOR decryption can be confirmed. Here is the code listing for the first two basic blocks reported by IDAscope:
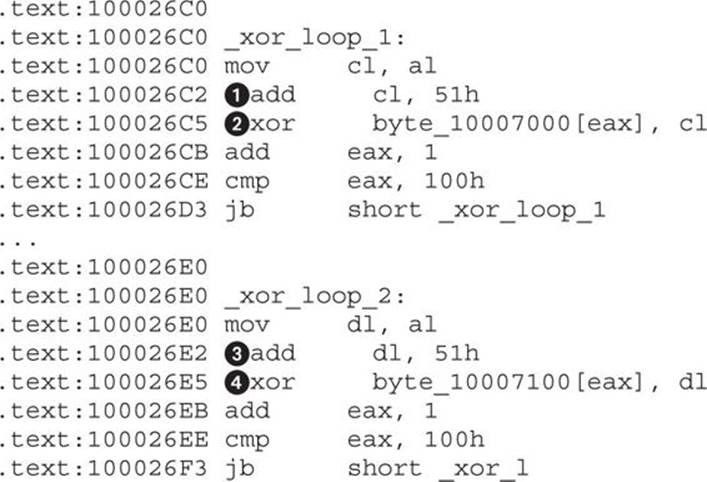
At locations ![]() and
and ![]() is the visible update of the XOR rolling key, with a value of 0x51. At locations
is the visible update of the XOR rolling key, with a value of 0x51. At locations ![]() and
and ![]() is the instruction that decrypts memory with the key calculated in the previous instruction. These two loops decrypt different memory regions using the same style of algorithm and are good examples of identifying custom cryptographic algorithms that can’t be identified using traditional matching of cryptographic constants.
is the instruction that decrypts memory with the key calculated in the previous instruction. These two loops decrypt different memory regions using the same style of algorithm and are good examples of identifying custom cryptographic algorithms that can’t be identified using traditional matching of cryptographic constants.
Getting familiar with IDAscope and its capabilities will surely pay off and improve the speed and efficiency of reverse engineering with IDA.
IDA Toolbag
The IDA Toolbag, as the names suggests, is a collection of useful tools that extend the functionality and usability of IDA. This set of scripts and tools is mainly tailored for the task of vulnerability research, but is also relevant for general reverse-engineering tasks and even malware analysis. Here are some of many Toolbag functionalities mentioned in this chapter:
• Global marks
• History tab
• Comments, files, and queues
• Path finder
You can launch the Toolbag plug-in from the IDA Python shell by running the import toolbag command. After initialization, the widget in Figure 23-5 will appear in IDA.
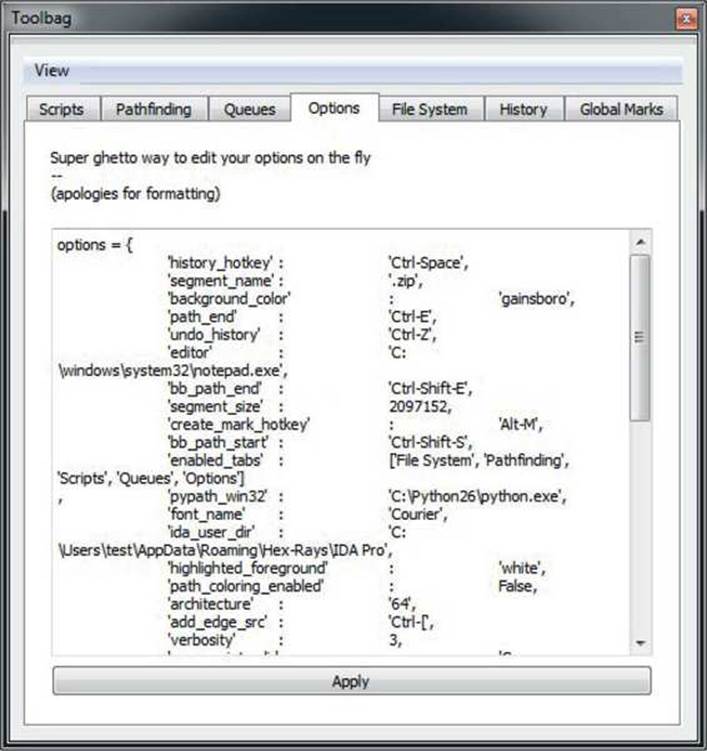
Figure 23-5 The IDA Toolbag widget
The bookmarking functionality of IDA is very handy for making notes of interesting functions and locations that need more attention. The Toolbag plug-in extends the default IDA bookmarks by adding an additional field called Group, which you can specify when creating a new marked location. By default, the plug-in will replace IDA’s bookmarking hotkeys (ALT-M and CTRL-M) with the Toolbags Global Marks functionality. When creating a new marked position, you can define two parameters: Optional Group and Description. The Optional Group parameter provides the ability for you to group various marks and later use that string for grouping purposes. One important difference between IDA bookmarks and global marks is that the information about first type is stored in IDB whereas the latter is stored in the database created by the Toolbag plug-in. Figure 23-6 shows the Global Marks tab, which contains several dummy marks in an IDB.
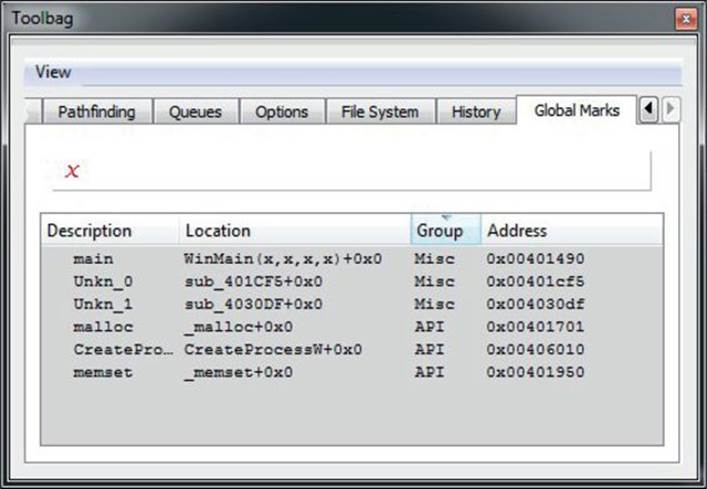
Figure 23-6 IDA Toolbag Global Marks tab
An even better improvement of the marking system is the History tab. This concept is based on the same idea of marking locations while analyzing a file but also keeping the parent and child relations about the marked locations. The History tab, therefore, has a tree-like structure where child functions appear underneath their parents. You can add a new function to the list by pressing the hotkey CTRL-SPACEBAR. Figure 23-7 shows a dummy example of the History tab for an analysis session.
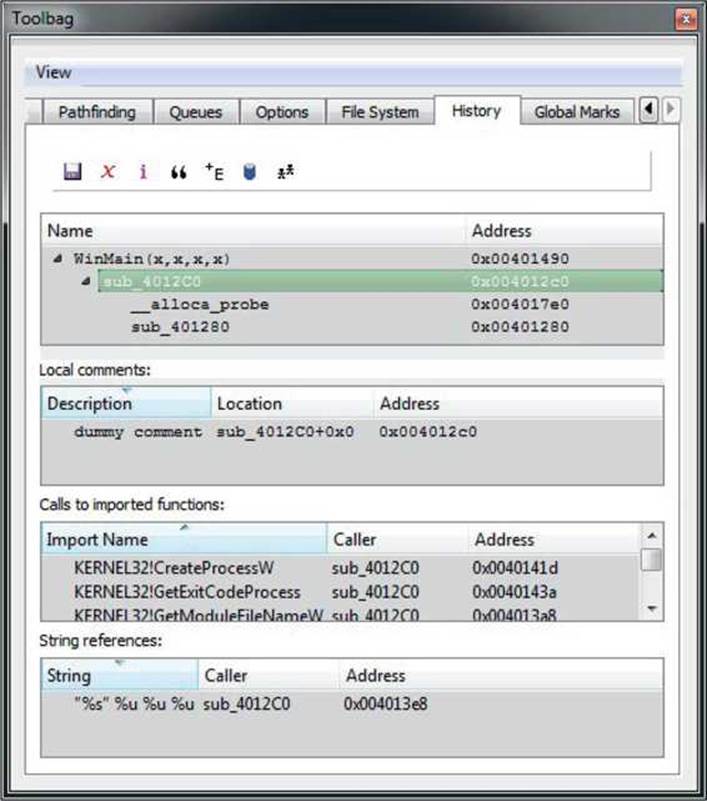
Figure 23-7 The IDA Toolbag History tab
Each marked function in the Name view is accompanied with the following three listings that contain more information about the function:
• Local comments Lists all comments in the marked function, along with their location and address
• Calls to imported functions Lists all API function names called from the function, along with their caller and address
• String Lists all strings referenced from the functions, along with their caller and address
Examining the History tab, you can review all marked functions and get summary information about them. This is especially useful when deciding on the next analysis candidate or for getting insight into the importance and functionality of each entry.
Functionality that may appeal more to the vulnerability researchers when determining the reachability of a vulnerability can be found in the Pathfinding tab. It generates a control-flow graph that depicts a code path between two functions or basic blocks of choice. The generated graph is synchronized with the IDA disassembly view, and double-clicking the generated graph will position the view in the disassembly window at the appropriate location. In the case of a function’s code path, two locations need to be chosen: the starting function (CTRL-S) and destination function (CTRL-E). In the case of basic blocks, the starting block is selected using CTRL-SHIFT-S and the ending block using CTRL-SHIFT-E. Figure 23-8 shows an example of a code path between two basic blocks (left), and a full control flow graph of the function containing the chosen blocks (right).
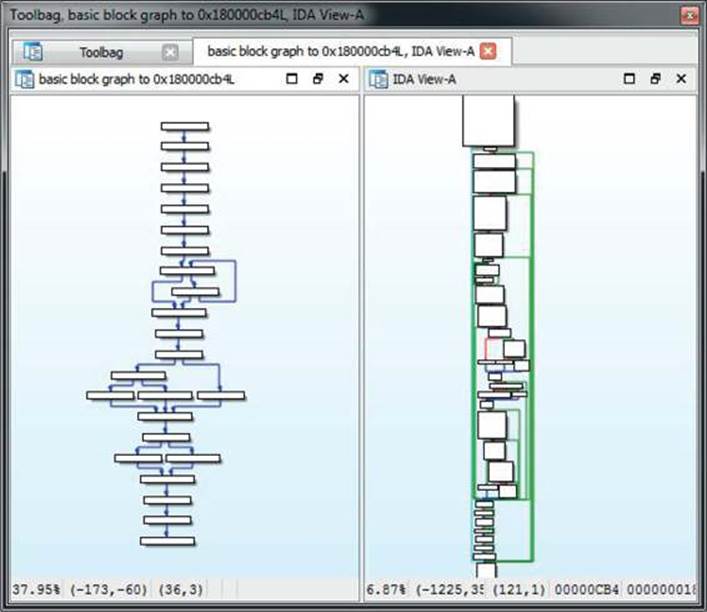
Figure 23-8 The IDA Toolbag pathfinder graph
One of the more interesting functionalities of Toolbag is its collaboration mechanism based on queues. The plug-in supports sending and receiving data to other Toolbag users as long as they are reachable over the network. It uses the notion of peers and servers to model the communication. Peers are able to subscribe and receive data from the server, as long as they know its IP, port, and key. After the peers have subscribed to the server, they are able to push and receive the data. Toolbag allows for the pushing of the following data: history session, global marks, and files located in the Toolbag file system. This queue doesn’t provide a very flexible and transparent collaboration mechanism, but it is a step in the right direction and makes IDA more useful.
Besides the aforementioned functionality, which is separated into different tab windows, Toolbag also comes with several stand-alone IDApython scripts that can be used to facilitate analysis. Figure 23-9 shows a list of the Toolbag scripts available.
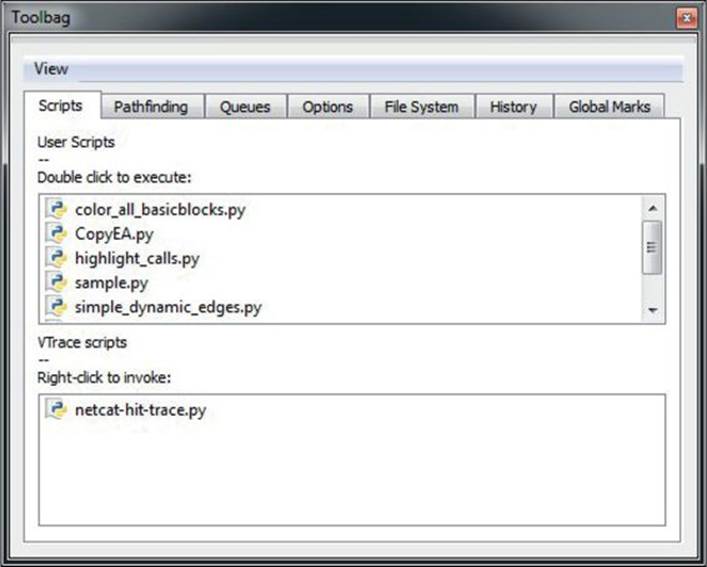
Figure 23-9 The IDA Toolbag Scripts tab
Following is a list of scripts and their functionality:
• color_all_basicblocks.py Presents the user with a dialog box for choosing a color that will be used as the background for all basic blocks in a current function.
• copyEA.py A simple helper script that writes to the IDA output window a WinDbg command to set a breakpoint at a desired address. The address is chosen by pressing predefined hotkey Z.
• highlight_calls.py Sets a predefined background color on all disassembly lines that contain the call instruction. The color can be modified in the script’s source code.
• sample.py A dummy script that can serve as placeholder for any additional functionality users may want to add.
• simple_dynamic_edges.py Aims to help with resolving dynamic code cross-references. Code-references that are calculated or loaded during runtime are sometimes not recognized by IDA, which generates a broken control-flow graph and missing cross-reference information. This script accepts an input pattern that describes the instruction that loads the destination address of the control-flow branch and adds cross-reference information to IDB.
• vtable2structs.py Aims to help facilitate reversing code using virtual tables like in C++. It looks for symbols containing vftable as a substring and creates IDA structures with an element for every function pointer in the virtual table.
Collaboration
Collaboration and documentation during reverse engineering are very interesting but somewhat overlooked topics. A very common situation when reverse engineering a complex malware sample or software is to have multiple people looking at the same thing. The most elementary method of collaboration would be to share the IDC dump of IDB or the actual IDB file. Over the years several attempts and different approaches have been made to implement this functionality. Following is a timeline of IDA plug-ins and their approach to collaboration using IDA:
• IDA Sync A plug-in developed by Pedram Amini that uses client-server architecture. Clients connect to a server, and all changes to the IDB done using the specific plug-in hotkeys are immediately transmitted to the other clients. The server keeps a copy of the changes and makes them available for new clients. This plug-in is not actively developed any more, and the last update was in 2012.
• CollabREate A plug-in developed by Chris Eagle and Tim Vidas that provides similar functionality as IDA Sync but improves support for different actions that are monitored and shared with clients. It works similar to a software versioning and revision control system because it allows users to upload and download changes made to the IDB but also to fork the IDB markups to the new project. This is probably the best plug-in for active collaboration using IDA. The plug-in is actively being developed and updated to support the latest versions of IDA.
• BinCrowd A plug-in developed by Zynamics that uses a different approach to collaboration. Unlike the previous two plug-ins, BinCrowd is not designed for active collaboration on the same IDB. Instead, it builds an annotated function database that can be reused on many different samples that share some of the functions. It uses fuzzy matching to find similar functions and renames the matching functions in IDB. The client tool is released as an open-source plug-in, but the server component was never released and has been discontinued.
• IDA Toolbag A plug-in developed by Aaron Portnoy, Brandon Edwards, and Kelly Lum. As mentioned earlier in this chapter, this plug-in offers limited collaboration capabilities and is aimed mainly at sharing annotations made with the plug-in. The plug-in is not actively developed any more, but it is still maintained and bugs are getting fixed.
• CrowdRE A plug-in developed by CrowdStrike that is the reincarnation of the BinCrowd plug-in. Unlike the other mentioned plug-ins, this one hasn’t been open-sourced. The IDA plug-in is tied to the CrowdStrike server, which provides a function-matching service. This service-based approach may not be appealing to researchers who don’t wish to share their samples or IDB information with a third party, so you are encouraged to read the EULA before using this plug-in.
Honeypots, Deception Technologies, and Sandboxes Using TrapX
Reverse engineering to determine the full functionality of a binary is the ultimate form of static analysis—but there’s another way to approach it. Dynamic analysis can provide a valuable head start in understanding what the malware binaries are designed to do in your network environment. With this approach, you capture the malware in a honeypot or honeynet and shunt it into a sandbox where the binaries execute in a safe environment. This way, you can extract the forensic data and reveal exactly what the binaries are designed to do to your network connections, files, and system configuration in real time.
Dynamic analysis jumpstarts your reverse-engineering efforts with rapid “first pass” information that reveals immediately what the binaries are trying to do. You can then drill down into how they’re doing it with your other reverse-engineering tools. This can save you a lot of time: you might not even need to undertake a full manual reverse-engineering effort once you have the information from the dynamic analysis.
A Free Tool for Dynamic Analysis
You can start dynamic analysis with a free product such as the TrapX Threat Inspector, an advanced stand-alone memory dump analysis process based on the open-source Volatility package (https://code.google.com/p/volatility/). This free tool lets you inspect the memory of virtual machines, in real time. Memory analysis does allow you to do some basic binary reverse engineering of processes on a live system.
The TrapX Threat Inspector (shown in Figure 23-10) runs a forensic memory dump analysis on a potentially infected workstation in the organization network. This analysis uses predefined rules and commands to analyze the dump file from the workstation, and stores analysis outputs in the local database. You can also view the data in a report format, from the application user interface.
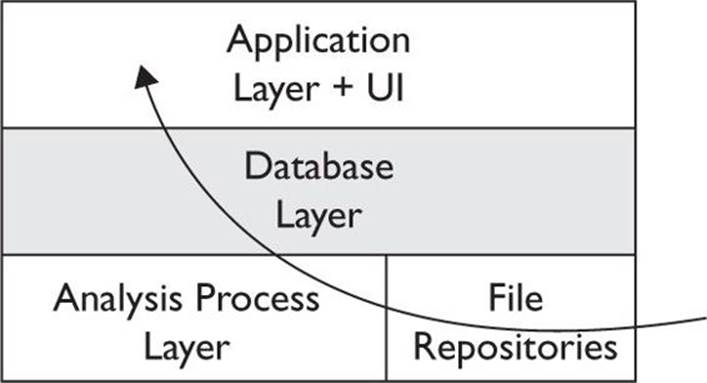
Figure 23-10 TrapX Threat Inspector manager architecture and process flow
The process begins with the file repositories, which store the memory dump file retrieved from the infected workstation. The next step is the analysis process, which runs an analysis application on each new file. It stores output in the database layer, for access using the application layer and UI.
The Application layer can define multiple XML files using different policies. Depending on the plug-in commands you select, you can perform the following tasks:
• Detect API hooks in process and kernel memory.
• Print a list of open connections.
• Dump crash-dump information.
• Dump DLLs from a process address space.
• Print a list of loaded DLLs for each process.
• Find hidden and injected code.
• Print all running processes.
• Print a list of open sockets.
• Scan for Windows services.
• Find hidden and injected code.
At the UI level, you can view the data from the memory dump analysis, which shows tables and views according to the database schema. You can also access a dashboard that displays the following:
• The memory dump execution tool download page
• The dump analysis upload page
• A snapshot from recent analysis process events
• A list of infected workstations
A Commercial Alternative: TrapX Malware Trap
Once you’ve tested out the freeware, chances are you’ll be eager to take advantage of the speed and convenience of using dynamic analysis to jumpstart your reverse-engineering efforts. If that’s the case, you’ll probably want to take it to the next level and get all the capabilities of a commercial product.
The TrapX Malware Trap, from the same company that created the TrapX Threat Inspector, is a unique automated virtual sensor or DeceptionGridTM that provides adaptive deception and defense for critical assets. This automated solution continually monitors for potential problems and aims to capture malware by simulating vulnerable system services to attract hackers and worms and trigger their payloads for analysis. For once, we have an effective way to capture and analyze 0-day threats that have no existing signatures!
The Malware Trap technology is based on a virtual honeypot system installed above the low-level kernel. The system can be integrated as a hardware appliance or as a virtual appliance for VMware, Hyper-V, or Xen framework. The current version of Malware Trap is a medium-high interaction honeypot that includes the following service emulations:
• Network services HTTP, HTTPS, FTP, MS SQL, MYSQL, SIP, SIP TLS, SMB, DNS, SMTP, TELNET (Cisco)
• SCADA Services HTTP, FTP, TELNET, MODBUS, DNP3
The Malware Trap uses a smart internal proxy that discovers attacks in the initial stage and can manipulate the network stream on the fly. When it senses hostile scans, it creates new and targeted malware traps to capture new attacks and break the attacker’s kill chain. To this end, it runs multiple emulations of your operational systems, network devices, and services. To simplify administration and ease scalability, the Malware Trap runs asset discovery and network mapping in order to learn about and better simulate your network. This is the first virtualized honeynet platform that can emulate hundreds of nodes/services using an automated discovery process.
The DeceptionGridTM or malware trap moves the captured malware to a sandbox, where it can reach back to its command and control and download its full payload, so you can find out what the malware is looking for and the address it communicates with, and thus deduce where it’s from. The Malware Trap works with a policy-based Botnet Detector to share real-time intelligence and automatically monitor lateral and outbound communications. You can send the IP addresses you discover into your other security devices and further monitor or block all traffic to those addresses.
The Malware Trap technology lures attackers or 0-day code into the DeceptionGridTM for full interaction inside the sandbox. Therefore, you can collect complete information on what the malware is doing. This active form of a malware trap offers several key advantages over signature-based technology. By definition, signature-based technology requires a signature or known-bad example of the malware to be detected first. Today’s threats evolve too quickly for signature-based technologies to keep up. Most other alternative malware technologies are either host based and are subject to malware attacks directly or are perimeter based and rely on signature-based solutions that are unable to adapt to real-time attacks.
With the Malware Trap providing a fully realistic environment simulation for malware capture, you can choose whether to monitor the attack for intelligence gathering, or to stop it by capturing the malware and performing a forensic analysis, in near real time. The Malware Trap will catch the threat—including the malicious code and the network streams—for future investigation in the management console.
The Malware Trap includes the TrapX DeceptionGridTM Intelligence management console to perform smart analysis on the malicious code. You can use it to control Malware Trap sensors and network sensors from the cloud or from an enterprise in-network solution. The management console summarizes sensor events, listing active sensors and specifying the source infected, malware name, sensor name, and timestamp of the event. It also displays a graphical view of the malware event severity score, as calculated by internal algorithms. Graphical displays show the most frequently occurring malware attacks and charts malware trends, as shown in Figure 23-11.

Figure 23-11 TrapX Cloud Management console
The TrapX dynamic malware analysis solution helps speed your reaction time, enabling you to quickly identify, analyze, and respond to malware before it impacts your organization—and more quickly than it would take you to reverse engineer the malware that comes your way.
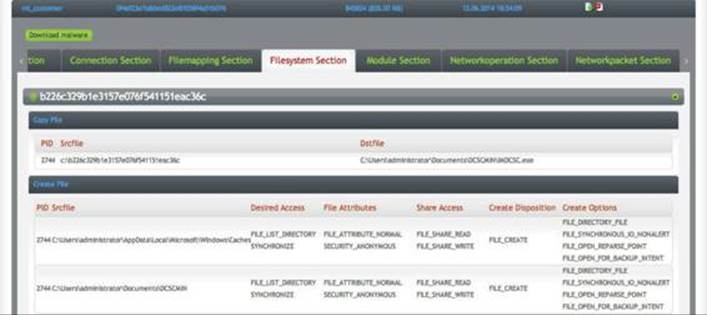
After you click an interesting malware, a deep dive forensic view can be obtained, as shown here:
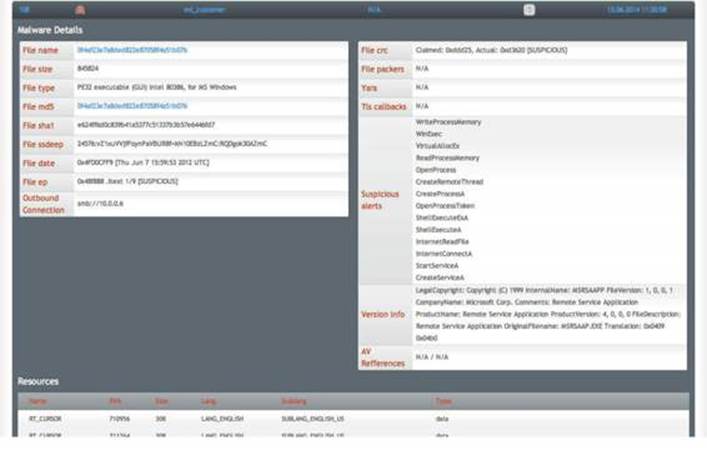
Further, by clicking the file hash, you can obtain more details:
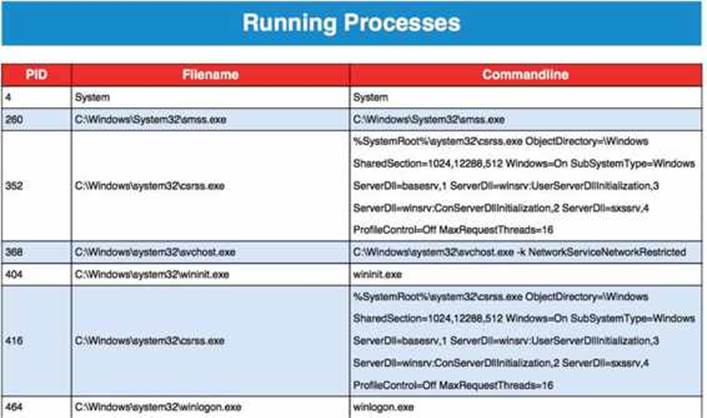
A detailed PDF report may also be obtained, as shown here:
This level of data gives a reverse engineer a head start on the reversing process. By knowing the behavior of the binary, the reverser can focus their efforts on what is unknown and greatly speed up the process.
Summary
Reverse engineers comprise a very active community that constantly releases new analysis tools and techniques. In the vast number of available resources, some interesting tools and research may fall through the cracks and be unjustly overlooked. This chapter was aimed at presenting some relatively new tools and plug-ins that, if given a chance, may significantly improve your analysis.
References
1. Plohmann, Daniel, and Alexander Hanel (2012). Nihilus/Idascope. Retrieved from GitHub: github.com/nihilus/idascope/blob/master/idascope/widgets/FunctionInspectionWidget.py.
For Further Reading
BinCrowd IDA plug-in code.google.com/p/zynamics/source/checkout?repo=bincrowd-plugin.
CollabREate IDA plug-in sourceforge.net/projects/collabreate/.
CrowdDetox IDA plug-in github.com/CrowdStrike/CrowdDetox.
CrowdRE IDA plug-in www.crowdstrike.com/crowdre/downloads/.
funcap IDA plug-in github.com/deresz/funcap.
Hexrays_tools IDA plug-in www.hex-rays.com/contests/2013/hexrays_tools.zip.
HexRaysCodeXplorer IDA plug-in github.com/REhints/HexRaysCodeXplorer.
IDA plugin contest www.hex-rays.com/contests/index.shtml.
IDA Pro FindCrypt www.hexblog.com/?p=27.
IDA Pro FindCrypt2 www.hexblog.com/?p=28.
IDA Sync plug-in www.openrce.org/downloads/details/2.
IDA Toolbag plug-in thunkers.net/~deft/code/toolbag/.
IDA2Sql plug-in wiki.github.com/zynamics/ida2sql-plugin-ida.
IDAScope plug-in bitbucket.org/daniel_plohmann/simplifire.idascope/.
Optimice IDA plug-in code.google.com/p/optimice/.
PatchDiff2 IDA plug-in code.google.com/p/patchdiff2/.
TrapX www.trapx.com.
YARA plusvic.github.io/yara/.