Praise for Gray Hat Hacking: The Ethical Hacker’s Handbook, Fourth Edition (2015)
PART I. Crash Course: Preparing for the War
CHAPTER 3. Static Analysis
What is reverse engineering? At the highest level, it is simply taking a product apart to understand how it works. You might do this for many reasons, including to
• Understand the capabilities of the product’s manufacturer
• Understand the functions of the product in order to create compatible components
• Determine whether vulnerabilities exist in a product
• Determine whether an application contains any undocumented functionality
Many different tools and techniques have been developed for reverse engineering software. We focus in this chapter on those tools and techniques that are most helpful in revealing flaws in software. We discuss static (also called passive) reverse engineering techniques in which you attempt to discover potential flaws and vulnerabilities simply by examining source or compiled code. In the following chapters, we will discuss more active means of locating software problems and how to determine whether those problems can be exploited.
In this chapter, we cover the following topics:
• Ethical reverse engineering
• Extending your skills with reverse engineering
• Analyzing source code
• Performing binary analysis
Ethical Reverse Engineering
Where does reverse engineering fit in for the ethical hacker? Reverse engineering is often viewed as the craft of the cracker who uses her skills to remove copy protection from software or media. As a result, you might be hesitant to undertake any reverse engineering effort. The Digital Millennium Copyright Act (DMCA) is often brought up whenever reverse engineering of software is discussed. In fact, reverse engineering is addressed specifically in the anti-circumvention provisions of the DMCA (section 1201(f)). We will not debate the merits of the DMCA here, but will note that it is still wielded to prevent publication of security-related information obtained through the reverse engineering process (see the “For Further Reading” section). It is worth remembering that exploiting a buffer overflow in a network server is a bit different from cracking a digital rights management (DRM) scheme protecting an MP3 file. You can reasonably argue that the first situation steers clear of the DMCA whereas the second lands right in the middle of it.
When dealing with copyrighted works, two sections of the DMCA are of primary concern to the ethical hacker, sections 1201(f) and 1201(j). Section 1201(f) addresses reverse engineering in the context of learning how to interoperate with existing software, which is not what you are after in a typical vulnerability assessment. Section 1201(j) addresses security testing and relates more closely to the ethical hacker’s mission in that it becomes relevant when you are reverse engineering an access control mechanism. The essential point is that you are allowed to conduct such research as long as you have the permission of the owner of the subject system and you are acting in good faith to discover and secure potential vulnerabilities. Refer to Chapter 1 for a more detailed discussion of the DMCA.
Why Bother with Reverse Engineering?
With all the other techniques covered in this book, why would you ever want to resort to something as tedious as reverse engineering? You should be interested in reverse engineering if you want to extend your vulnerability assessment skills beyond the use of the pen tester’s standard bag of tricks. It doesn’t take a rocket scientist to run Nessus and report its output. Unfortunately, such tools can only report on what they know. They can’t report on undiscovered vulnerabilities, and that is where your skills as a reverse engineer come into play.
If you want to move beyond the standard features of Canvas or Metasploit and learn how to extend them effectively, you will probably want to develop at least some rudimentary reverse engineering skills. Vulnerability researchers use a variety of reverse engineering techniques to find new vulnerabilities in existing software. You may be content to wait for the security community at large to discover and publicize vulnerabilities for the more common software components that your pen-test client happens to use. But who is doing the work to discover problems with the custom, web-enabled payroll application that Joe Coder in the accounting department developed and deployed to save the company money? Possessing some reverse engineering skills will pay big dividends whether you want to conduct a more detailed analysis of popular software or you encounter those custom applications that some organizations insist on running.
Reverse Engineering Considerations
Vulnerabilities exist in software for any number of reasons. Some people would say that they all stem from programmer incompetence. Although there are those who have never seen a compiler error, let he who has never dereferenced a null pointer cast the first stone. In actuality, the reasons are far more varied and may include
• Failure to check for error conditions
• Poor understanding of function behaviors
• Poorly designed protocols
• Improper testing for boundary conditions
 CAUTION Uninitialized pointers contain unknown data. Null pointers have been initialized to point to nothing so they are in a known state. In C/C++ programs, attempting to access data (dereferencing) through either usually causes a program to crash or, at minimum, results in unpredictable behavior.
As long as you can examine a piece of software, you can look for problems such as those just listed. How easily you can find those problems depends on a number of factors:
• Do you have access to the source code for the software? If so, the job of finding vulnerabilities may be easier because source code is far easier to read than compiled code.
• How much source code is there? Complex software consisting of thousands (perhaps tens of thousands) of lines of code will require significantly more time to analyze than smaller, simpler pieces of software.
• What tools are available to help you automate some or all of this source code analysis?
• What is your level of expertise in a given programming language?
• Are you familiar with common problem areas for a given language?
• What happens when source code is not available and you only have access to a compiled binary?
• Do you have tools to help you make sense of the executable file? Tools such as disassemblers and decompilers can drastically reduce the amount of time it takes to audit a binary file.
In the remainder of this chapter, we answer all of these questions and attempt to familiarize you with some of the reverse engineer’s tools of the trade.
Source Code Analysis
If you are fortunate enough to have access to an application’s source code, the job of reverse engineering the application will be much easier. Make no mistake, it will still be a long and laborious process to understand exactly how the application accomplishes each of its tasks, but it should be easier than tackling the corresponding application binary. A number of tools exist that attempt to scan source code automatically for known poor programming practices. These tools can be particularly useful for larger applications. Just remember that automated tools tend to catch common cases and provide no guarantee that an application is secure.
Source Code Auditing Tools
Many source code auditing tools are freely available on the Internet. Some of the more common ones include ITS4, RATS (Rough Auditing Tool for Security), Flawfinder, and Splint (Secure Programming Lint). The Microsoft PREfast Analysis Tool for driver analysis is now integrated into Microsoft Visual Studio Ultimate 2012 and the Windows 8 release of the Windows Driver Kit (WDK). On the commercial side, several vendors offer dedicated source code auditing tools that integrate into several common development environments such as Eclipse and Visual Studio. The commercial tools range in price from several thousand dollars to tens of thousands of dollars.
ITS4, RATS, and Flawfinder all operate in a fairly similar manner. Each one consults a database of poor programming practices and lists all of the danger areas found in scanned programs. In addition to known insecure functions, RATS and Flawfinder report on the use of stack allocated buffers and cryptographic functions known to incorporate poor randomness. RATS alone has the added capability that it can scan Perl, PHP, and Python code, as well as C code.
From the commercial side, AppScan Source from IBM or Fortify from HP are the best ranked in the market. AppScan does not compile the code by itself; instead, you configure it for the environment needed for a successful compilation (JDK, Visual Studio, GCC). At the time of this writing, AppScan does not support managed code from Visual Studio, an important limitation. Source code tools are more expensive but more effective in finding bugs than black box tools like WebInspect or Acunetix Web Vulnerability Scanner, which, owing to the lack of whole app visibility, can miss important bugs.
For demonstration purposes, we’ll take a look at a file named find.c, which implements a UDP-based remote file location service. We take a closer look at the source code for find.c later. For the time being, let’s start off by running find.c through RATS. Here, we ask RATS to list input functions, output only default and high-severity warnings, and use a vulnerability database named rats-c.xml:
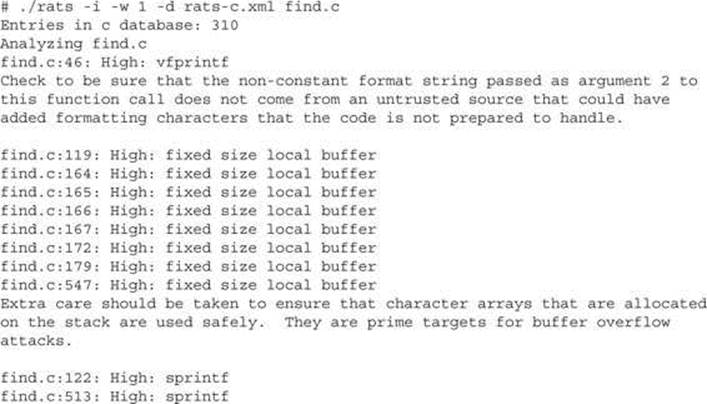
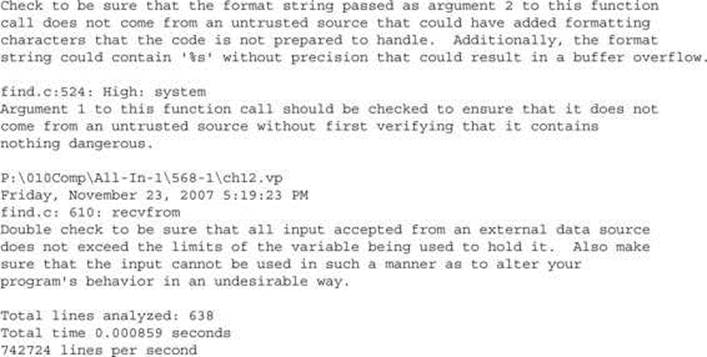
Here, RATS informs us about a number of stack allocated buffers and points to a couple of function calls for further, manual investigation. Fixing these problems generally is easier than determining if they are exploitable and under what circumstances. For find.c, it turns out that exploitable vulnerabilities exist at both sprintf() calls, and the buffer declared at line 172 can be overflowed with a properly formatted input packet. However, there is no guarantee that all potentially exploitable code will be located by such tools. For larger programs, the number of false positives increases and the usefulness of the tool for locating vulnerabilities decreases. It is left to the tenacity of the auditor to run down all of the potential problems.
Splint is a derivative of the C semantic checker Lint and, as such, generates significantly more information than any of the other tools. Splint points out many types of programming problems, such as use of uninitialized variables, type mismatches, potential memory leaks, use of typically insecure functions, and failure to check function return values.
CAUTION Many programming languages allow the programmer to ignore the values returned by functions. This is a dangerous practice because function return values are often used to indicate error conditions. Assuming that all functions complete successfully is another common programming problem that leads to crashes.
In scanning for security-related problems, the major difference between Splint and the other free tools is that Splint recognizes specially formatted comments embedded in the source files that it scans. Programmers can use Splint comments to convey information to Splint concerning things such as pre- and postconditions for function calls. Although these comments are not required for Splint to perform an analysis, their presence can improve the accuracy of Splint’s checks. Splint recognizes a large number of command-line options that can turn off the output of various classes of errors. If you are interested in strictly security-related issues, you may need to use several options to cut down on the size of Splint’s output.
Microsoft’s PREfast tool has the advantage of being tightly integrated with the Visual Studio suite. Enabling the use of PREfast for all software builds is a simple matter of enabling code analysis within your Visual Studio properties. With code analysis enabled, source code is analyzed automatically each time you attempt to build it, and warnings and recommendations are reported inline with any other build-related messages. Typical messages report the existence of a problem and, in some cases, make recommendations for fixing each problem. Like Splint, PREfast supports an annotation capability that allows programmers to request more detailed checks from PREfast through the specification of pre- and postconditions for functions.
 NOTE Preconditions are a set of one or more conditions that must be true upon entry into a particular portion of a program. Typical preconditions might include the fact that a pointer must not be NULL or that an integer value must be greater than zero. Postconditions are a set of conditions that must hold upon exit from a particular section of a program. These often include statements regarding expected return values and the conditions under which each value might occur.
One of the drawbacks to using PREfast is that it may require substantial effort to use with projects that have been created on Unix-based platforms, effectively eliminating it as a scanning tool for such projects.
The Utility of Source Code Auditing Tools
Clearly, source code auditing tools can focus developers’ eyes on problem areas in their code, but how useful are they for ethical hackers? The same output is available to both the white hat and the black hat hacker, so how is each likely to use the information?
The White Hat Point of View
The goal of a white hat reviewing the output of a source code auditing tool should be to make the software more secure. If we trust that these tools accurately point to problem code, it will be in the white hat’s best interest to spend her time correcting the problems noted by these tools. It requires far less time to convert strcpy() to strncpy() than it does to backtrack through the code to determine if that same strcpy() function is exploitable. The use of strcpy() and similar functions does not by itself make a program exploitable.
NOTE The strcpy() function is dangerous because it copies data into a destination buffer without any regard for the size of the buffer and, therefore, may overflow the buffer. One of the inputs to the strncpy() function is the maximum number of characters to be copied into the destination buffer.
Programmers who understand the details of functions such as strcpy() will often conduct testing to validate any parameters that will be passed to such functions. Programmers who do not understand the details of these exploitable functions often make assumptions about the format or structure of input data. While changing strcpy() to strncpy() may prevent a buffer overflow, it also has the potential to truncate data, which may have other consequences later in the application.
CAUTION The strncpy() function can still prove dangerous. Nothing prevents the caller from passing an incorrect length for the destination buffer, and under certain circumstances, the destination string may not be properly terminated with a null character.
It is important to make sure that proper validation of input data is taking place. This is the time-consuming part of responding to the alerts generated by source code auditing tools. Having spent the time to secure the code, you have little need to spend much more time determining whether the original code was actually vulnerable, unless you are trying to prove a point. Remember, however, that receiving a clean bill of health from a source code auditing tool by no means implies the program is bulletproof. The only hope of completely securing a program is through the use of secure programming practices from the outset and through periodic manual review by programmers familiar with how the code is supposed to function.
NOTE For all but the most trivial of programs, it is virtually impossible to formally prove that a program is secure.
The Black Hat Point of View
The black hat is, by definition, interested in finding out how to exploit a program. For the black hat, output of source code auditing tools can serve as a jumping-off point for finding vulnerabilities. The black hat has little reason to spend time fixing the code because this defeats his purpose. The level of effort required to determine whether a potential trouble spot is vulnerable is generally much higher than the level of effort the white hat will expend fixing that same trouble spot. And, as with the white hat, the auditing tool’s output is by no means definitive. It is entirely possible to find vulnerabilities in areas of a program not flagged during the automated source code audit.
The Gray Hat Point of View
So where does the gray hat fit in here? Often the gray hat’s job is not to fix the source code she audits. She should certainly present her finding to the maintainers of the software, but there is no guarantee that they will act on the information, especially if they do not have the time or, worse, refuse to seriously consider the information that they are being furnished. In cases where the maintainers refuse to address problems noted in a source code audit, whether automated or manual, it may be necessary to provide a proof-of-concept demonstration of the vulnerability of the program. In these cases, the gray hat should understand how to make use of the audit results to locate actual vulnerabilities and develop proof-of-concept code to demonstrate the seriousness of these vulnerabilities. Finally, it may fall on the auditor to assist in developing a strategy for mitigating the vulnerability in the absence of a vendor fix, as well as to develop tools for automatically locating all vulnerable instances of an application within an organization’s network.
Manual Source Code Auditing
How can you verify all the areas of a program that the automated scanners may have missed? How do you analyze programming constructs that are too complex for automated analysis tools to follow? In these cases, manual auditing of the source code may be your only option. Your primary focus should be on the ways in which user-supplied data is handled within the application. Because most vulnerabilities are exploited when programs fail to handle user input properly, it is important to understand first how data is passed to an application, and second what happens with that data.
Sources of User-Supplied Data
The following table contains just a few of the ways in which an application can receive user input and identifies for each some of the C functions used to obtain that input. (This table by no means represents all possible input mechanisms or combinations.)
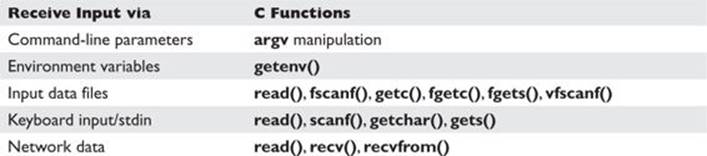
In C, any of the file-related functions can be used to read data from any file, including the standard C input file stdin. Also, because Unix systems treat network sockets as file descriptors, it is not uncommon to see file input functions (rather than the network-oriented functions) used to read network data. Finally, it is entirely possible to create duplicate copies of file/socket descriptors using the dup() or dup2() function.
NOTE In C/C++ programs, file descriptors 0, 1, and 2 correspond to the standard input (stdin), standard output (stdout), and standard error (stderr) devices. The dup2() function can be used to make stdin become a copy of any other file descriptor, including network sockets. Once this has been done, a program no longer accepts keyboard input; instead, input is taken directly from the network socket.
If the dup2(0) function is used to make stdin a copy of a network socket, you might observe getchar() or gets() being used to read incoming network data. Several of the source code scanners take command-line options that will cause them to list all functions (such as those noted previously) in the program that take external input. Running ITS4 in this fashion against find.c yields the following:
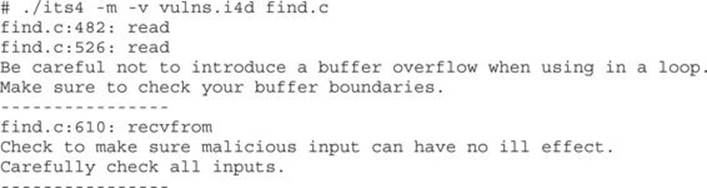
To locate vulnerabilities, you need to determine which types of input, if any, result in user-supplied data being manipulated in an insecure fashion. First, you need to identify the locations at which the program accepts data. Second, you need to determine if there is an execution path that will pass the user data to a vulnerable portion of code. In tracing through these execution paths, note the conditions that are required to influence the path of execution in the direction of the vulnerable code. In many cases, these paths are based on conditional tests performed against the user data. To have any hope of the data reaching the vulnerable code, the data will need to be formatted in such a way that it successfully passes all conditional tests between the input point and the vulnerable code. In a simple example, a web server might be found to be vulnerable when a GETrequest is performed for a particular URL, whereas a POST request for the same URL is not vulnerable. This can easily happen if GET requests are farmed out to one section of code (that contains a vulnerability) and POST requests are handled by a different section of code that may be secure. More complex cases might result from a vulnerability in the processing of data contained deep within a remote procedure call (RPC) parameter that may never reach a vulnerable area on a server unless the data is packaged in what appears, from all respects, to be a valid RPC request.
Common Problems Leading to Exploitable Conditions
Do not restrict your auditing efforts to searches for calls to functions known to present problems. A significant number of vulnerabilities exist independently of the presence of any such calls. Many buffer copy operations are performed in programmer-generated loops specific to a given application, as the programmers wish to perform their own error checking or input filtering, or the buffers being copied do not fit neatly into the molds of some standard API functions. Some of the behaviors that auditors should look for include the following:
• Does the program make assumptions about the length of user-supplied data? What happens when the user violates these assumptions?
• Does the program accept length values from the user? What size data (1, 2, 4 bytes, etc.) does the program use to store these lengths? Does the program use signed or unsigned values to store these length values? Does the program check for the possible overflow conditions when utilizing these lengths?
• Does the program make assumptions about the content/format of user-supplied data? Does the program attempt to identify the end of various user fields based on content rather than length of the fields?
• How does the program handle situations in which the user has provided more data than the program expects? Does the program truncate the input data, and if so, is the data properly truncated? Some functions that perform string copying are not guaranteed to properly terminate the copied string in all cases. One such example is strncat. In these cases, subsequent copy operations may result in more data being copied than the program can handle.
• When handling C-style strings, is the program careful to ensure that buffers have sufficient capacity to handle all characters including the null termination character?
• For all array/pointer operations, are there clear checks that prevent access beyond the end of an array?
• Does the program check return values from all functions that provide them? Failure to do so is a common problem when using values returned from memory allocation functions such as malloc(), calloc(), realloc(), and new().
• Does the program properly initialize all variables that might be read before they are written? If not, in the case of local function variables, is it possible to perform a sequence of function calls that effectively initializes a variable with user-supplied data?
• Does the program make use of function or jump pointers? If so, do these reside in writable program memory?
• Does the program pass user-supplied strings to any function that might, in turn, use those strings as format strings? It is not always obvious that a string may be used as a format string. Some formatted output operations can be buried deep within library calls and are, therefore, not apparent at first glance. In the past, this has been the case in many logging functions created by application programmers.
Example Using find.c
Using find.c as an example, how would this manual source code auditing process work? We need to start with user data entering the program. As seen in the preceding ITS4 output, a recvfrom() function call accepts an incoming UDP packet. The code surrounding the call looks like this:
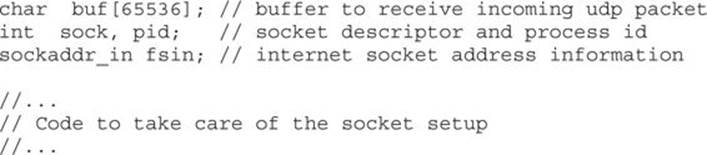
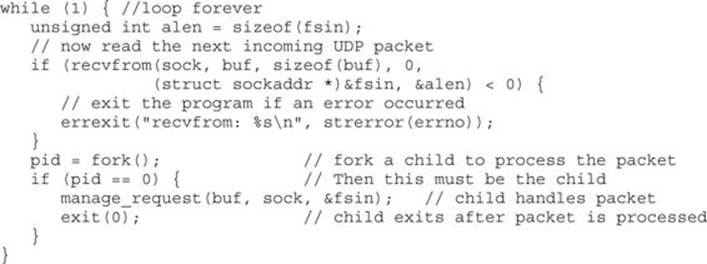
The preceding code shows a parent process looping to receive incoming UDP packets using the recvfrom() function. Following a successful recvfrom(), a child process is forked and the manage_request() function is called to process the received packet. We need to trace intomanage_request() to see what happens with the user’s input. We can see right off the bat that none of the parameters passed in to manage_request() deals with the size of buf, which should make the hair on the back of our necks stand up. The manage_request() function starts out with a number of data declarations, as shown here:
Here, we see the declaration of many of the fixed-size buffers noted earlier by RATS. We know that the input parameter buf points to the incoming UDP packet, and the buffer may contain up to 65,535 bytes of data (the maximum size of a UDP packet). There are two interesting things to note here: First, the length of the packet is not passed into the function, so bounds checking will be difficult and perhaps completely dependent on well-formed packet content. Second, several of the local buffers are significantly smaller than 65,535 bytes, so the function had better be very careful how it copies information into those buffers. Earlier, it was mentioned that the buffer at line 172 is vulnerable to an overflow. That seems a little difficult given that there is a 64KB buffer sitting between it and the return address.
NOTE Local variables are generally allocated on the stack in the order in which they are declared, which means that replybuf generally sits between envstrings and the saved return address. Recent versions of gcc/g++ (version 4.1 and later) perform stack variable reordering, which makes variable locations far less predictable.
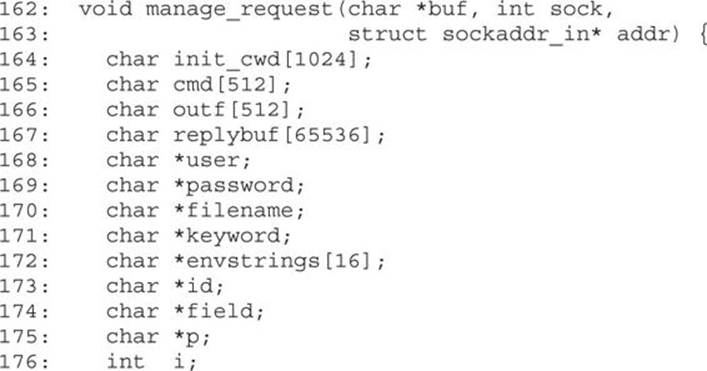
The function proceeds to set some of the pointers by parsing the incoming packet, which is expected to be formatted as follows:
The pointers in the stack are set by locating the key name, searching for the following space, and incrementing by one character position. The values become null terminated when the trailing \n is located and replaced with \0. If the key names are not found in the order listed, or trailing \ncharacters fail to be found, the input is considered malformed and the function returns. Parsing the packet goes well until processing of the optional environ values begins. The environ field is processed by the following code (note, the pointer p at this point is positioned at the next character that needs parsing within the input buffer):
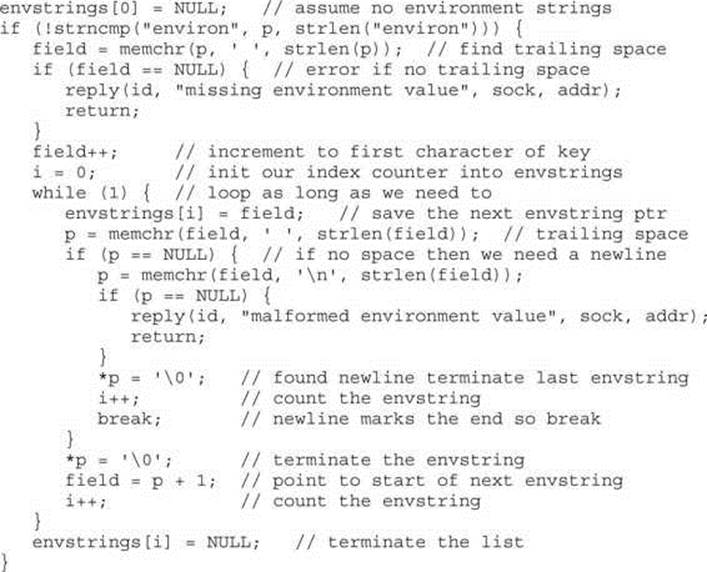
Following the processing of the environ field, each pointer in the envstrings array is passed to the putenv() function, so these strings are expected to be in the form key=value. In analyzing this code, note that the entire environ field is optional, but skipping it wouldn’t be any fun for us. The problem in the code results from the fact that the while loop that processes each new environment string fails to do any bounds checking on the counter i, but the declaration of envstrings only allocates space for 16 pointers. If more than 16 environment strings are provided, the variables below the envstrings array on the stack will start to get overwritten. We have the makings of a buffer overflow at this point, but the question becomes: “Can we reach the saved return address?” Performing some quick math tells us that there are about 67,600 bytes of stack space between theenvstrings array and the saved frame pointer/saved return address. Because each member of the envstrings array occupies 4 bytes, if we add 67,600/4 = 16,900 additional environment strings to our input packet, the pointers to those strings will overwrite all of the stack space up to the saved frame pointer.
Two additional environment strings will give us an overwrite of the frame pointer and the return address. How can we include 16,918 environment strings if the form key=value is in our packet? If a minimal environment string, say x=y, consumes 4 bytes counting the trailing space, then it would seem that our input packet needs to accommodate 67,672 bytes of environment strings alone. Because this is larger than the maximum UDP packet size, we seem to be out of luck. Fortunately for us, the preceding loop does no parsing of each environment string, so there is no reason for a malicious user to use properly formatted (key=value) strings. It is left to you to verify that placing approximately 16,919 space characters between the keyword environ and the trailing carriage return should result in an overwrite of the saved return address. Since an input line of that size easily fits in a UDP packet, all we need to do now is consider where to place our shellcode. The answer is to make it the last environment string, and the nice thing about this vulnerability is that we don’t even need to determine what value to overwrite the saved return address with, as the preceding code handles it for us. Understanding that point is also left to you as an exercise.
Automated Source Code Analysis
It was just a matter of time before someone came up with a tool to automate some of the mundane source code review tools and processes.
Yasca
In 2008, a new automated source code analysis tool was released. It is appropriately called Yet Another Source Code Analyzer (Yasca). Yasca, written by Michael Scovetta, allows for the automation of many other open source tools like RATS, JLint, PMD, FindBugs, FxCop, cppcheck, phplint, and pixy. Using these tools, Yasca allows for the automated review of the following:
• C/C++
• Java source and class files
• JSP source files
• PHP source files
• Perl
• Python
Yasca is a framework that comes with a variety of plug-ins (you may write your own plug-ins as well). Yasca is easy to use; you download the core package and plug-ins (optional), expand them into an installation directory, and then point to the source directory from the command line. For example:
C:\yasca\yasca-2.1>yasca resources\test
The tool produces an HTML document that includes links to the problems and allows you to preview the problem directly from the report.
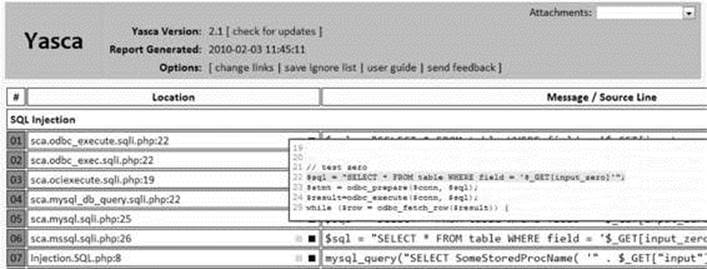
This common vulnerability report marks a quantum leap from the previously separate, command-line-only tools. At the time of writing, this tool is mainly supported on Windows, but it should work on Linux platforms as well.
Binary Analysis
Source code analysis will not always be possible. This is particularly true when evaluating closed source, proprietary applications. This by no means prevents the reverse engineer from examining an application; it simply makes such an examination a bit more difficult. Binary auditing requires a more expansive skill set than source code auditing requires. Whereas a competent C programmer can audit C source code regardless of what type of architecture the code is intended to be compiled on, auditing binary code requires additional skills in assembly language, executable file formats, compiler behavior, operating system internals, and various other, lower-level skills. Books offering to teach you how to program are a dime a dozen, whereas books that cover the topic of reverse engineering binaries are few and far between. Proficiency at reverse engineering binaries requires patience, practice, and a good collection of reference material. All you need to do is consider the number of different assembly languages, high-level languages, compilers, and operating systems that exist to begin to understand how many possibilities there are for specialization.
Manual Auditing of Binary Code
Two types of tools that greatly simplify the task of reverse engineering a binary file are disassemblers and decompilers. The purpose of a disassembler is to generate assembly language from a compiled binary, whereas the purpose of a decompiler is to attempt to generate source code from a compiled binary. Each task has its own challenges, and both are certainly difficult, with decompilation being by far the more difficult of the two. This is because the act of compiling source code is both a lossy operation, meaning information is lost in the process of generating machine language, and a one-to-many operation, meaning there are many valid translations of a single line of source code to equivalent machine language statements. Information that is lost during compilation can include variable names and data types, making recovery of the original source code from the compiled binary all but impossible. Additionally, a compiler asked to optimize a program for speed will generate vastly different code from what it will generate if asked to optimize that same program for size. Although both compiled versions will be functionally equivalent, they will look very different to a decompiler.
Decompilers
Decompilation is perhaps the holy grail of binary auditing. With true decompilation, the notion of a closed source product vanishes, and binary auditing reverts to source code auditing as discussed previously. As mentioned earlier, however, true decompilation is an exceptionally difficult task. Some languages lend themselves very nicely to decompilation whereas others do not. Languages that offer the best opportunity for decompilation are typically hybrid compiled/interpreted languages such as Java or Python. Both are examples of languages that are compiled to an intermediate, machine-independent form, generally called byte code. This machine-independent byte code is then executed by a machine-dependent byte code interpreter. In the case of Java, this interpreter is called a Java Virtual Machine (JVM).
Two features of Java byte code make it particularly easy to decompile. First, compiled Java byte code files, called class files, contain a significant amount of descriptive information. Second, the programming model for the JVM is fairly simple, and its instruction set is fairly small. Both of these properties are true of compiled Python (.pyc) files and the Python interpreter as well. A number of open source Java decompilers do an excellent job of recovering Java source code, including JReversePro and Jad (Java Decompiler). For Python PYC files, the decompyle project offers source code recovery services, but as of this writing, the open source version only handles Python files from versions 2.3 and earlier (Python 2.5.1 is the version used in this section). For Python 2.7, try uncompyle2 from GitHub; check the “For Further Reading” section.
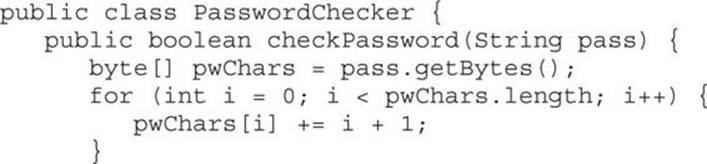
Java Decompilation Example The following simple example demonstrates the degree to which source code can be recovered from a compiled Java class file. The original source code for the class PasswordChecker appears here:
JReversePro is an open source Java decompiler that is itself written in Java. Running JReversePro on the compiled PasswordChecker.class file yields the following:
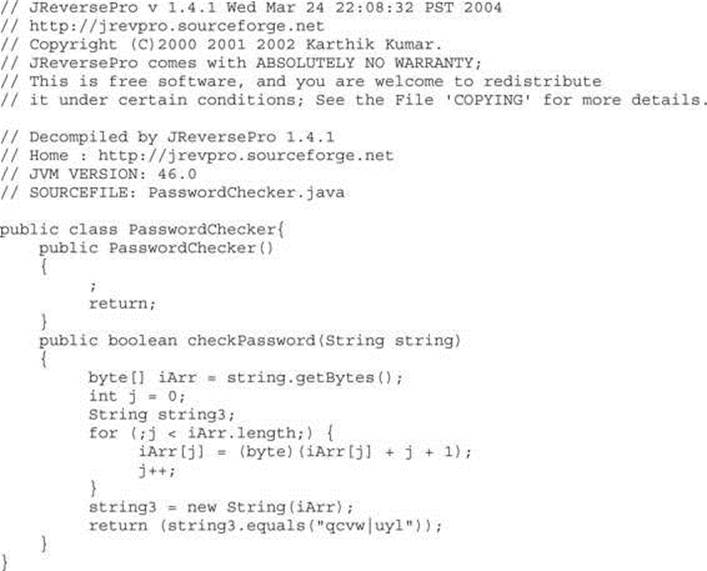
The quality of the decompilation is quite good. There are only a few minor differences in the recovered code. First, we see the addition of a default constructor that is not present in the original but added during the compilation process.
NOTE In object-oriented programming languages, object data types generally contain a special function called a constructor. Constructors are invoked each time an object is created in order to initialize each new object. A default constructor is one that takes no parameters. When a programmer fails to define any constructors for declared objects, compilers generally generate a single default constructor that performs no initialization.
Second, note that we have lost all local variable names and that JReversePro has generated its own names according to variable types. JReversePro is able to recover class names and function names fully, which helps to make the code very readable. If the class had contained any class variables, JReversePro would have been able to recover their original names as well. We can recover this much data from Java files because of the amount of information stored in each class file, including items such as class names, function names, function return types, and function parameter signatures. All of this is clearly visible in a simple hex dump of a portion of a class file:
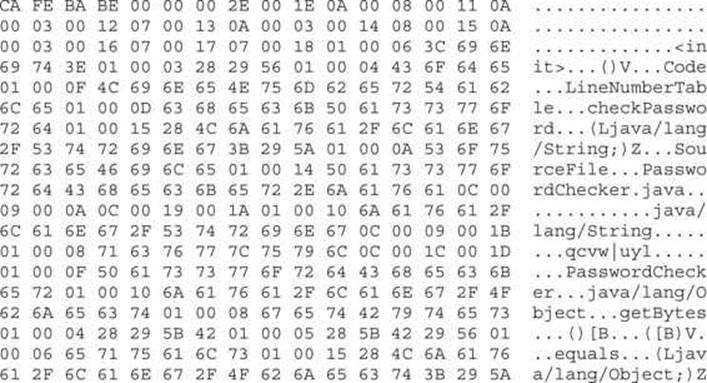
With all of this information present, it is a relatively simple matter for any Java decompiler to recover high-quality source code from a class file.
Decompilation in Other Compiled Languages Unlike Java and Python, which compile to a platform-independent byte code, languages like C and C++ are compiled to platform-specific machine language and linked to operating system–specific libraries. This is the first obstacle to decompiling programs written in such languages. A different decompiler is required for each machine language that we wish to decompile. Further complicating matters, compiled programs are generally stripped of all debugging and naming (symbol) information, making it impossible to recover any of the original names used in the program, including function and variable names and type information. Nevertheless, research and development on decompilers does continue. The leading contender in this arena is a product from the author of the Interactive Disassembler Professional (IDA Pro, discussed shortly). The tool, named Hex-Rays Decompiler, is an IDA Pro plug-in that can be used to generate decompilations of compiled x86 programs. Both tools are available from www.hex-rays.com.
Disassemblers
Whereas decompilation of compiled code is an extremely challenging task, disassembly of that same code is not. For any compiled program to execute, it must communicate some information to its host operating system. The operating system will need to know the entry point of the program (the first instruction that should execute when the program is started); the desired memory layout of the program, including the location of code and data; and what libraries the program will need access to while it is executing. All of this information is contained within an executable file and is generated during the compilation and linking phases of the program’s development. Loaders interpret these executable files to communicate the required information to the operating system when a file is executed. Two common executable file formats are the Portable Executable (PE) file format used for Microsoft Windows executables, and the Executable and Linking Format (ELF) used by Linux and other Unix variants. Disassemblers function by interpreting these executable file formats (in a manner similar to the operating system loader) to learn the layout of the executable and then processing the instruction stream starting from the entry point to break the executable down into its component functions.
IDA Pro
IDA Pro was created by Ilfak Guilfanov and, as mentioned earlier, is perhaps the premier disassembly tool available today. IDA Pro understands a large number of machine languages and executable file formats. At its heart, IDA Pro is actually a database application. When a binary is loaded for analysis, IDA Pro loads each byte of the binary into a database and associates various flags with each byte. These flags can indicate whether a byte represents code, data, or more specific information such as the first byte of a multibyte instruction. Names associated with various program locations and comments generated by IDA Pro or entered by the user are also stored into the database. Disassemblies are saved as IDB files separate from the original binary, and IDB files are referred to as database files. Once a disassembly has been saved to its associated database file, IDA Pro has no need for the original binary, as all information is incorporated into the database file. This is useful if you want to analyze malicious software but don’t want the malicious binary to remain present on your system.
When used to analyze dynamically linked binaries, IDA Pro makes use of embedded symbol table information to recognize references to external functions. Within IDA Pro’s disassembly listing, the use of standard library names helps make the listing far more readable. For example,
call strcpy
is far more readable than
call sub_8048A8C;call the function at address 8048A8C
For statically linked C/C++ binaries, IDA Pro uses a technique termed Fast Library Identification and Recognition Technology (FLIRT), which attempts to recognize whether a given machine language function is known to be a standard library function. This is accomplished by matching disassembled code against signatures of standard library functions used by common compilers. With FLIRT and the application of function type signatures, IDA Pro can produce a much more readable disassembly.
In addition to a straightforward disassembly listing, IDA Pro contains a number of powerful features that greatly enhance your ability to analyze a binary file. Some of these features include
• Code graphing capabilities to chart function relationships
• Flowcharting capabilities to chart function flow
• A strings window to display sequences of ASCII or Unicode characters contained in the binary file
• A large database of common data structure layouts and function prototypes
• A powerful plug-in architecture that allows extensions to IDA Pro’s capabilities to be easily incorporated
• A scripting engine for automating many analysis tasks
• Several integrated debuggers
Using IDA Pro An IDA Pro session begins when you select a binary file to analyze. Figure 3-1 shows the initial analysis window displayed by IDA Pro once a file has been opened. Note that IDA Pro has already recognized this particular file as a PE format executable for Microsoft Windows and has chosen x86 as the processor type. When a file is loaded into IDA Pro, a significant amount of initial analysis takes place. IDA Pro analyzes the instruction sequence, assigning location names to all program addresses referred to by jump or call instructions, and assigning data names to all program locations referred to in data references. If symbol table information is present in the binary, IDA Pro will utilize names derived from the symbol table rather than automatically generated names.
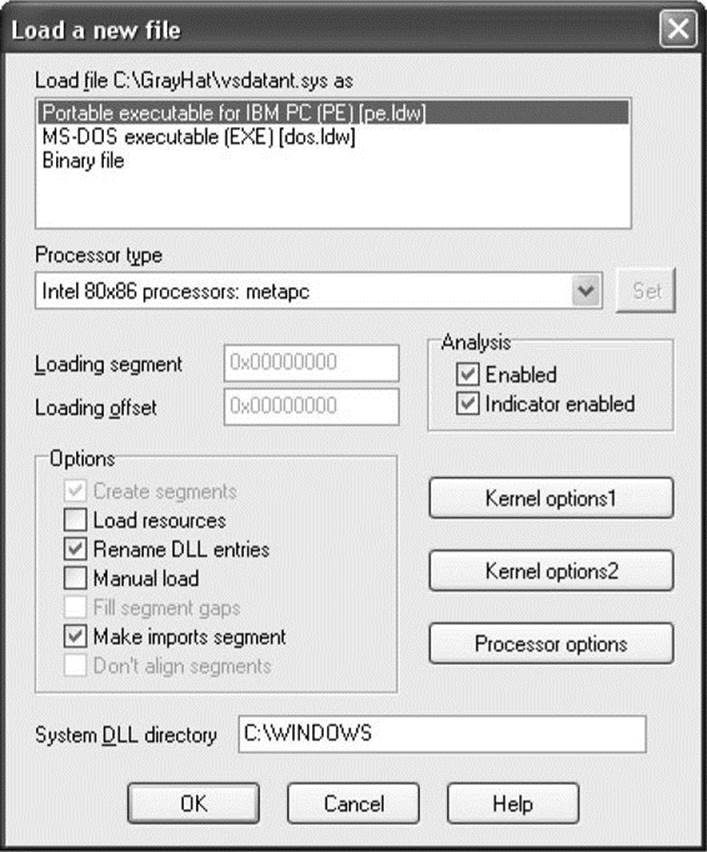
Figure 3-1 The IDA Pro file upload dialog
IDA Pro assigns global function names to all locations referenced by call instructions and attempts to locate the end of each function by searching for corresponding return instructions. A particularly impressive feature of IDA Pro is its ability to track program stack usage within each recognized function. In doing so, IDA Pro builds an accurate picture of the stack frame structure used by each function, including the precise layout of local variables and function parameters. This is particularly useful when you want to determine exactly how much data it will take to fill a stack allocated buffer and to overwrite a saved return address. While source code can tell you how much space a programmer requested for a local array, IDA Pro can show you exactly how that array gets allocated at runtime, including any compiler-inserted padding. Following initial analysis, IDA Pro positions the disassembly display at the program entry point, as shown in Figure 3-2. This is a typical function disassembly in IDA Pro. The stack frame of the function is displayed first and then the disassembly of the function itself is shown.
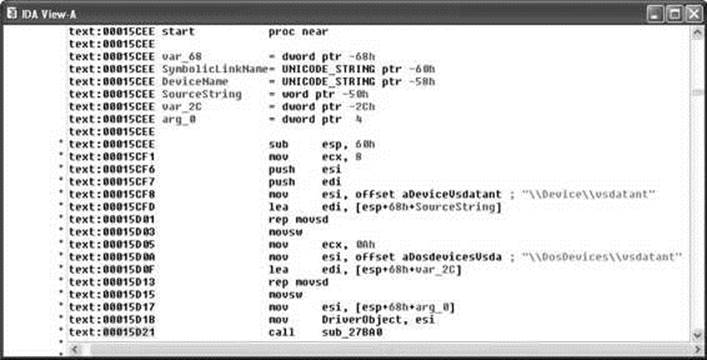
Figure 3-2 An IDA Pro disassembly listing
By convention, IDA Pro names local variables var_XXX, where XXX refers to the variable’s negative offset within the stack relative to the stack frame pointer. Function parameters are named arg_XXX, where XXX refers to the parameter’s positive offset within the stack relative to the saved function return address. Note in Figure 3-2 that some of the local variables are assigned more traditional names. IDA Pro has determined that these particular variables are used as parameters to known library functions and has assigned names to them based on names used in API (application programming interface) documentation for those functions’ prototypes. You can also see how IDA Pro can recognize references to string data and assign a variable name to the string while displaying its content as an inline comment. Figure 3-3 shows how IDA Pro replaces relatively meaningless call target addresses with much more meaningful library function names. Additionally, IDA Pro has inserted comments where it understands the data types expected for the various parameters to each function.
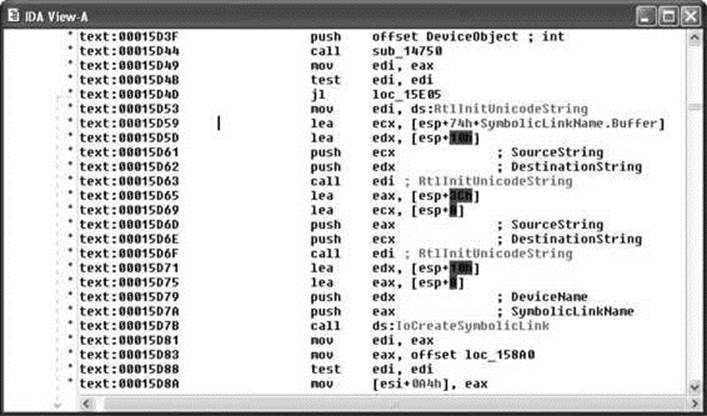
Figure 3-3 IDA Pro naming and commenting
Navigating an IDA Pro Disassembly Navigating your way around an IDA Pro disassembly is simple. When you hold the cursor over any address used as an operand, IDA Pro displays a tooltip window that shows the disassembly at the operand address. Double-clicking that same operand causes the disassembly window to jump to the associated address. IDA Pro maintains a history list to help you quickly back out to your original disassembly address. The ESC key acts like the Back button in a web browser.
Making Sense of a Disassembly As you work your way through a disassembly and determine what actions a function is carrying out or what purpose a variable serves, you can easily change the names IDA Pro has assigned to those functions or variables. To rename any variable, function, or location, simply click the name you want to change, and then use the Edit menu, or right-click for a context-sensitive menu to rename the item to something more meaningful. Virtually every action in IDA Pro has an associated hotkey combination, and it pays to familiarize yourself with the ones you use most frequently. The manner in which operands are displayed can also be changed via the Edit | Operand Type menu. Numeric operands can be displayed as hex, decimal, octal, binary, or character values. Contiguous blocks of data can be organized as arrays to provide more compact and readable displays (Edit | Array). This is particularly useful when organizing and analyzing stack frame layouts, as shown in Figure 3-4 and Figure 3-5. The stack frame for any function can be viewed in more detail by double-clicking any stack variable reference in the function’s disassembly.
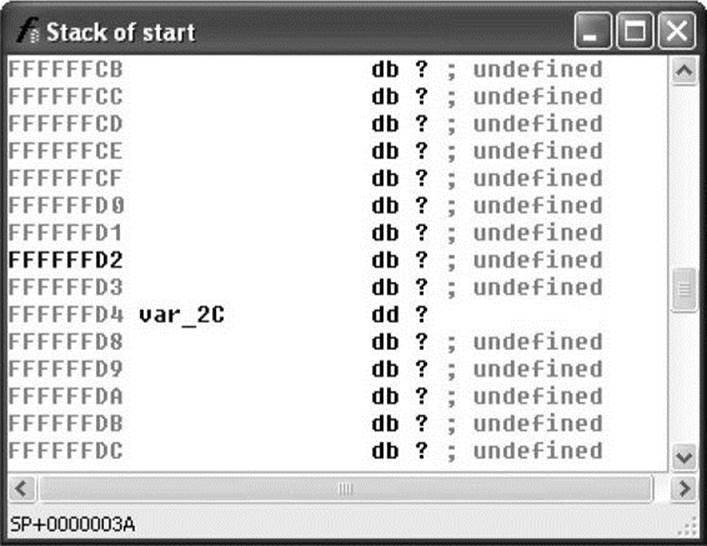
Figure 3-4 IDA Pro stack frame prior to type consolidation
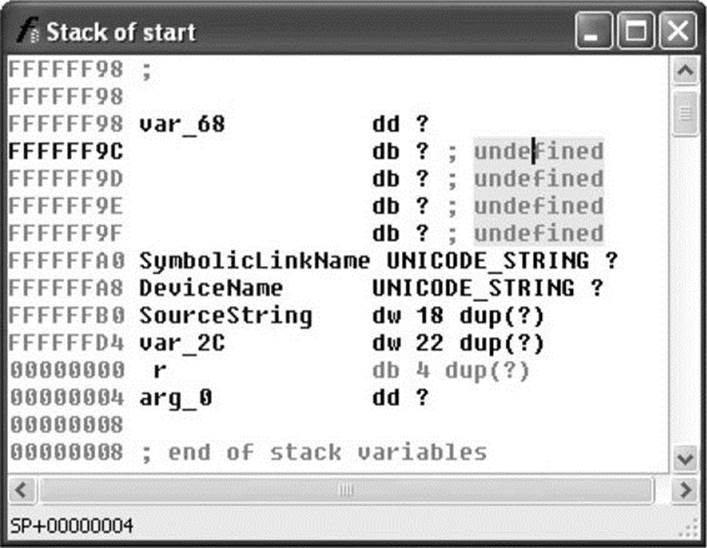
Figure 3-5 IDA Pro stack frame after type consolidation
Finally, another useful feature of IDA Pro is the ability to define structure templates and apply those templates to data in the disassembly. Structures are declared in the Structures subview (View | Open Subviews | Structures) and applied using the Edit | Struct Var menu option. Figure 3-6shows two structures and their associated data fields.
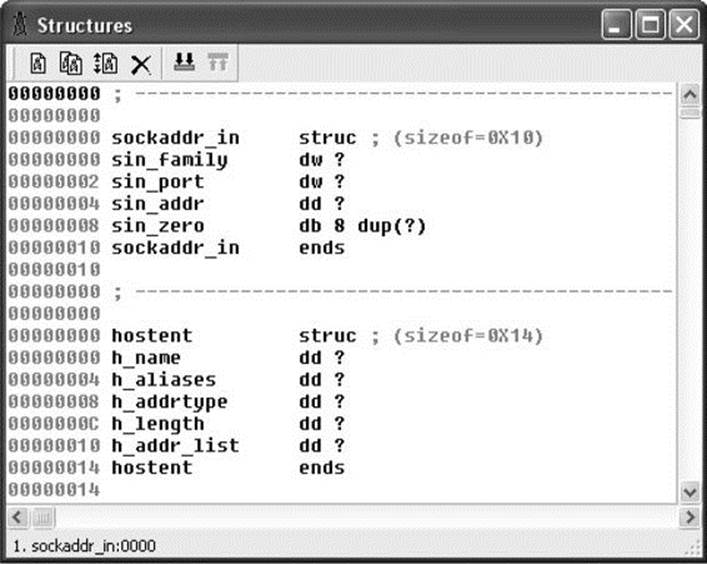
Figure 3-6 IDA Pro Structures definition window
Once a structure type has been applied to a block of data, disassembly references within the block can be displayed using structure offset names, rather than more cryptic numeric offsets. Figure 3-7 is a portion of a disassembly that makes use of IDA Pro’s structure declaration capability. The local variable sa has been declared as a sockaddr_in struct, and the local variable hostent represents a pointer to a hostent structure.
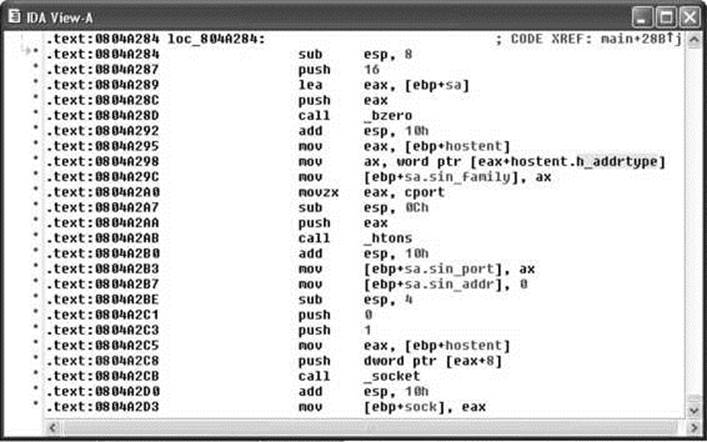
Figure 3-7 Applying IDA Pro structure templates
NOTE The sockaddr_in and hostent data structures are used frequently in C/C++ for network programming. A sockaddr_in describes an Internet address, including host IP and port information. A hostent data structure is used to return the results of a DNS lookup to a C/C++ program.
Disassemblies are made more readable when structure names are used rather than register plus offset syntax. For comparison, the operand at location 0804A2C8 has been left unaltered, whereas the same operand reference at location 0804A298 has been converted to the structure offset style and is clearly more readable as a field within a hostent struct.
Vulnerability Discovery with IDA Pro The process of manually searching for vulnerabilities using IDA Pro is similar in many respects to searching for vulnerabilities in source code. A good start is to locate the places in which the program accepts user-provided input and then attempt to understand how that input is used. It is helpful if IDA Pro has been able to identify calls to standard library functions. Because you are reading through an assembly language listing, your analysis will likely take far longer than a corresponding read through source code. Use references for this activity, including appropriate assembly language reference manuals and a good guide to the APIs for all recognized library calls. You must understand the effect of each assembly language instruction, as well as the requirements and results for calls to library functions. An understanding of basic assembly language code sequences as generated by common compilers is also essential. At a minimum, you should understand the following:
• Function prologue code The first few statements of most functions used to set up the function’s stack frame and allocate any local variables.
• Function epilogue code The last few statements of most functions used to clear the function’s local variables from the stack and restore the caller’s stack frame.
• Function calling conventions Dictate the manner in which parameters are passed to functions and how those parameters are cleaned from the stack once the function has completed.
• Assembly language looping and branching primitives The instructions used to transfer control to various locations within a function, often according to the outcome of a conditional test.
• High-level data structures Laid out in memory; various assembly language addressing modes are used to access this data.
Finishing Up with find.c Let’s use IDA Pro to take a look at the sprintf() call that was flagged by all of the auditing tools used in this chapter. IDA Pro’s disassembly listing leading up to the potentially vulnerable call at location 08049A8A is shown in Figure 3-8. In the example, variable names have been assigned for clarity. We have this luxury because we have seen the source code. If we had never seen the source code, we would be dealing with more generic names assigned during IDA Pro’s initial analysis.
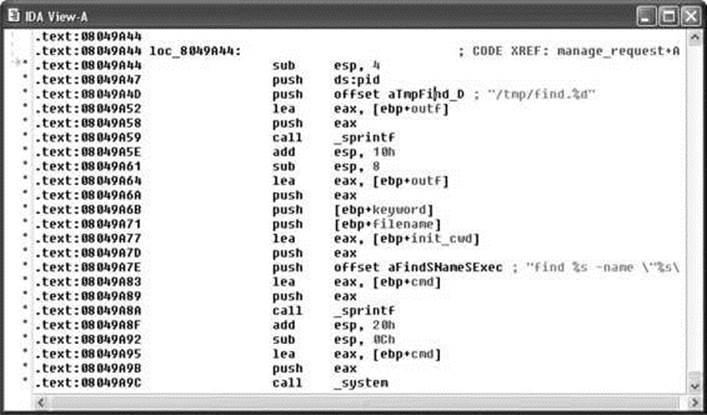
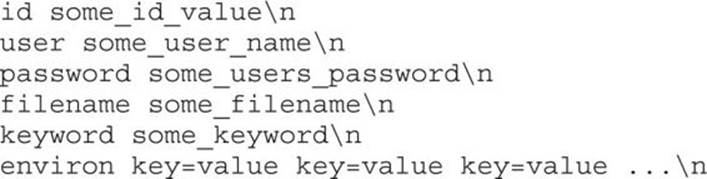
Figure 3-8 A potentially vulnerable call to sprintf()
It is perhaps stating the obvious at this point, but important nonetheless, to note that we are looking at compiled C code. One reason we know this, aside from having peeked at some of the source code already, is that the program is linked against the C standard library. An understanding of the C calling conventions helps us track down the parameters that are being passed to sprintf() here. First, the prototype for sprintf() looks like this:
int sprintf(char *str, const char *format, ...);
The sprintf() function generates an output string based on a supplied format string and optional data values to be embedded in the output string according to field specifications within the format string. The destination character array is specified by the first parameter, str. The format string is specified in the second parameter, format, and any required data values are specified as needed following the format string. The security problem with sprintf() is that it doesn’t perform length checking on the output string to determine whether it will fit into the destination character array. Since we have compiled C, we expect parameter passing to take place using the C calling conventions, which specify that parameters to a function call are pushed onto the stack in right-to-left order.
This means that the first parameter to sprintf(), str, is pushed onto the stack last. To track down the parameters supplied to this sprintf() call, we need to work backward from the call itself. Each push statement we encounter is placing an additional parameter onto the stack. We can observe six push statements following the previous call to sprintf() at location 08049A59. The values associated with each push (in reverse order) are
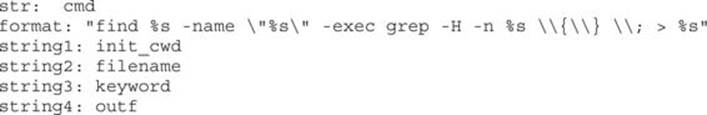
Strings 1 through 4 represent the four string parameters expected by the format string. The lea (Load Effective Address) instructions at locations 08049A64, 08049A77, and 08049A83 in Figure 3-8 compute the address of the variables outf, init_cwd, and cmd, respectively. This lets us know that these three variables are character arrays, while the fact that filename and keyword are used directly lets us know that they are character pointers. To exploit this function call, we need to know if this sprintf() call can be made to generate a string not only larger than the size of thecmd array, but also large enough to reach the saved return address on the stack. Double-clicking any of the variables just named will bring up the stack frame window for the manage_request() function (which contains this particular sprintf() call) centered on the variable that was clicked. The stack frame is displayed in Figure 20-9 with appropriate names applied and array aggregation already complete.
Figure 3-9 indicates that the cmd buffer is 512 bytes long and that the 1032-byte init_cwd buffer lies between cmd and the saved return address at offset 00000004. Simple math tells us that we need sprintf() to write 1552 bytes (512 for cmd, 1032 bytes for init_cwd, 4 bytes for the saved frame pointer, and 4 bytes for the saved return address) of data into cmd to overwrite the return address completely. The sprintf() call we are looking at decompiles into the following C statement:
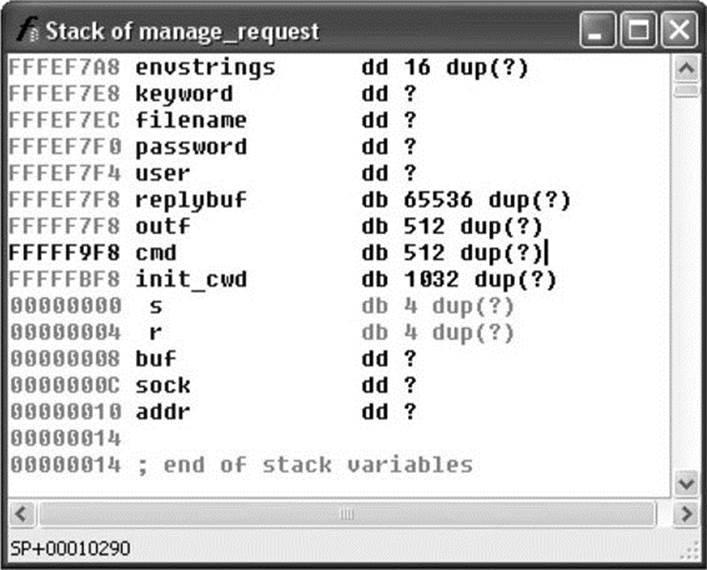
Figure 3-9 The relevant stack arguments for sprintf()

We will cheat a bit here and rely on our earlier analysis of the find.c source code to remember that the filename and keyword parameters are pointers to user-supplied strings from an incoming UDP packet. Long strings supplied to either filename or keyword should get us a buffer overflow. Without access to the source code, we need to determine where each of the four string parameters obtains its value. This is simply a matter of doing a little additional tracing through the manage_request() function. Exactly how long does a filename need to be to overwrite the saved return address? The answer is somewhat less than the 1552 bytes mentioned earlier, because output characters are sent to the cmd buffer prior to the filename parameter. The format string itself contributes 13 characters prior to writing the filename into the output buffer, and theinit_cwd string also precedes the filename. The following code from elsewhere in manage_request() shows how init_cwd gets populated:
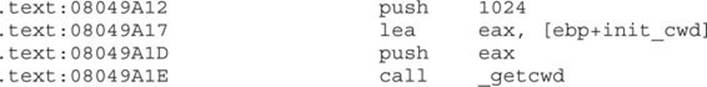
We see that the absolute path of the current working directory is copied into init_cwd, and we receive a hint that the declared length of init_cwd is actually 1024 bytes, rather than 1032 bytes as Figure 3-9 seems to indicate. The reason for the difference is that IDA Pro displays the actual stack layout as generated by the compiler, which occasionally includes padding for various buffers. Using IDA Pro allows you to see the exact layout of the stack frame, while viewing the source code only shows you the suggested layout. How does the value of init_cwd affect our attempt at overwriting the saved return address? We may not always know what directory the find application has been started from, so we can’t always predict how long the init_cwd string will be. We need to overwrite the saved return address with the address of our shellcode, so our shellcode offset needs to be included in the long filename argument we will use to cause the buffer overflow. We need to know the length of init_cwd in order to align our offset properly within the filename. Since we don’t know it, can the vulnerability be reliably exploited? The answer is to first include many copies of our offset to account for the unknown length of init_cwd and second, to conduct the attack in four separate UDP packets in which the byte alignment of the filename is shifted by one byte in each successive packet. One of the four packets is guaranteed to be aligned to overwrite the saved return address properly.
Decompilation with Hex-Rays Decompiler A recent development in the decompilation field is Ilfak Guilfanov’s Hex-Rays Decompiler plug-in for IDA Pro. Hex-Rays Decompiler integrates with IDA Pro to form a very powerful disassembly/decompilation duo. The goal of Hex-Rays Decompiler is not to generate source code that is ready to compile. Rather, the goal is to produce source code that is sufficiently readable that analysis becomes significantly easier than disassembly analysis. Sample Hex-Rays Decompiler output is shown in the following listing, which contains the previously discussed portions of the manage_request() function from the find binary:

Although the variable names may not make things obvious, we can see that variable v59 is the destination array for the sprintf() function. Furthermore, by observing the declaration of v59, we can see the array sits 608h (1544) bytes above the saved frame pointer, which agrees precisely with the analysis presented earlier. We know the stack frame layout based on the Hex-Rays Decompiler–generated comment that indicates that v59 resides at memory location [bp-608h]. Hex-Rays Decompiler integrates seamlessly with IDA Pro and offers interactive manipulation of the generated source code in much the same way that the IDA Pro–generated disassembly can be manipulated.
BinNavi
Disassembly listings for complex programs can become difficult to follow because program listings are inherently linear, whereas programs are very nonlinear as a result of all the branching operations that they perform. BinNavi from Zynamics is a tool that provides for graph-based analysis and debugging of binaries. BinNavi operates on IDA Pro–generated databases by importing them into a SQL database (MySQL is currently supported), and then offering sophisticated graph-based views of the binary. BinNavi utilizes the concept of proximity browsing to prevent the display from becoming too cluttered. BinNavi graphs rely heavily on the concept of the basic block. A basic block is a sequence of instructions that, once entered, is guaranteed to execute in its entirety. The first instruction in any basic block is generally the target of a jump or call instruction, whereas the last instruction in a basic block is typically either a jump or return. Basic blocks provide a convenient means for grouping instructions together in graph-based viewers, as each block can be represented by a single node within a function’s flow-graph. Figure 3-10 shows a selected basic block and its immediate neighbors.
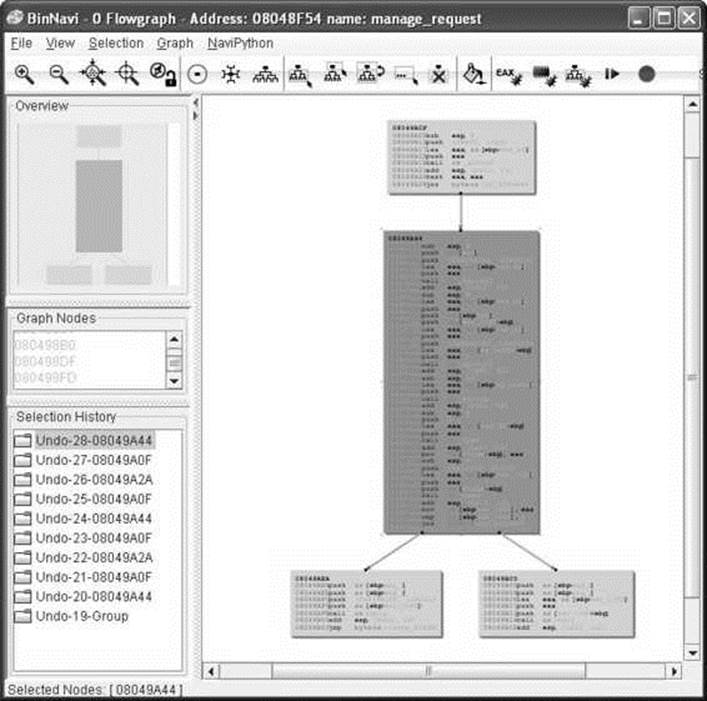
Figure 3-10 Example BinNavi display
The selected node has a single parent and two children. The proximity settings for this view are one node up and one node down. The proximity distance is configurable within BinNavi, allowing users to see more or less of a binary at any given time. Each time a new node is selected, the BinNavi display is updated to show only the neighbors that meet the proximity criteria. The goal of the BinNavi display is to decompose complex functions sufficiently to allow analysts to comprehend the flow of those functions quickly.
Automated Binary Analysis Tools
To automatically audit a binary for potential vulnerabilities, any tool must first understand the executable file format used by the binary, be able to parse the machine language instructions contained within the binary, and finally determine whether the binary performs any actions that might be exploitable. Such tools are far more specialized than source code auditing tools. For example, C source code can be automatically scanned no matter what target architecture the code is ultimately compiled for, whereas binary auditing tools need a separate module for each executable file format they are capable of interpreting, as well as a separate module for each machine language they can recognize. Additionally, the high-level language used to write the application and the compiler used to compile it can each influence what the compiled code looks like. Compiled C/C++ source code looks very different from compiled Delphi or Java code. The same source code compiled with two different compilers may possess many similarities but will also possess many differences.
The major challenge for such products centers on the ability to characterize behavior accurately that leads to an exploitable condition. Examples of such behaviors include access outside of allocated memory (whether in the stack or the heap), use of uninitialized variables, or passing user input directly to dangerous functions. To accomplish any of these tasks, an automated tool must be able to compute accurately ranges of values taken on by index variables and pointers, follow the flow of user-input values as they are used within the program, and track the initialization of all variables referenced by the program. Finally, to be truly effective, automated vulnerability discovery tools must be able to perform each of these tasks reliably while dealing with the many different algorithmic implementations used by both programmers and their compilers. Suffice it to say there have not been many entries into this holy grail of markets, and of those, most have been priced out of the average user’s hands.
We will briefly discuss two different tools that perform some form of automated binary analysis. Each of these tools takes a radically different approach to its analysis, which serves to illustrate the difficulty with automated analysis in general. The two tools are BugScam, from Thomas Dullien (aka Halvar Flake), and BinDiff, from Zynamics.
BugScam
An early entry in this space, BugScam is a collection of scripts by Halvar Flake for use with IDA Pro. Two of the powerful features of IDA Pro are its scripting capabilities and its plug-in architecture. Both of these features allow users to extend the capabilities of IDA Pro and take advantage of the extensive analysis that IDA Pro performs on target binaries. Similar to the source code tools discussed earlier, BugScam scans for potentially insecure uses of functions that often lead to exploitable conditions. Unlike most of the source code scanners, BugScam attempts to perform some rudimentary data flow analysis to determine whether the function calls it identifies are actually exploitable. BugScam generates an HTML report containing the virtual addresses at which potential problems exist. Because the scripts are run from within IDA Pro, navigating to each trouble spot for further analysis of whether the indicated function calls are actually exploitable is a relatively easy task. The BugScam scripts leverage the powerful analysis capabilities of IDA Pro, which is capable of recognizing a large number of executable file formats as well as many machine languages.
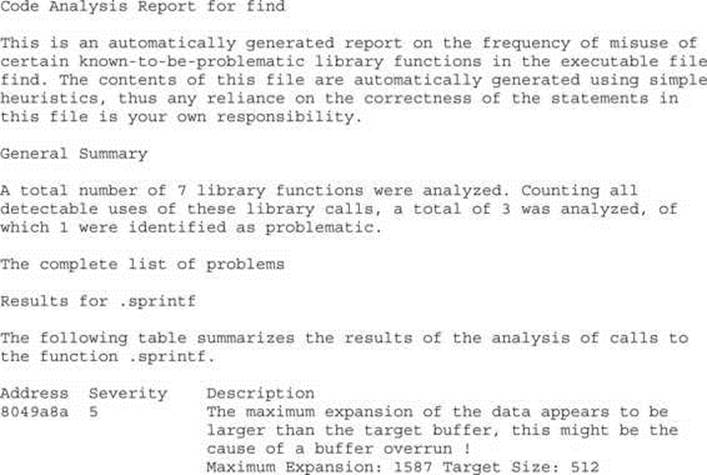
Sample BugScam output for the compiled find.c binary appears next:
BinDiff
An alternative approach to locating vulnerabilities is to allow vendors to locate and fix the vulnerabilities themselves, and then, in the wake of a patch, to study exactly what has changed in the patched program. Under the assumption that patches either add completely new functionality or fix broken functionality, it can be useful to analyze each change to determine if the modification addresses a vulnerable condition. By studying any safety checks implemented in the patch, it is possible to understand what types of malformed input might lead to exploits in the unpatched program. This can lead to the rapid development of exploits against unpatched systems. It is not uncommon to see exploits developed within 24 hours of the release of a vendor patch. Searching for vulnerabilities that have already been patched may not seem like the optimal way to spend your valuable research time, so why bother with difference analysis? The first reason is simply to be able to develop proof-of-concept exploits for use in pen-testing against unpatched clients. The second reason is to discover use patterns in vulnerable software to locate identical patterns that a vendor may have forgotten to patch. In this second case, you are leveraging the fact that the vendor has pointed out what they were doing wrong, and all that is left is for you to determine whether they have found and fixed all instances of their wrongful behavior.
BinDiff from Zynamics is a tool that aims to speed up the process of locating and understanding changes introduced in patched binary files. Rather than scanning individual binaries for potential vulnerabilities, BinDiff, as its name implies, displays the differences between two versions of the same binary. You may think to yourself, “So what? Simple tools such as diff or cmp can display the differences between two files as well.” What makes those tools less than useful for comparing two compiled binaries is that diff is primarily useful for comparing text files, and cmp can provide no contextual information surrounding any differences. BinDiff, on the other hand, focuses less on individual byte changes and more on structural or behavioral changes between successive versions of the same program. BinDiff combines disassembly with graph comparison algorithms to compare the control flow graphs of successive versions of functions and highlights the newly introduced code in a display format similar to that of BinNavi. Chapter 19 includes an in-depth analysis on this topic.
Summary
This chapter introduced the most common techniques for analyzing source code, using open source code tools for C code, decompilers for Java or x86 binaries via the IDA Pro Hex-Rays Decompiler, and the excellent plug-in BugScam for IDA Pro. The discussion of IDA Pro will prepare you for Chapter 4, and the discussion of BinDiff will help if you want to find 1-day vulnerabilities, covered in Chapter 19.
For Further Reading
“Automated Vulnerability Auditing in Machine Code (Tyler Durden) www.phrack.org/issues.html?issue=64&id=8.
BinDiff www.zynamics.com.
BinNavi www.zynamics.com/binnavi.html.
BugScam sourceforge.net/projects/bugscam.
Decompyle www.openhub.net/p/decompyle.
Digital Millennium Copyright Act (DMCA) en.wikipedia.org/wiki/Digital_Millennium_Copyright_Act.
DMCA-related legal cases and resources (Electronic Frontier Foundation) w2.eff.org/IP/DMCA/.
ERESI Reverse Engineering Software Interface www.eresi-project.org.
Flawfinder www.dwheeler.com/flawfinder/.
Hex-Rays Decompiler www.hex-rays.com/decompiler.shtml.
IDA Pro www.hex-rays.com/idapro/.
ITS4 www.cigital.com/its4/.
Jad (JAva Decompiler) en.wikipedia.org/wiki/JAD_(JAva_Decompiler).
JReversePro sourceforge.net/projects/jrevpro/.
Pentium x86 references en.wikipedia.org/wiki/Pentium_Dual-Core.
PREfast research.microsoft.com/en-us/news/features/prefast.aspx.
RATS www.fortify.com/ssa-elements/threat-intelligence/rats.html.
Splint www.splint.org.
Uncompyle2 github.com/wibiti/uncompyle2.
Yasca www.yasca.org.