QuickBooks 2017 All-In-One For Dummies (2016)
Book 4
Accounting Chores
Chapter 2
Preparing Financial Statements and Reports
IN THIS CHAPTER
![]() Working with good information
Working with good information
![]() Creating a report
Creating a report
![]() Navigating the Report window
Navigating the Report window
![]() Changing a report
Changing a report
![]() Processing multiple reports
Processing multiple reports
![]() Retaining documents
Retaining documents
QuickBooks produces — oh, I don’t know — about 100 different financial statements and reports. I tried to count them for purposes of writing this chapter but lost track after I’d counted 90-some reports. I figured that was close enough for my purposes here.
Because QuickBooks contains so many reports, I don’t provide individualized descriptions of each report in this chapter. Rather, I talk about some of the stuff that you need to do before you prepare financial statements. After covering those basics, I talk about how you produce and modify reports, and about some of the useful tools that QuickBooks supplies for working with reports.
Some Wise Words Up Front
This point is an obvious one, but you should note that the reports you produce in QuickBooks are only as good as the data file. If you have good rich information in your QuickBooks data file, if the file doesn’t contain too many mistakes, and if all the transactions are entered, your reports should be pretty darn good.
This simple observation has one important ramification: Often, the first step in preparing good financial statements and useful reports is collecting all the data. In other words, you want to make sure that you’ve entered all the invoices, purchase orders, checks, and so forth. You also want to make sure that any special accounting transactions, such as for depreciation or asset sales or accruals, have been entered. (Perhaps you need your accountant’s help for this.)
The other chapters of this book talk about how to collect and record all sorts of information, so there’s no need to talk more about that here. But just to beat this thing to death, the first step in producing a good financial statement or a good report is collecting the right information.
Producing a Report
As I mention at the beginning of this chapter, QuickBooks provides more than 100 financial statements and accounting reports. You get to these reports by opening the Reports menu. The Reports menu arranges reports in roughly a dozen categories, including Company & Financial, Customers & Receivables, Sales, Jobs, and Time & Mileage.
To produce just about any of the reports available through the Reports menu, you first select the Report category. If you want to produce a standard financial statement, such as a profit and loss statement, you choose the Reports ⇒ Company & Financial command. QuickBooks displays the Company & Financial submenu, which lists the various types of financial statements available.
You pick the submenu command that describes the financial statement that you want. If you want a standard profit and loss financial statement, you choose the Reports ⇒ Company & Financial ⇒ Profit & Loss Standard command. After you choose the command, QuickBooks displays the Report window for the report that you selected, as shown in Figure 2-1 .
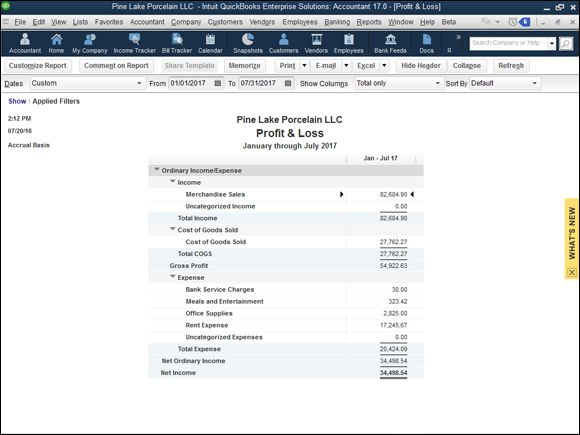
FIGURE 2-1: The Report window, showing a profit and loss statement.
Working with the Report Window
If you’re comfortable working with Microsoft Windows, working with the QuickBooks Report window should be a snap. Typically, a report won’t fit within a window because it contains too much data. In this case, however, QuickBooks adds scroll bars, both vertical and horizontal, that you can use to scroll the window around. Pretty straightforward, right?
Along the top edge of the window, QuickBooks displays both buttons and boxes. You use these buttons and boxes to change the display of the Report window and to control the information shown in the Report window. In the next section, I describe each of these buttons and boxes.
Working with Report window buttons
The Report window typically provides ten buttons: Customize Report, Comment on Report, Share Template, Memorize, Print, E-mail, Excel, Hide Header, Collapse, and Refresh. You can find out what these command buttons do by experimentation. If you don’t have time for that, read the following sections.
Customize Report
The Customize Report button displays the Modify Report dialog box. I won’t go into any detail about this command button here because a later section of this chapter, “Modifying a Report ,” talks in gritty detail about how you use this command button to customize a report.
Comment on Report
Clicking the Comment on Report button displays the Comment on Report window (see Figure 2-2 ). To use the Comment on Report dialog box, you click a report value you want to annotate with a comment. QuickBooks then opens a comment box at the bottom of the window, you type your comment, and then you click the Save button.
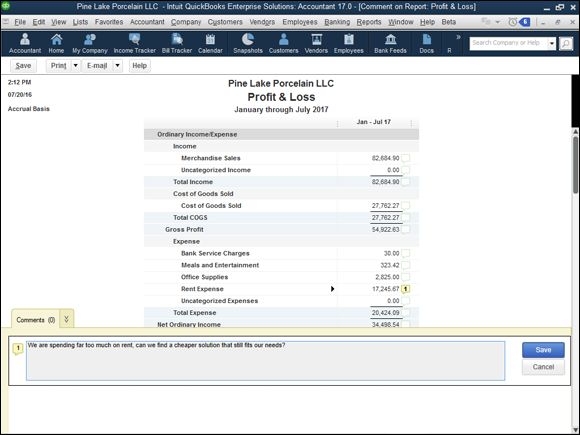
FIGURE 2-2: The Comment on Report window.
When you’re done commenting on the report, you need to save the annotated report. Do so by clicking an OK button when QuickBooks asks whether you want to save the commented report. Later on, when you print the report, you can include your comments. (This is a great tool for accountants and bookkeepers who want to explain what numbers mean to other readers of the financial statements.) You print a saved commented report by choosing the report from the Reports ⇒ Commented Reports menu.
Share Template
The Share Template button, which QuickBooks enables after you’ve customized a report in some way, lets you share your customized report settings (not the data) with other QuickBooks users. When you click this button, QuickBooks displays the Share Template dialog box (not shown). Use the dialog box to give your report template a name (ideally a clever name, please), describe your customized report with a few choice words, provide your name and email address, and use the option buttons provided to indicate whether you want to remain anonymous. When you click Share, QuickBooks uploads your report template to an Intuit website where other people can grab the template and use it.
Memorize
The Memorize button displays the Memorize Report dialog box, shown in Figure 2-3 . The Memorize Report dialog box lets you memorize, or permanently save, a particular set of report creation settings. After you memorize these settings, you can produce the exact same report by choosing the memorized report from the Reports ⇒ Memorized Reports submenu.
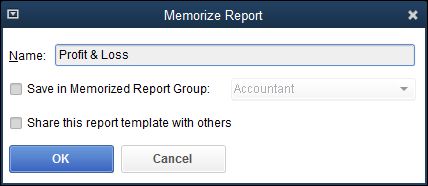
FIGURE 2-3: The Memorize Report dialog box.
 You can save a memorized report in the Memorized Report Group. To do this, select the Save in Memorized Report Group check box. Then use the Save in Memorized Report Group drop-down list to select the report group in which the memorized report should be saved.
The Print command button in the top menu bar displays a drop-down list with two options: Report and Save As PDF. If you click Report, QuickBooks (sometimes after a bit of annoyance) displays the Print Reports dialog box, shown in Figure 2-4 , which lets you choose how the report should print and where it should print. The Settings tab, for example, lets you choose the printer, select a page orientation (either portrait or landscape), specify whether you want to print only a range of the report’s pages, control page breaking, and adjust the dimensions (width and height) of the report. If you click Save As PDF, QuickBooks displays the Save Document As PDF dialog box, which lets you create a PDF of report document.
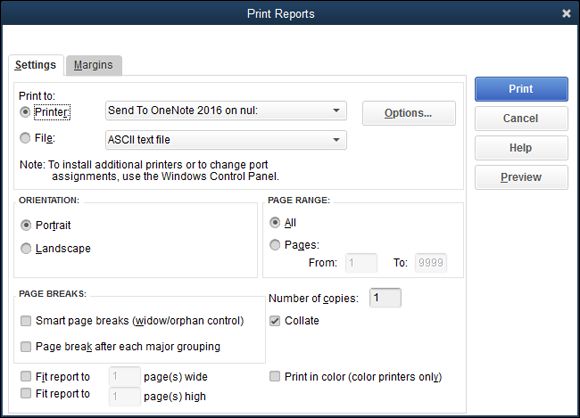
FIGURE 2-4: The Settings tab of the Print Reports dialog box.
The Margins tab of the Print Reports dialog box, shown in Figure 2-5 , lets you specify the margins that QuickBooks should use on the printed report pages. You specify the top, right, bottom, and left margins in inches.
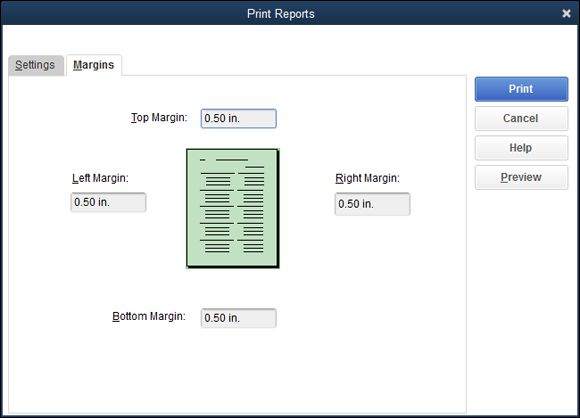
FIGURE 2-5: The Margins tab of the Print Reports dialog box.
Click the Preview button, provided on the Print Reports dialog box, to display the Preview window. The Preview window shows what your printed report pages look like. The window also includes buttons that let you page to the previous and next pages of the report, zoom in and out on the report, and print the report.
After you’ve used the Settings tab and the Margins tab to specify how QuickBooks should print a report, click Print. QuickBooks sends the report to your printer.
The E-mail command button lets you email either an Excel workbook version of a report or a PDF version of a report to someone else as an email attachment.
Excel
If you click the Excel button, QuickBooks displays a submenu from which you can choose Create New Worksheet or Update Existing Worksheet. Choose Create New Worksheet to display the Send Report to Excel dialog box, shown in Figure 2-6 . The Send Report to Excel dialog box lets you take the information in a report and copy it to a file that a spreadsheet program, such as Microsoft Excel, can easily open. You can send the copy to a new Excel spreadsheet, to an existing Excel spreadsheet, or to a .csv (comma-separated values) file, which can be opened by just about any spreadsheet or database program.
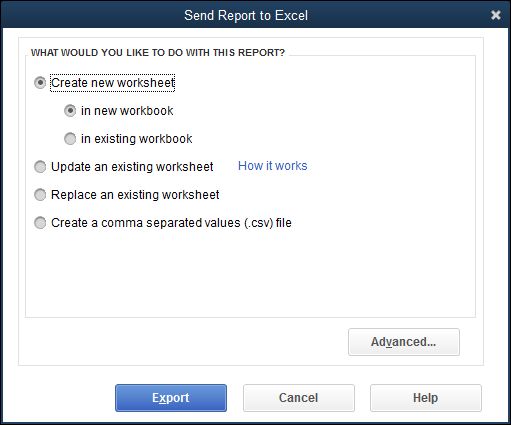
FIGURE 2-6: The Send Report to Excel dialog box.
To copy the report to a new workbook, select the Create New Worksheet radio button. From there, you have the option to create a whole new Excel spreadsheet (click the In New Workbook option) or create a new sheet in an existing file by using the In Existing Workbook radio button; then enter the path and name of the workbook in the text box that QuickBooks opens after you select the radio button. (If you don’t know the path and name of the workbook, click the Browse button and then use the dialog box that QuickBooks displays to locate the workbook file.)
If you want to copy the report to an existing Excel spreadsheet, select the Update an Existing Worksheet radio button. QuickBooks causes Excel to refresh the previously exported workbook.
If you want to replace an existing Excel spreadsheet with the new report you’re sending to Excel, select the Replace an Existing Worksheet radio button. Then, when QuickBooks opens a text box and adds the Browse button, either enter the path and name of the workbook in the text box or click the Browse button, navigate to the workbook, and select it.
Finally, if you want to copy the report information to a .csv file (a file format that can be opened by any spreadsheet or database program), select the Create a Comma Separated Values (.csv) File radio button.
If you click the Advanced command button on the Send Report to Excel dialog box, QuickBooks displays the Advanced Excel Options dialog box, shown in Figure 2-7 . This dialog box allows you to control what formatting QuickBooks copies to Excel (do this with the QuickBooks Options check boxes), turn certain Excel formatting features on or off (do this with the Excel Options check boxes), and set up some preliminary workbook printing information in Excel (do this with the Printing Options radio buttons). All this stuff relates to how Excel works. If you’re comfortable working with Excel, go ahead and make the changes that you want. If you aren’t comfortable working with Excel, go ahead and accept QuickBooks’s default suggestions. You can change all this stuff later, and rather easily, in Excel.
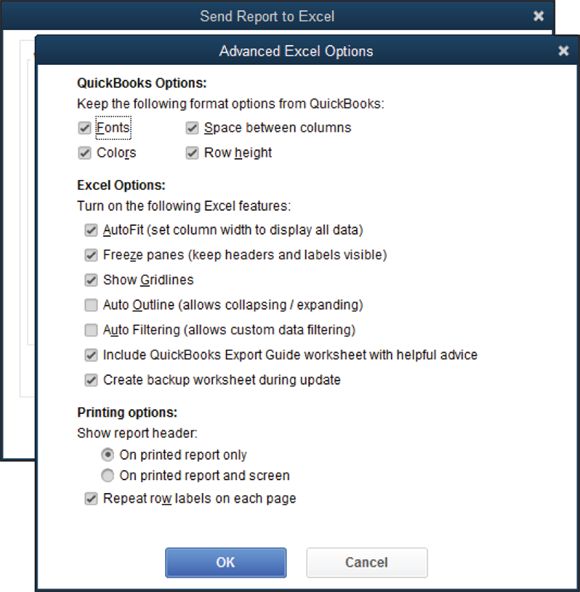
FIGURE 2-7: The Advanced Excel Options dialog box.
If you’re working with QuickBooks, know that Excel is a wonderful tool for digging deeper into your data. In fact, in several chapters of this book, I assume that you’re going to exchange information between Excel and QuickBooks. If you’ve never done this, or if you haven’t read those chapters yet, consider acquiring Excel and then taking the time to learn that powerful spreadsheet product. Also note that next time you buy a PC, you may have the option of getting Microsoft Office as part of the purchase price. Microsoft Excel comes with Microsoft Office.
Hide Header
The Hide Header button and the Collapse button change the way that the report appears in the Report window and, if printed, on the page.
You click the Hide Header button to remove the header information, such as the company name. If you hide the header, you can click the Hide Header button again to replace the header.
Collapse
The Collapse button collapses detail in a report. QuickBooks doesn’t show subaccounts in a collapsed report — only accounts.
To uncollapse a report that you previously collapsed, click the Expand button. QuickBooks replaces the Collapse button with the Expand button when the Report window shows a collapsed report.
Don’t spend any time trying to figure out what the Hide Header and Collapse/Expand buttons do. If you have a question, simply display a report in the Report window and click the command button about which you have a question. The changes in the Report window show you what the command button does.
Refresh
The Refresh button tells QuickBooks to update a report’s information for changes in the QuickBooks data file. This sounds crazy at first, but you can actually leave report windows open. This means that a report window may show a profit and loss statement from a week ago, for example. If you’ve entered several transactions in the past week, the report data may no longer be correct. When you click the Refresh button, QuickBooks knows that it should update the report with the most recent changes.
QuickBooks typically prompts you to update a report for changes to the QuickBooks data file. If you don’t follow QuickBooks’s suggestion to update, however, you can later click Refresh to update.
Using the Report window boxes
The Report window provides five boxes: Dates, From, To, Columns, and Sort By. These boxes also enable you to control the information shown in the Report window and the appearance of the information.
Dates, From, and To
The Dates, From, and To boxes, for example, let you tell QuickBooks what reporting interval you want to show in the report. In other words, you use these boxes to tell QuickBooks the month, quarter, year, or whatever period for which you want to prepare a report.
Columns
The Columns drop-down list displays a set of column choices. By default, QuickBooks displays a single total column for a report based on the time period you select. If you produce a report that summarizes annual income and expense data, for example, you can use the Columns drop-down list to tell QuickBooks that you want to see monthly columns. In this situation, QuickBooks shows an annual income statement, but it also shows columns for January, February, March, and so forth, providing some more detail on a certain time period, customer, or vendor. To see how this works, take a look at Figure 2-8 . The profit and loss statement in the window is composed of only a Total column.
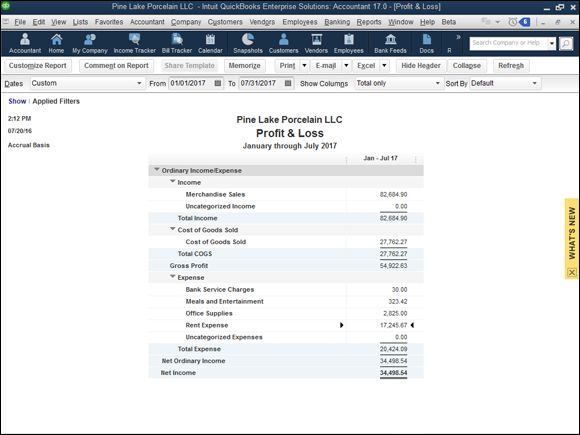
FIGURE 2-8: A simple profit and loss statement with a single Total column.
Now take a look at Figure 2-9 ; it shows the same profit and loss statement, except this time, the Columns drop-down list shows Customer:Job. In this case, QuickBooks shows you a breakdown of your income and expenses by Customer and Job, as well as the total. The Columns drop-down list gives you a bunch of column options. Typically, some options make sense for the report that you’re working on; others won’t. Nevertheless, you should occasionally experiment with this tool. The Columns drop-down list often gives you a neat way to further segregate and refine your data.
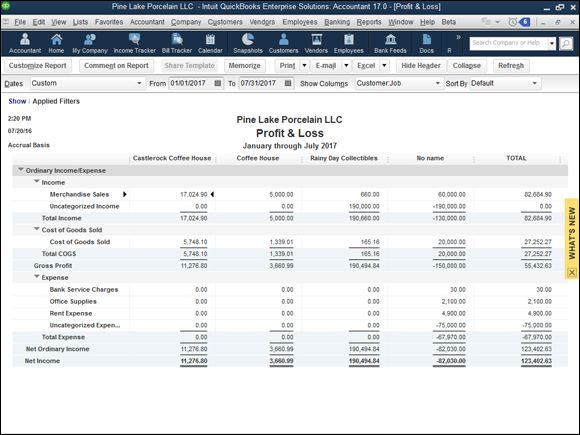
FIGURE 2-9: A profit and loss statement with Customer:Job columns.
Sort By
The Sort By drop-down list enables you to choose how information should be ordered in a report. For many types of reports, the Sort By drop-down list doesn’t provide any meaningful options. For other types of reports, however, the Sort By drop-down list provides handy ways to organize report information.
Modifying a Report
If you click the Customize Report button, QuickBooks displays the Modify Report dialog box, which you can use to customize a report. When you customize a report, you change the report’s appearance, its layout, and the information that it summarizes.
The Modify Report dialog box looks different for different report types. Nevertheless, if you look past the cosmetic differences, all the dialog boxes look and work pretty much the same way.
Using the Display tab
The Display tab of the Modify Report dialog box lets you control the report interval date, the report basis, the columns, and some other formatting.
The Report Date Range boxes — Dates, From, and To — do the same thing as the Dates, From, and To boxes in the Report window. These boxes let you control the reporting interval or accounting period. You can choose one of the date descriptions from the Dates drop-down list, or you can use the From and To boxes to specify a particular range of dates. The From and To boxes, shown in Figure 2-10 , accept dates in mm/dd/yyyy format.
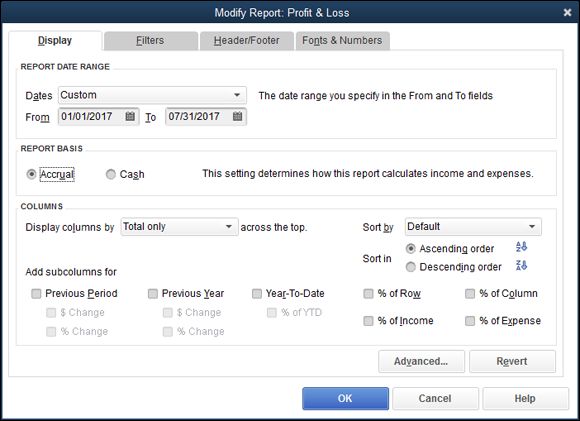
FIGURE 2-10: The Display tab of the Modify Report dialog box for a profit and loss statement.
The Report Basis option buttons — Accrual and Cash — let you specify whether you want QuickBooks to prepare a report on a cash basis or on an accrual basis. Now, quite honestly, you can’t simply convert between cash-basis accounting and accrual-basis accounting by clicking these buttons. Cash-basis accounting and accrual-basis accounting are too complicated for QuickBooks to figure out on its own. If you use accrual-basis accounting, for example, you must use the QuickBooks Accounts Payable feature, and you must record revenue and expense transactions when you earn revenue and incur expenses. Nevertheless, these Report Basis buttons enable you to quickly flip between cash-centric profit statements and accrual-like financial statements. And that’s pretty handy.
In a nutshell, cash-basis accounting counts income and expense when cash moves into and out of a business. Accrual-basis accounting counts income when it’s earned and counts expense when it’s incurred. Book 1, Chapter 1 talks in more detail about the differences between cash-basis accounting and accrual-basis accounting.
The Columns area enables you to control or specify how many columns a report should display. The Display Columns By drop-down list is analogous to the Columns drop-down list in the Report window. The Columns area also lets you choose a Sort By option. Again, this is analogous to the Sort By drop-down list in the Report window.
In addition, the Columns area allows you to add subcolumns (you do this with the Previous Period, Previous Year, and Year-to-Date check boxes) and add percentages. The neat thing about these percentages is that you’re actually adding financial ratios to your financial statement when you do this. I don’t talk about financial ratios in this chapter, but I do go into great detail in Book 5, Chapter 1 about what financial ratios are, and about how they can be powerful tools for assessing and monitoring your financial condition and your financial performance.
To show each line item of an income statement as a percentage of total income, select the % of Income check box.
For more report formatting options, click the Advanced button. QuickBooks displays the Advanced Options dialog box, as shown in Figure 2-11 . Use the Display Rows radio buttons to tell QuickBooks when it should or shouldn’t display rows of information in a report. Similarly, use the Display Columns radio buttons to tell QuickBooks when it should or shouldn’t display columns in a report. You can use the Reporting Calendar radio buttons to select the default annual reporting period. The default year can be a fiscal year (you set this option when setting up QuickBooks), a calendar year, or an income tax year. Click OK to activate these selections.
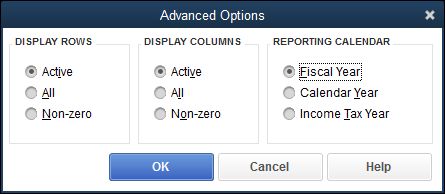
FIGURE 2-11: The Advanced Options dialog box.
To revert to the default display settings, click the Revert button on the Display tab (refer to Figure 2-10 ).
Using the Filters tab
The Filters tab is probably the most interesting and useful tab provided by the Modify Report dialog box. The Filters tab enables you to set up filters that you can use to specify what information gets summarized in the report. To use the Filters tab, shown in Figure 2-12 , you first select the field on which you want to base a filter from the Filter list box. If you want to filter information based on the account, for example, select Account in the Filter list box.
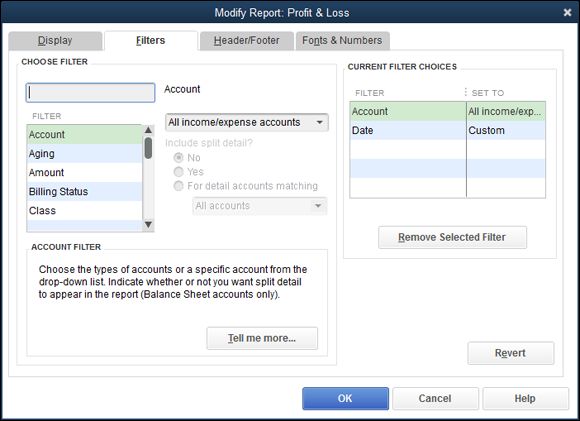
FIGURE 2-12: The Filters tab of the Modify Report dialog box.
After you identify the piece of data on which you want to base your filter, open the drop-down list next to the filter. If you selected an account filter, for example, QuickBooks names this drop-down list the Account box. When you open the drop-down list, QuickBooks displays a set of filtering choices. Figure 2-13 shows common filtering choices available when you’re creating an account filter: All Income/Expense Accounts, All Ordinary Income/Expense, All Ordinary Income/COGS, and so forth. You can pick a standard account filter from this list.
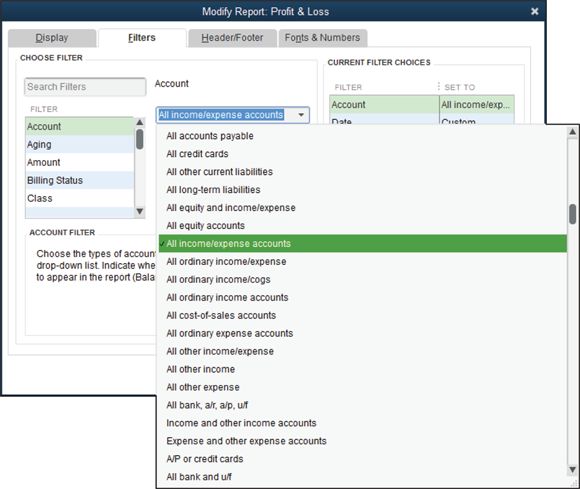
FIGURE 2-13: Select an Account filter.
Alternatively, you can pick, for example, the multiple accounts entry from the drop-down list. In this case, QuickBooks displays the Select Account dialog box, as shown in Figure 2-14 . This dialog box lets you select, on an individual basis, which accounts you want to appear on the report. If you want to create a report based purely on a checking account, an accounts receivable account, and an inventory asset account, you use the Select Account dialog box to select these accounts. To select the accounts that you want, click them. QuickBooks identifies selected accounts with a check mark.
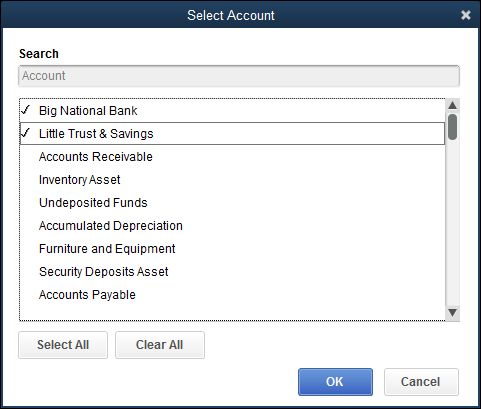
FIGURE 2-14: The Select Account dialog box.
Other fields and boxes on the Filters tab are pretty self-explanatory. The Include Split Detail? option buttons, available for account-based filters, let you tell QuickBooks whether it should include split transaction information. The Current Filter Choices list identifies what report filters are used for the report. You can remove a filter by selecting it from the Current Filter Choices list and then clicking the Remove Selected Filter button. You can also revert to the default filter by clicking the Revert button. Note that different boxes appear on the Filters tab for different filters.
Using the Header/Footer tab
The Header/Footer tab, shown in Figure 2-15 , controls what header and footer information appears on your report. You use the Show Header Information check boxes to control the report header. If you want your company name to appear at the top of the report, for example, select the Company Name check box. And if you want to change the company name that appears at the top of the report, edit the contents of the Company Name text box. The other Show Header Information check boxes work the same way. To remove the report title from the report, deselect the Report Title check box. To use a different report title, edit the contents of the Report Title text box.
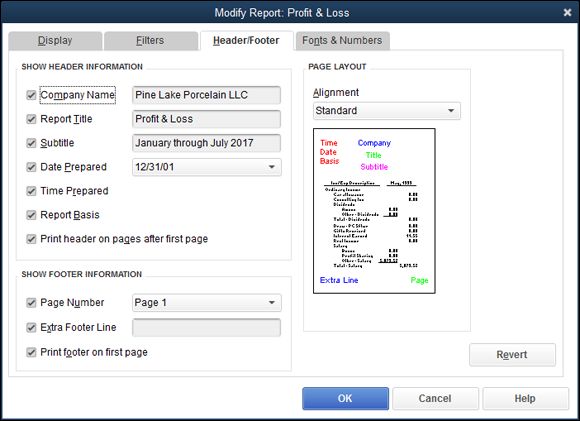
FIGURE 2-15: The Header/Footer tab of the Modify Report dialog box.
Use the Page Layout area — it provides a single Alignment drop-down list — to choose a layout for your report. By default, QuickBooks uses standard alignment. You can also choose left alignment, right alignment, or centered alignment. QuickBooks shows you how the report layout changes depending on the selected alignment.
As is the case with the other tabs of the Modify Report dialog box, you can click the Revert button to change back to the default header/footer settings.
Formatting fonts and numbers
The Fonts & Numbers tab, shown in Figure 2-16 , lets you change the font for selected pieces of report information. Use the Change Font For list box to select the bit of report information that you want to change. After this selection, click the Change Font button to display a dialog box like the one shown in Figure 2-17 . The Column Labels dialog box appears, for example, when you indicate that you want to change the font for column labels. Use the Font combo box to select the font for the column labels. Use the Font Style combo box to select the font style for the column labels. Use the Size combo box to select the point size for the column labels. Optionally, use the Effects check boxes to add or remove special effects. Or get really crazy and use the Color drop-down list to select the color for the piece of report data. When you’re finished, verify that your font formatting choices look right by checking the Sample box; then click OK.
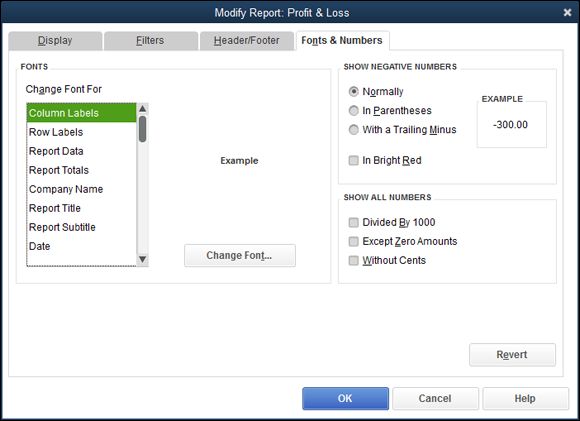
FIGURE 2-16: The Fonts & Numbers tab of the Modify Report dialog box.
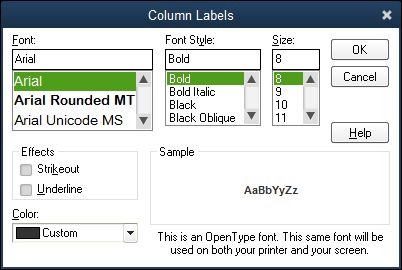
FIGURE 2-17: The Column Labels version of the Change Font dialog box.
When you click OK to close the dialog box used to change a font (refer to Figure 2-16 ), QuickBooks displays a message box, asking whether you want to change all the related fonts. If you do want to change the fonts — and you probably do — click Yes. Note that if you make some change that later turns out to be wrong, you can click the Revert button, which also appears on the Fonts & Numbers tab, to return to the default formatting for fonts and numbers.
The Show Negative Numbers area (refer to Figure 2-16 ) provides radio buttons and a check box that you can use to instruct QuickBooks to provide special formatting for negative values. Typically, QuickBooks shows negative values with a minus sign in front of the value. Alternatively, you can tell QuickBooks to place parentheses around the negative values (select the In Parentheses radio button) or to display them with a trailing minus sign (select the With a Trailing Minus radio button). You can also use color to flag negative numbers (select the In Bright Red check box).
The Show All Numbers area provides three check boxes that you can use to clean up and simplify your report. If your business is large enough that your report values are very large, select the Divided by 1000 check box. In that case, QuickBooks divides all the report values by 1,000 to make them easier to read. If you select the Except Zero Amounts check box, QuickBooks simplifies your report by not showing zero values. Finally, if you select the Without Cents check box, QuickBooks shows only dollars, not cents.
If you find yourself becoming overwhelmed by the amount of data being presented in a report, the Show All Numbers check boxes provide a handy way to get a somewhat-clearer view of the big picture.
Processing Multiple Reports
If you choose the Reports ⇒ Process Multiple Reports command, QuickBooks displays the Process Multiple Reports dialog box, shown in Figure 2-18 . This dialog box enables you to request a bunch of previously memorized or commented on reports at one time. To use the Process Multiple Reports dialog box, first select a report group from the drop-down list. Next, select the reports within the report group that you want, and check them off the list. If QuickBooks shows a report as selected (indicated with a check mark) that you don’t want, click the check mark to remove it. Then, for those reports that you’ve selected, verify that the From and To boxes show the correct report interval.
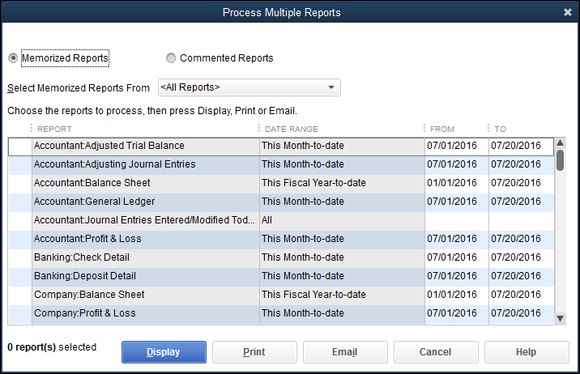
FIGURE 2-18: The Process Multiple Reports dialog box.
After you’ve selected the reports and provided the report interval dates, you can click the Display button to have QuickBooks display the report windows for each of the reports that you’ve selected. Alternatively, you can click the Print button to have QuickBooks print paper versions of each of the reports that you selected.
A Few Words about Document Retention
People sometimes ask me how long they should keep old reports, copies of invoices, and other bits of accounting information. Unfortunately, I don’t really have a one-size-fits-all answer to these questions. I can give you some things to think about, however:
· Consider whether the other party to a transaction is ever going to want the information. If you’re chronically arguing with a vendor about whether you’ve paid some bill, for example, it makes sense to hang on to those vendor bills and any records of your payment for as long as the argument may go on. This means that any paperwork that documents vendor bills and payments doesn’t necessarily have to be retained if you don’t have a problem.
· Consider tax accounting requirements. By law (a lot of people don’t realize this), a business is required to maintain accounting records to report its profits, losses, income, and deductions to the Internal Revenue Service. This means that anything that you need to calculate your profits or substantiate elements of your calculations should be maintained. A statute of limitations exists, however, typically running three years from the date you last filed the return. This means that in most cases, you don’t need to keep paperwork that’s any older than three years past the return that it relates to. In other words, if you have data from the year 2012, and you filed the year 2012 tax return on March 15, 2013, by March 16, 2016, you shouldn’t (in most cases) need to keep all that old paperwork. The statute of limitations dictates that you should be able to discard the old stuff. A word of caution is in order, because a handful of exceptions exist to this three-year statute of limitations:
o If you’ve been really sloppy and, through your sloppiness, omitted gross income in excess of 25 percent of what your return shows, the statute of limitations equals six years.
o If no return is filed or a fraudulent return is filed, no statute of limitations exists.
o States without income taxes (like Washington state, where I live and work) use a different set of rules and may use a longer statute of limitations. Washington state, for example, says the statute of limitations runs four years, not three.
· Consider the old records that you may need in the future to calculate an item for your tax return. These records need to be retained. If you bought a factory 30 years ago, for example, keep those purchase records until 3 (or 6) years after you sell the factory.
· Consider that in some industries, other document-retention rules or regulations exist. If you’re a physician, you keep your old patient records — and this may include patient accounting information — for longer than just three years. These other document-retention rules vary by industry. Find out what the rules are for your industry.
· Consider the risk of retaining confidential information too long. Finally, though you might ponder all the forgoing points and conclude that you should keep your financial records in perpetuity, note that this approach creates risks, too. The more financial documentation you archive, the easier in some cases it may be for this information to get lost or stolen. You wouldn’t want, for example, to keep so many years’ worth of data that you have to rent a warehouse in a bad part of town just to store the stuff.
Summing up, how do you make sense of these vague suggestions? Come up with a rough guess as to how long you think you should hang on to stuff. In my business, subject to the qualifications listed previously, I hang on to stuff for five years. I’m not doing anything criminal or fraudulent or sloppy, so anything that’s over five years old, I just toss. By the way, I’m also careful to segregate documents I can throw out by year into boxes. I label the boxes with the year number. I also label the boxes with a note like “Discard in 2016” just so I know when I can toss that stuff out.
 You may want to think twice about simply tossing out financial records. (I’m a little anal about this because I’m a CPA.) I actually don’t toss out my personal records or, of course, any client records: I shred the documents first. You may want to do the same thing.
By the way, some big-box office-supply stores offer in-store shredding services at reasonable prices.