QuickBooks 2017 All-In-One For Dummies (2016)
Book 4
Accounting Chores
Chapter 3
Preparing a Budget
IN THIS CHAPTER
![]() Employing common budgeting tactics
Employing common budgeting tactics
![]() Being practical about budgeting
Being practical about budgeting
![]() Working with the Set Up Budgets window
Working with the Set Up Budgets window
![]() Using a budget to manage your business
Using a budget to manage your business
Budgets provide business owners and managers powerful tools for better managing a firm’s operation. A budget can give the business owner or manager a way to more easily and more quantifiably manage the people working for the business. A budget can often identify problems or opportunities early. Finally, a budget truly gives the owner or manager a way to plan the year’s operation, think about what’s most important, and quantify what the firm should achieve over the year.
For these reasons, this chapter discusses some practical, common-sense approaches to budgeting within QuickBooks. I think you’ll be surprised by how straightforward this process is.
Reviewing Common Budgeting Tactics
Before I get into a detailed discussion of how you create a budget and use that budget within QuickBooks, I want to briefly identify and describe three very useful and common budgeting tactics: top-line budgeting, zero-based budgeting, and benchmarking. None of these three tactics is complicated. You probably know of and understand at least two of them already. You should consider all these tactics, however, as you construct formal or informal budgets for your business.
Top-line budgeting
A top-line budget is the simplest budget technique available. A top-line budget takes last year’s numbers or last month’s numbers and uses them for this year’s budget. If inflation has occurred, of course, a top-line budget may inflate last year’s or last month’s numbers by using an inflation factor. Conversely, if the business has shrunk a bit or fallen on hard times, the previous year’s or month’s numbers may be decreased by some amount.
Although top-line budgeting often receives a bad rap from people who don’t like the way it perpetuates the past, top-line budgeting has at least a couple of arguments in its favor:
· Top-line budgeting is easy. This is something big in its favor. Other budgeting techniques are often much more work.
· Top-line budgeting is based on reality. The numbers from last year or last month are real. This fact is a unique benefit of top-line budgeting that other budgeting tactics (which I describe in the following paragraphs) don’t offer. If you know, for example, that last month you spent $2,000 on rent, the reality of that true, actual number is a very useful starting point for thinking about what you’ll spend this month.
Top-line budgeting, however, possesses a well-known weakness: It tends to perpetuate previous bad budgeting decisions. If someone long ago decided to spend $10,000 on an advertisement in some special industry magazine, for example, top-line budgeting may continue to budget that $10,000 annual expense even though it no longer makes sense or never made sense.
Zero-based budgeting
Zero-based budgeting is the opposite of top-line budgeting. A zero-based budget works from the bottom up. A zero-based budget starts with individual revenue, expense, asset, liability, and owner’s equity accounts. It examines a specific account — postage expense, for example — and then tries to apply common sense and logic in coming up with a good postage expense budget amount. The budgeter may guess, for example, that the firm will send out 1,000 letters during the year and that the average postage per letter will equal 50 cents. In this case, the zero-based budgeting approach determines that postage expense for the coming year will probably equal $500. The zero-based budgeter calculates this amount by taking 1,000 letters and multiplying this amount by 50 cents postage cost per letter.
The advantage of zero-based budgeting is that it tends to fix poorly figured, previously budgeted amounts. It doesn’t simply perpetuate bad budgeting decisions of the past. New budgeted amounts are based on the application of common sense and simple arithmetic; the combination of these two items often produces pretty good numbers. That’s really cool.
Another neat feature of zero-based budgeting is that it makes people who benefit from or use some budgeted amount responsible for that budgeted amount. If some manager spent $50,000 on travel expense last year, top-line budgeting states that she gets to spend $50,000 this year. Zero-line budgeting, by contrast, makes the manager prove through the application of common sense and simple arithmetic that $50,000 of travel expense is reasonable for this year.
Zero-based budgeting isn’t perfect, however; it possesses a weakness in that it’s easy for budgeters to forget numbers or make calculation errors. Previously, I used the example of a budgeter guessing that postage expense for the coming year will be $500. That estimate comes from a guess about the number of letters sent in a year (1,000) and an estimate of the average postage expense for each letter (50 cents). If either of those numbers is wrong, or if (heaven forbid) the budgeter incorrectly multiplies one number by the other, the postage expense budget number is wrong. If the budgeter is budgeting hundreds or even thousands of budgeted amounts, she’ll undoubtedly make a few errors in the process. And she probably won’t be able to fix or find those errors because of the volume of budgeted amounts.
Benchmarking
One very powerful but unfortunately infrequently used technique is benchmarking. Benchmarking compares your actual or your preliminary budgeted numbers with the same numbers of similar-size businesses in your industry. CPA firms spend money on a tax library, for example. Annual fees for a tax library can run from as little as $100 or $200 a year to more than $10,000 a year. (These amounts are fees for a sole proprietor, by the way.) How do you know what number is an appropriate budgeted amount? Well, if you know what other CPA firms or other sole-proprietor CPAs are spending on their tax libraries, that information can probably help you budget what you should or can spend. The challenge, of course, is getting that comparable information.
Fortunately, getting comparable information is easier than most people realize. You can get information about the financial statistics of comparable firms in two ways:
· Your local library: Usually, you can find several good sources of general financial statistical information about businesses of varying sizes and in varying industries. Dun & Bradstreet, the Risk Management Association, Robert Morris & Associates, and a fellow named Leo Troy all publish annual summaries of financial ratios and financial statistics based on several sources. If you trot down to the library and visit the reference desk, you can get the librarian’s help in locating one or more of these reference sources. Suddenly, you have a wealth of information at your fingertips. You can see how much the average tavern spends on beer and peanuts, for example. You can see how much the average restaurant spends on advertising. In other words, you can see detailed financial information on a business exactly like yours!
· Industry associations: In addition to the general information available from reference sources commonly stocked at your local library, many industry associations and professional groups collect and publish industry-specific financial information. One of the first jobs I had early in my career was working as the controller of an electronics manufacturing firm. Our firm was a member of the American Electronics Association. That membership meant that we participated in a survey of financial information of member firms in the association. That survey gave us (and other AEA members) good statistics about average salaries spent for different positions, inventory investment, certain administrative expenses, and so forth.
Continuing with my example of CPAs buying tax libraries, I should mention that two industry associations — the Texas Society of Certified Public Accountants and the American Institute of Certified Public Accountants — publish statistics for CPA firms. These publications identify what the average sole proprietor spends on his tax library. I’ll bet you a dill pickle that your industry association — whatever it is — has similar information available. (One other thing about the CPA’s benchmarking studies: They’re online and dynamic, so people benchmarking can compare their practice against similar-size firms.)
Putting it all together
Just for the record — and you’ve probably already guessed this — you shouldn’t use just one approach to build your budget. You may use top-line budgeting for some of your numbers, and you may use zero-based budgeting for other numbers. For really important or key numbers in your budget, you may take the time and effort to benchmark your numbers against those of similar-size firms in your industry. Good budgeting, then, combines the budgeting tactics described in this chapter to come up with a budget that makes sense and lets you plan your firm’s finances for the year.
Taking a Practical Approach to Budgeting
Business budgeting, unfortunately, isn’t simply a matter of listing expected revenue and expense amounts. Typically, you also create a balance sheet. Balance-sheet budgeting is too complicated to do on the back of a napkin or at the breakfast table in the morning before the kids get up.
Therefore, to create budgeted numbers for a balance sheet, you use a tool and an approach like the one described (in some detail) in Book 6, Chapter 2 .
 If all that you want to budget are revenue amounts and expense amounts, you can do that in a very simple, crude fashion. You can list expected revenue amounts by account on the back of a cocktail napkin, for example.
Using the Set Up Budgets Window
After you’ve come up with a budget — presumably by using a tool like the one described in Book 6, Chapter 2 and by employing the sorts of budgeting tactics described previously in this chapter — you record your budget in QuickBooks.
Creating a new budget
To create a new budget in QuickBooks, follow these steps:
1. Choose the Company ⇒ Planning and Budgeting ⇒ Set Up Budgets command.
This opens the Create New Budget dialog box, shown in Figure 3-1 , which you use to create a new budget. (Bet you wouldn’t have guessed that.)
Note: If you have previously set up a budget, QuickBooks displays the Set Up Budgets window rather than the Create New Budget dialog box. If QuickBooks displays the Set Up Budgets window, you need to click its Create New Budget button to display the Create New Budget dialog box, as discussed in “Working with an existing budget ” later in this chapter.
2. Select the fiscal-year period.
Identify the fiscal year you’re budgeting for. To do that, enter the fiscal year in the provided text box, shown in Figure 3-1 . If you’re budgeting for fiscal year 2018, for example, you use those buttons to change the year to 2018.
3. Choose whether to create a profit and loss or balance sheet budget.
To create a profit and loss budget, select the Profit and Loss radio button, click Next, and proceed to Step 4. To create a balance sheet budget, select the Balance Sheet radio button, click Finish, and skip to Step 5.
Note that you use a different approach for profit and loss budgets and balance sheet budgets. For profit and loss budgets, you budget the amount of revenue or expense expected for the account for the month. For balance-sheet budgets, you budget the ending account balance — that’s the ending account balance expected for the asset, liability, or owner’s equity account at month’s end.
4. In the Additional Profit and Loss Criteria dialog box (see Figure 3-2 ), specify additional profit and loss budget criteria, and click Next.
If you chose to create a profit and loss budget in Step 3, select the Customer:Job radio button to further extend your budget to include Job details; select the Class radio button to include classes in your budget; or simply select the No Additional Criteria radio button.
Note: To budget by class, you must first turn on class tracking. For more information about class tracking, refer to Book 2, Chapter 3 .
5. In the Create New Budget dialog box, choose whether to create the budget from scratch or previous data.
To create a budget from scratch and start with a clean slate, select the Create Budget from Scratch radio button, shown in Figure 3-3 . To create a budget based on your actual data from last year, select the Create Budget from Previous Year’s Actual Data radio button.
6. Click Finish when you’re done.
QuickBooks displays the Set Up Budgets window (see Figure 3-4 ).
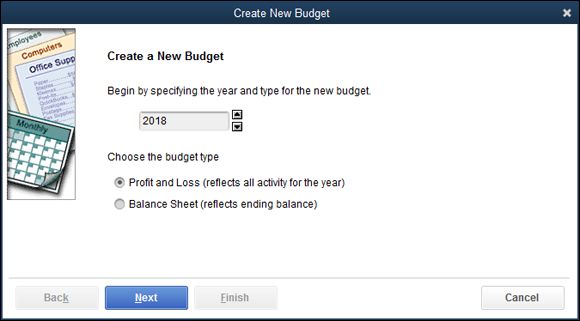
FIGURE 3-1: The Create New Budget dialog box.
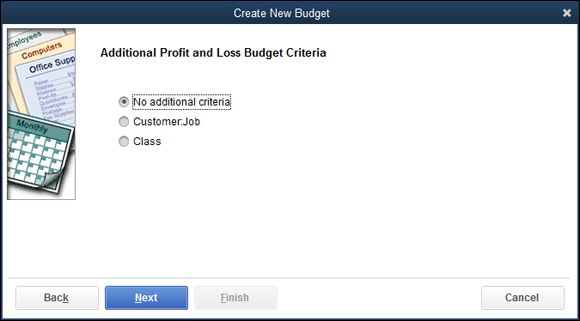
FIGURE 3-2: The Additional Profit and Loss Budget Criteria selections.
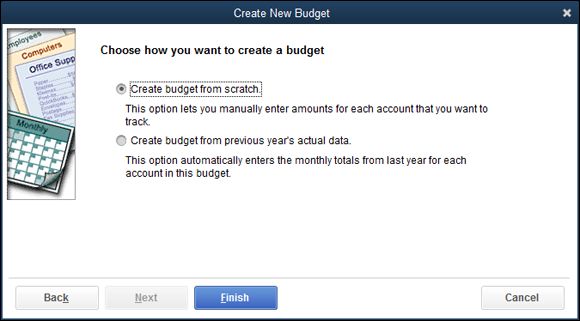
FIGURE 3-3: Choosing whether to create a budget from scratch.
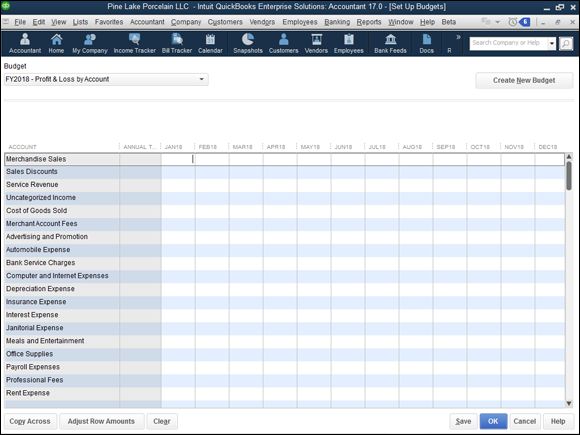
FIGURE 3-4: The Set Up Budgets window.
Working with an existing budget
To edit an existing budget in QuickBooks, follow these steps:
1. Choose the Company ⇒ Planning & Budgeting ⇒ Set Up Budgets command.
QuickBooks displays the Set Up Budgets window — the same one shown in Figure 3-4 . You use this window to record the amount that you expect for each revenue and expense for each month during the year in which you’re budgeting.
2. Select a budget, or create a new one.
Select the budget you want to work with from the Budget drop-down list at the top of the window. To create a new budget (you can have as many budgets as you want), click the Create New Budget button. For help with creating a new budget, see the preceding section.
3. (Optional) Choose a customer.
You typically budget by account. If you want to budget in finer detail by also estimating amounts for customers, jobs, or classes, you can use the Current Customer:Job drop-down list to identify specific customers from whom you expect revenue or for whom you expend costs. Note: The Customer:Job drop-down list box doesn’t appear unless, when you created the budget you’re now working with, you indicated that you wanted to budget by customer.
4. Record the budgeted amounts for each month of the fiscal year.
Type the amounts you want to budget for each account in the appropriate month columns. Again, remember that revenue and expense accounts are budgeted as the amount expected for the month. Asset, liability, and owner’s equity amounts are budgeted as the ending account balance expected for the month.
To copy the budgeted amount for one month into the text boxes for the succeeding months, click the Copy Across button.
5. (Optional) Adjust row amounts.
If you find that the yearly total for an account isn’t what you want it to be, you can go back and change the amounts for each month so that they add up to the correct total, or you can click the Adjust Row Amounts button. Clicking this button displays the Adjust Row Amounts dialog box, shown in Figure 3-5 . Use the Start At drop-down list to select the month you want to start with (either the first month or the currently selected month). Then choose whether you want to increase or decrease the amounts budgeted, and by how much (by entering either a dollar amount or a percentage). Click OK when you finish; QuickBooks closes the dialog box.
6. Repeat as necessary.
Repeat Steps 3 through 5 for each of the accounts for which you want to record budgeted amounts.
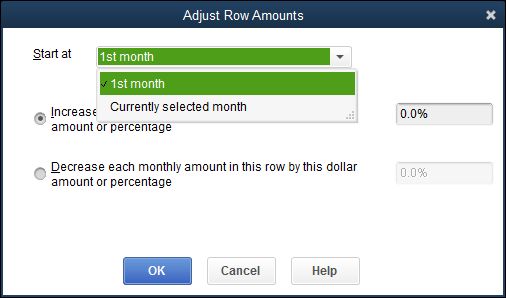
FIGURE 3-5: The Adjust Row Amounts dialog box.
Yes, I know, this is a lot of work. Just so you know, in large companies with hundreds or thousands of employees, two or three people spend much of or even all of their year working with the budgeted data.
Managing with a Budget
After you record your budget in QuickBooks (as described in the earlier section “Using the Set Up Budgets Window ”), you can compare your actual financial results with budgeted amounts by choosing commands from the Budgets & Forecasts submenu that QuickBooks displays. When you choose the Reports ⇒ Budgets & Forecasts command, QuickBooks provides several budgeting reports, described in the following list:
· Budget Overview: This report summarizes your budgeted amounts. You can use it to look at and error-check your budget.
· Budget vs. Actual: This report lets you compare budgeted income statement information with actual income statement information. The report, therefore, lets you compare your expected revenue and expenses with actual revenue and expenses.
· Profit & Loss Budget Performance: This report lets you compare your actual income, expenses, and profits with your budgeted income, expenses, and profits.
· Budget vs. Actual Graph: This graph isn’t a report. It’s a chart that shows budgeted and actual information.
· Forecast Overview: This report summarizes a QuickBooks forecast. A forecast is basically a prediction about your future revenue and cash flow. You use forecasts to do “what if” planning.
· Forecast vs. Actual: This report compares a forecast with what actually happened.
The way that you use a budgeting report’s information is key — and also the secret to getting value from your budgeting efforts. With a well-constructed, common-sense budget, you can look for variances between your budget and your actual financial results. You want to use your budget to spot situations in which, for example, an expense item is too low, an asset item is too high, or some revenue number is trailing what you expect. Variances between expected results and actual results indicate unexpected results. Unexpected results often suggest problems … or opportunities. Think about the following examples of variance and what the variances may indicate:
· Monthly revenue is $40,000 instead of $50,000. Monthly revenue that’s 20 percent less than expected may indicate problems with your product, problems with your sales force, or problems with your customers. In any case, if sales represent only 80 percent of what you expect, you probably need to implement immediate corrective action.
· Inventory balances are averaging $50,000 at month’s end rather than $100,000 at month’s end. Having a lower-than-expected inventory balance may be either good or bad. The ending inventory balance that’s half what you expect may indicate that you’re selling products much faster than you expected (and, therefore, you should increase your inventory investment and purchasing of inventory). Having a low inventory investment may also mean, however, that you’re simply not getting materials from your vendors as fast as you need them, and as a result, you’re at great risk of losing sales because of inadequate stock levels.
· Research and development expenses equal $50,000 a year instead of $25,000 a year. Research and development expenses that are twice what you expect seem to be bad. How can it be good to spend twice as much on an expense as you expect? Doubling your research and development expenditures may be good, however, if you’re unexpectedly investing in some promising new product, idea, or technology.
· Sales to a particular class of customer are 50 percent higher. Suppose that you used classes to track sales to customers inside the country and outside the country. If you see that, quite unexpectedly, sales to customers outside the country are 50 percent above what you expect, that variance may indicate an opportunity to sell even more outside the country. Maybe with more effort and energy, outside-the-country customers can become an even larger part of your business. Sometimes, variances identify opportunities that you’d otherwise miss.
Some Wrap-Up Comments on Budgeting
Before I leave the subject of budgeting, I want to share a handful of final comments:
· Budgeting is an example of the old phrase “Plan your work and then work your plan.” Budgets aren’t handcuffs. Budgets aren’t straitjackets. Budgets are simply planning tools that you use to thoughtfully make decisions about your firm’s financial affairs for the coming year.
· If you aren’t getting value from the budgeting process, you shouldn’t do it. Or, at the very least, you should change the way you’re doing it. No kidding — I won’t argue that you should budget if you don’t get value from the process. I think, however, that most businesses do get value. If you can manage your business without a budget — and I mention an approach that works for doing this in a tip at the end of this chapter — I don’t think you should budget. You use those tools that deliver the most value to you in managing your firm. For many people, budgeting does just that. If it doesn’t for you, skip the work. Time is often the scarcest resource for business owners and managers.
· Budgets can be essential tools for managing people with financially quantifiable responsibilities. Okay, I know budgets have a bad rap, and they aren’t perfect, but you know what? If you have people working for you who have responsibilities that you can financially quantify, you can use a budget to manage those people. Suppose that you have salespeople who should individually sell $25,000 worth of stuff each month. If you budget by salesperson (you probably need to set up a class for each salesperson or a revenue account for each salesperson), you can use a budget to compare actual sales generated by each person with the budgeted sales expected for him. If you look at Joe every month and see that he has $30,000 in sales predictably, you can use that information in your management of Joe. Probably, Joe’s overproducing means that he’s doing a good job. If you look at Joe’s brother Bob and see that he’s doing $20,000 in sales every month when you expect him to do $25,000 in sales, you can probably see a problem and an opportunity for improvement. All this makes sense, right?
· People who like to budget tend to (in my experience) focus on unfavorable variances. I mention this because although unfavorable variances often identify problems that need to be corrected, favorable variances sometimes are more interesting and more useful to dissect. Suppose that you have a business in which you expect salespeople to generate $25,000 in sales a month. If Julia is generating $75,000 a month in sales, that’s pretty darn interesting. Julia probably knows something or has skills or an approach that the other salespeople don’t have. Perhaps, with just a little bit of luck, you can figure out why Julia does so well — and then use this new knowledge to get your other salespeople to sell more stuff each month.
· The key budgeting numbers to watch are often a pretty small set. Although a budget according to QuickBooks (and, I guess, Steve Nelson) may have hundreds of numbers, you may be able to manage your business just fine by looking at just a handful of numbers. Maybe in your business, everything comes down to sales. If sales really drive everything else — your expenses and, of course, all your profits — you may not have much reason to track the amount that you’re spending each month on your telephone bill or postage expense. If you can distill your financial plan down to a few numbers that you need to watch, you can make your budgeting and financial analyses much simpler. All you do is identify the key financial statistics to watch — and then watch them regularly.
Financial ratios are often very useful tools for monitoring a firm’s financial performance. I know several business owners who successfully manage their businesses without a formal budget by looking at two or three items, including cost of goods sold and gross margin percentages. The cost of goods sold includes the cost of the products or items being sold. A gross margin percentage is the percentage of sales left over after paying for the cost of goods sold. To dig into these terms and find out about working with financial ratios, see Book 5, Chapter 1 .
All materials on the site are licensed Creative Commons Attribution-Sharealike 3.0 Unported CC BY-SA 3.0 & GNU Free Documentation License (GFDL)
If you are the copyright holder of any material contained on our site and intend to remove it, please contact our site administrator for approval.
© 2016-2026 All site design rights belong to S.Y.A.