QuickBooks 2017 All-In-One For Dummies (2016)
Book 6
Business Plans
Contents at a Glance
1. Chapter 1: Profit-Volume-Cost Analysis
1. Seeing How Profit-Volume-Cost Analysis Works
2. Calculating Break-Even Points
3. Using Real QuickBooks Data for Profit-Volume-Cost Analysis
4. Recognizing the Downside of the Profit-Volume-Cost Model
5. Using the Profit-Volume-Cost Analysis Workbook
2. Chapter 2: Creating a Business Plan Forecast
1. Reviewing Financial Statements and Ratios
2. Using the Business Plan Workbook
3. Understanding the Workbook Calculations
4. Customizing the Starter Workbook
3. Chapter 3: Writing a Business Plan
1. What the Term “Business Plan” Means
2. A Few Words about Strategic Plans
3. Look, Ma: No Strategy
4. A White-Paper Business Plan
5. A New-Venture Plan
Chapter 1
Profit-Volume-Cost Analysis
IN THIS CHAPTER
![]() Understanding how profit-volume-cost analysis works
Understanding how profit-volume-cost analysis works
![]() Computing break-even points
Computing break-even points
![]() Performing profit-volume-cost analysis with real QuickBooks data
Performing profit-volume-cost analysis with real QuickBooks data
![]() Dealing with some minor conundrums
Dealing with some minor conundrums
![]() Working with the Profit-Volume-Cost Analysis workbook
Working with the Profit-Volume-Cost Analysis workbook
Profit-volume-cost analysis is a powerful tool that estimates how a business’s profits change as its sales volumes change, as well as break-even points. (A break-even point is the sales revenue level that produces zero profits.)
Profit-volume-cost analysis often produces surprising results. Typically, the analysis shows that small changes in a business’s sales volume produce big changes in profits.
 Hotels and airlines are types of businesses that often see surprising fluctuations in their profits based on relatively modest changes in their sales revenue. Indeed, now that you know this, you’ll probably notice that investment analysts often use small changes in hotel occupancy and in airline load factors (the percentage of seats filled on a plane) to explain big changes in profits.
The first part of this chapter talks about the theory of profit-volume-cost analysis. Understanding the theory may be all you need to apply this tool to your specific setting. At the end of the chapter, I describe a Microsoft Excel workbook that you can use for more sophisticated profit-volume-cost analysis. That workbook is available to download from my website at http://stephenlnelson.com/wp-content/uploads/profit_volume_cost-1.xlsx .
Seeing How Profit-Volume-Cost Analysis Works
Profit-volume-cost analysis uses three pieces of information to show how your profits change as sales revenue changes: estimates of your sales revenue, your gross margin percentage, and your fixed costs. Usually, all three items of data are easy to come by.
Suppose that you’re a builder of high-end racing sailboats that sell for $100,000 each. Further suppose that each boat costs you $40,000 in labor and material and that your shop costs $160,000 a year to keep open.
You can calculate your gross margin percentage by using the following formula:
(boat sales price - direct labor and material costs) ÷ (boat sales cost)
Or you can use the actual numbers from my example:
($100,000 - $40,000) ÷ ($100,000)
This formula returns the result 0.6, or 60 percent. In this case, your fixed cost amount equals $160,000.
With the fixed cost and gross margin percentage information, you can calculate the profits that different sales revenues produce. To make this calculation, you use the following formula:
profits = (sales × gross margin percentage) - fixed cost
Table 1-1 shows some examples of how you can use this formula to estimate the profits at different sales volume levels. At $200,000 in annual sales, for example, the business suffers a $40,000 loss. At $300,000 in sales, the business earns a $20,000 profit. At $400,000 in sales, the business earns an $80,000 profit. Table 1-1 also shows the formula used to estimate profits.
TABLE 1-1 Applying the Profit-Volume-Cost Formula
|
Sales |
Formula |
Result |
|
$200,000 |
($200,000 × 0.60) - $160,000 |
$40,000; a loss |
|
$300,000 |
($300,000 × 0.60) - $160,000 |
$20,000; a little profit |
|
$400,000 |
($400,000 × 0.60) - $160,000 |
$80,000; a nice profit |
The really interesting thing about the information shown in Table 1-1 — and I don’t want to beat a dead horse here — is that profits often change more significantly than revenue changes. Look at Table 1-1 , and examine what happens when revenue increases from $300,000 to $400,000 — roughly a 33 percent increase. You see that profits quadruple from $20,000 to $80,000.
Here’s another way to look at the estimated profits at the $300,000 and $400,000 sales levels: If sales drop by 25 percent from $400,000 to $300,000, profits decrease by 75 percent from $80,000 to $20,000.
Table 1-1 illustrates a common experience of businesses. Relatively modest changes in sales revenue produce large — sometimes stunningly large — changes in profits. The reason that you perform profit-volume-cost analysis, therefore, is to understand how sensitive your business profits are to changes in sales volume. With this information, you can understand how important it is to prevent decreases in sales, and you can reap the rewards of increasing sales.
I need to make one final point about the information shown in Table 1-1 : You can calculate this same information, almost in longhand fashion, by using miniature income statements. Table 1-2 , for example, shows some miniature income statements that calculate profits at various sales levels.
TABLE 1-2 Miniature Income Statements
|
Boats sold |
2 |
3 |
4 |
|
Sales revenue |
$200,000 |
$300,000 |
$400,000 |
|
Variable costs |
($80,000) |
($120,000) |
($160,000) |
|
Gross margin |
120,000 |
180,000 |
240,000 |
|
Fixed costs |
(80,000) |
(160,000) |
(160,000) |
|
Profits |
$40,000 |
$20,000 |
$80,000 |
It’s no coincidence that the miniature income statements shown in Table 1-2 produce the same estimates of profit as the formulas shown in Table 1-1 . The difference — and the advantage of the approach to information illustrated in Table 1-1 — is that the formula makes it possible to quickly calculate estimates of profits at any sales level. Constructing even a miniature income statement like the one shown in Table 1-2 is typically more work than using the approach shown in Table 1-1 .
Calculating Break-Even Points
Here’s another important piece of information that belongs between your ears: A common application of the formula used in Table 1-1 , earlier in this chapter, is to calculate a break-even point. A break-even point, as noted previously, shows the sales revenue volume that produces zero profit and zero loss.
Remember the formula for performing profit-volume-cost analysis? It goes like this:
profits = (sales revenue × gross margin percentage) - fixed costs
Rather than calculate profits based on the other three variables (sales revenue, gross margin percentage, and fixed costs), you can calculate a sales revenue amount based on the other three variables (profits, gross margin percentage, and fixed costs).
The formula for making such a break-even calculation, based on algebraic manipulation of the profit-volume-cost analysis formula, looks like this:
Break-even point (in sales revenue) = fixed costs ÷ gross margin percentage
To calculate the break-even point in sales revenue for the example boat-building business, you make the calculation
$160,000 ÷ 40 percent
which produces the result
$266,667
Accordingly, the boat-building business needs $266,667 of revenue to break even.
The break-even point formula described in the preceding paragraphs estimates a break-even point in revenue. Often, however, such a revenue-based break-even point doesn’t make complete sense. In the case of the boat-building business in which you sell boats for $100,000 each, there’s no practical way to get $266,667 of revenue. You can’t sell two thirds of a boat. The correct way to interpret a break-even point in revenue in this example, then, is to interpret it as a rough break-even point. As a practical matter in the boat-building business, the break-even point is slightly less than three boats per year.
CONFUSED ABOUT THE BREAK-EVEN POINT FORMULA?
The formula for calculating the break-even point seems pretty different from the formula for calculating profit-volume-cost information — or at least it does at first blush. But the second formula is derived from the first. Because some compulsive readers may want to know how this variation works, I show it to you in this sidebar.
Here’s the fixed base formula:
profits = (sales revenue × gross margin percentage) - fixed costs
If I subtract the fixed costs from both sides of the formula, I get the following:
profits - fixed costs = sales revenue × gross margin percentage
Because profits equal zero at the break-even point, I can simplify this formula further by just scratching out the profits variable, as shown here:
-fixed costs = sales revenue × gross margin percentage
If I divide both sides of the equation by the gross margin percentage, I get the basic break-even point formula, as shown here:
-fixed costs × gross margin percentage = sales revenue
And that’s the way the formula gets created. Essentially, all you have to do is divide the fixed-costs amount by the gross margin percentage. The result shows the sales revenue at which a firm breaks even.
If, in this example, you were working with boats that cost $1,000 each or $100 each, the precision of the break-even point would be much greater. If you manufactured day-sailor boats that cost $1,000 apiece, you would know that the break-even point is somewhere between 266 and 267 boats (calculated by dividing the $266,667 of revenue by $1,000). If the boats cost $100 each — perhaps they’re model boats — you know that the break-even point is between 2,666 model boats and 2,667 model boats (calculated by dividing the revenue amount by $100).
In either case, you see that the smaller the revenue per unit, the more precision you get in the break-even point in units.
You can also see from this example that the process of converting a break-even point in revenue to a break-even point in units is simply a matter of dividing the break-even point in revenue by the unit price.
Using Real QuickBooks Data for Profit-Volume-Cost Analysis
As noted previously, you need three items of data to perform profit-volume-cost analysis: sales revenue, gross margin percentage, and fixed cost. Typically, these items of data aren’t difficult to find if you’ve been using QuickBooks. Nevertheless, this data doesn’t map perfectly to line items that appear in a QuickBooks income statement. For this reason, I briefly discuss how you come up with these pieces of information.
Sales revenue
The sales revenue levels that you use in the formula are the sales revenue levels that you want to experiment with. They probably represent possible — or maybe even likely — sales revenue levels for your business. Accordingly, the sales revenue levels don’t really come from QuickBooks. You may want to look at past income statements to determine reasonable or likely sales revenue levels. The formula inputs are probably just rough estimates, however; they don’t actually come from a QuickBooks income statement.
Gross margin percentage
The gross margin percentage, as illustrated previously, is calculated by subtracting your variable costs from your sales revenue and then dividing that result (which is the gross margin) by the sales revenue. The variable costs include the costs of the items that you sell: inventory, commissions, shipping, and similar costs.
Because calculating the gross margin percentage can be a little bit confusing the first few times you do it, here are a couple of examples to review:
· Boat building: If you sell $100,000 boats, and the material, labor, and commission expenses for each boat total $40,000, you can calculate the gross margin percentage by using the formula
($100,000 - $40,000) ÷ $100,000
That formula returns 0.6, or 60 percent, which is the gross margin percentage of the boat-building business.
· Tax return service: For another example, assume that you’re running a personal service business in which you prepare tax returns for a living. Further assume that you charge $200 for a small-business tax return and that the only variable cost is a $40 fee that you have to pay to the tax software company for the return. In this case, you calculate the gross margin percentage by using the formula
($200 - $40) ÷ $200
This formula returns the value 0.8, or 80 percent. In this case, 80 percent is the gross margin percentage for your tax return preparation business.
The key point is that variable costs vary with the sales revenue. If a sale occurs, the sale produces variable costs. If no sale occurs, no variable costs are incurred.
So what does all this mean? Well, typically, the variable costs equal the cost of goods sold (COGS) number that’s shown on your QuickBooks income statement. This COGS number probably includes the inventory items that you sell (if you’re in a business in which you resell inventory) and other items, such as freight and sales commissions. Therefore, you can get most or all the variable cost information right off the QuickBooks income statement.
 You may need to fiddle with the COGS amount reported in the QuickBooks income statement. Remember that variable costs are those costs that vary with sales, and as a result, some of the costs that you’ve included in the COGS section of your income statement may not be variable. Some of the costs reported in the regular operating-expenses portion of your income statement are actually variable.
Therefore, you may want to think about the costs reported in the COGS section and in the operating expenses section of your income statement. If you realize that the COGS value isn’t a good estimate of variable costs, make some adjustments. A fixed cost that’s included in COGS number should be subtracted, obviously. And a variable cost that’s included with the other operating expenses may need to be added to the COGS number.
Fixed costs
Fixed costs include all your other nonvariable costs. In a nutshell, fixed costs are fixed because they don’t change with sales volume. Fixed costs include items such as rent paid on an office or factory, salaries paid to permanent employees, overhead for insurance, and so forth.
To see how fixed costs work and get calculated, return to the examples of the boat-building business and the tax return preparation service:
· In the boat-building business, the firm carries overhead of more than $160,000. This amount may include $80,000 for the shop in which you build your boats and $80,000 for the salaries that you pay to two craftsmen whom you continue to employ whether or not you have boats to build. In this case, then, these overhead costs constitute your $160,000 of fixed costs. These fixed costs don’t change based on changes in sales volume.
· In the tax return service, your only fixed expenses are $100 a month for yellow-pages advertisements and $700 a month to rent a small office. In this case, then, your fixed costs equal $800 a month. Again, these fixed costs don’t change based on changes in sales volume.
Recognizing the Downside of the Profit-Volume-Cost Model
Okay, this stuff all sounds fine and good, but what happens when little reservations start to pop up? Annoying little problems? Minor weaknesses that turn into irritations?
Here’s the problem: Like any abstract explanation of reality, the profit-volume-cost model isn’t perfect. If you want to get nitpicky — and you should for a moment — several practical problems creep into the calculations of the profit-volume-cost formula and its application to your real-life business affairs. I discuss these problems in the following list, but I don’t think that having such problems means that you shouldn’t use the model. They only change the way that you work with the model.
· Any assumptions that you make about variable costs and fixed costs typically apply only over a range of sales revenue. In the boat-building business, for example, the numbers used in the preceding sections don’t apply if the boat builder scales up and builds 500 boats a year. That’s obvious, right? It may be that the range of sales revenue valid for a 60 percent gross margin percentage — and, therefore, $160,000 of fixed costs — is really somewhere between 0 boats per year and 8 boats per year. Move to a sales revenue level above 8 boats a year, and very likely, either the gross margin percentage or the fixed cost amount changes.
· In the super-long run, as a practical matter, there’s no such thing as a fixed cost. Essentially, every cost is variable. In the boat-building business, for example, you could — in the long run — lay off two craftsmen and move to a smaller shop. Perhaps you could even build boats in your backyard. Fixed costs, in other words, are fixed only for a particular period of time. If you move beyond that period of time, the fixed costs are no longer fixed. This seems like an obvious point, but it’s important to recognize.
· In the super-short term, there’s no such thing as a variable cost. (Or at least there aren’t very many variable costs.) In the boat-building business, even if you pay your laborers an hourly wage for building the boats, you probably can’t send the laborers home early just because work for the day is done. You can’t tell your laborers at the end of Tuesday not to come in Wednesday, Thursday, or Friday just because you have no work for them. Other variable costs may work the same way — not always, but sometimes. In any case, recognize that some costs may vary over a month or year but not over a day or a week. In other words, in the super-short term, variable costs often aren’t very variable.
The three preceding conundrums indicate that profit-volume-cost analysis suffers some limits. You can’t use a gross margin percentage and a fixed cost amount for just any sales revenue estimates; you use those two items of data for a carefully considered range of sales revenue volumes. Furthermore, you can’t use profit-volume-cost analysis for super-short time frames. Variable costs in that case aren’t really variable. And you can’t use profit-volume-cost analysis for super-long time frames because in the long run, no fixed cost stays fixed.
To generalize, the profit-volume-cost analysis tool provides rough measurements. These rough measurements can be very useful to you, but they’re really just rough measurements. Always apply common sense when using profit-volume-cost analysis.
Maybe it’s only a little game I play with myself, but sometimes, I don’t think about fixed costs and variable costs. Instead, I think about sort-of fixed costs and sort-of variable costs. By admitting up front that the fixed costs aren’t always solidly fixed and that the variable costs aren’t always solidly variable, I find myself getting more comfortable with the profit-volume-cost analysis formula. I remind myself that the model isn’t perfect — only a rough tool to estimate profit and break-even points.
Using the Profit-Volume-Cost Analysis Workbook
I’ve created a Profit-Volume-Cost Analysis workbook for you in case you want to perform more sophisticated profit-volume-cost analysis. This workbook is available on my website at http://stephenlnelson.com/wp-content/uploads/profit_volume_cost-1.xlsx .
The Profit-Volume-Cost Analysis workbook uses an Excel 2007-2016 file format. This means you can open and use the workbook with most recent versions of Excel (including Excel 2016, which is the version of Excel that I used for this book).
The Profit-Volume-Cost Analysis workbook enables you to estimate profits at a variety of sales revenue volumes, to estimate break-even points, and to chart break-even and profit-volume-cost data. Some of the calculations are a little bit cumbersome, but almost every calculation is simply an extension of what I discuss in the preceding paragraphs of this chapter.
In the remaining pages of this chapter, I describe how to use the Profit-Volume-Cost Analysis workbook and how to understand and interpret both the break-even analysis and the profit-volume-cost analysis performed by the workbook. I also share a few words about the charts that graphically depict the profit-volume-cost analysis results.
Collecting your inputs
Figure 1-1 shows the worksheet range in which you enter the raw data required for the profit-volume-cost analysis. The workbook collects more data points than you may expect. Most of this information, however, is simply a slightly more granular approach to collecting the three basic inputs that any profit-volume-cost analysis depends on: sales revenue estimates, gross margin percentage, and fixed costs.
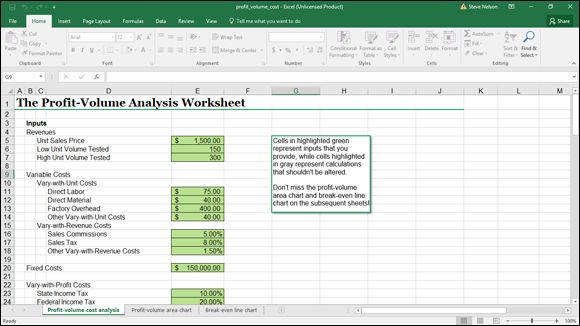
FIGURE 1-1: The inputs area of the Profit-Volume-Cost Analysis workbook.
You don’t need to be an Excel expert to use the Profit-Volume-Cost Analysis workbook described in this chapter, but do need to know how to start and stop Excel and how to enter values into worksheet cells. If you don’t possess these Excel skills, you may want to consider buying and reading a recent edition of Excel For Dummies, by Greg Harvey (John Wiley & Sons, Inc.).
To use the Profit-Volume-Cost Analysis workbook, follow these steps:
1. Open the Profit-Volume-Cost Analysis workbook.
1. Point your browser to http://stephenlnelson.com/wp-content/uploads/profit_volume_cost-1.xlsx .
2. When your browser asks whether you want to open the file or save the file, indicate that you want to save the file to your hard drive.
3. Open the file by starting Microsoft Excel and choosing File ⇒ Open.
4. When Excel displays the Open dialog box, open the folder with the profit_volume_cost.xlsx file and then double-click the file.
2. Describe the sales revenue that you want to test.
To do this, you must provide three pieces of information: the unit sales price, the low unit sales volume, and the high unit sales volume.
Enter the unit sales price into cell E5. If you sell an item that costs $1,500, for example, you enter $1,500 into cell E5. Use the low unit volume tested and high unit volume tested inputs shown in cells E6 and E7 (respectively) to identify the range of sales volumes that you want to test. The low unit volume tested value multiplied by the unit sales price equals the lowest revenue volume that the worksheet tests. The high unit volume tested multiplied by the unit sales price amount equals the largest sales revenue volume tested.
The three revenue inputs that you collect and input into cells E5, E6, and E7 tell the workbook which sales revenue volumes you want to analyze.
If you wanted to use the Profit-Volume-Cost Analysis workbook to test sales volumes for the boat-building business that I describe earlier in the chapter, the unit sales price would equal $100,000, so the low unit volume tested may equal 2, and the high unit volume may equal 5. These inputs, then, would test sales volumes of between $100,000 and $500,000, based on a $100,000 price for a boat.
3. Describe the variable costs.
When you do real-life profit-volume-cost analysis, you find that your variable costs fall into one of two categories: variable costs that can be expressed as an amount per unit and variable costs that can be expressed as a percentage of the sales price. The worksheet range E10:E18 collects the information needed to describe these sorts of variable costs.
The first set of variable costs, which I call vary-with-unit costs, goes into cells E11, E12, E13, and E14. Any direct labor costs associated with the item that you’re selling go into cell E11. Direct material costs go into E12. Factory overhead costs, which are variable and based on units sold, go into cell E13. If you have any other vary-with-unit costs, you enter the amount per unit for these costs into cell E14.
The example vary-with-unit cost values shown in Figure 1-1 mean that for each unit sold, the assumption is that the business pays $75 per unit in direct labor, $40 per unit in direct materials, $400 per unit in factory overhead, and another $40 per unit for other vary-with-unit costs. If you add up these amounts, you see that vary-with-unit costs equal $555 per unit sold.
In addition to vary-with-unit costs, firms often pay variable costs that are best expressed as a percentage of revenue. In the Profit-Volume-Cost Analysis workbook, the worksheet range E16:E18 supplies space to describe and record these variable costs, which I call vary-with-revenue costs. The workbook, for example, shows a 5 percent sales commission in cell E16. The workbook shows an 8 percent sales tax in cell E17. And just to provide a catch-all category for other vary-with-revenue costs, the workbook includes (and I show for purposes of this example) another vary-with-revenue costs value in cell E18.
In the case of the sample data set shown in Figure 1-1 , for example, vary-with-revenue costs equal 14.5 percent of sales.
4. Record your fixed costs.
To record or estimate your fixed costs, enter the fixed costs amount into cell E20. In Figure 1-1 , for example, fixed costs show as $150,000.
5. Estimate any variable costs that vary with profits.
Here’s one other wrinkle that you may often encounter with real-life profit-volume-cost analysis: variable costs that don’t vary from changes in sales revenue but from changes in profits. Some businesses have profit-sharing plans, for example. Those profits represent variable costs because they vary with changes in sales revenue — sort of. To estimate the profit-sharing costs, you need to first calculate profits and then apply the profit-sharing percentage to those profits. Income taxes — federal, state, and local income taxes — also fall into the category of variable costs that vary not with changes in sales revenue, but with changes in profit.
In the workbook shown in Figure 1-1 , I’ve provided three cells — E23, E24, and E25 — that let you recognize these variable costs. I call this category of variable costs vary-with-profit costs. You can enter the state income tax percentage into cell E23. You can enter the federal income tax percentage into cell E43. And if you have any other vary-with-profit costs, you can enter the sum of these costs as a percentage into cell E25.
I should tell you that vary-with-profit costs are tricky to estimate precisely. The trickiness stems from a couple of factors:
· Many vary-with-profit costs aren’t simply calculated as percentages of profit. The cost calculations are considerably more complicated. Income tax costs, for example, don’t use a single percentage. They often use a schedule of progressive percentages.
· Vary-with-profit costs often interrelate. State income taxes affect federal income taxes, for example. Other vary-with-profit costs may interrelate, too. A profit-sharing percentage may be applied on an after-tax basis, for example. The workbook formulas don’t explicitly recognize any interrelationship between these variables. Therefore, to precisely model these vary-with-profit costs, you must enter percentages that have been fiddled with a bit, as described in the sidebar “Dealing with vary-with-profit costs ,” later in this chapter.
After you collect the needed inputs for the Profit-Volume-Cost Analysis workbook, the workbook estimates a break-even point and prepares a profit volume forecast. The workbook also supplies a couple of useful charts that graphically show the break-even and the profit-volume analysis data. The next sections of this chapter describe these analysis results.
Understanding the break-even analysis
The break-even analysis that the workbook makes based on the inputs that you enter is shown in Figure 1-2 in the worksheet range from B27:E45. The break-even analysis shows the number of units required to break even in cell E28 and the sales revenue required to break even in cell E29. You calculate the total sales revenue required to break even by using the same basic formula described earlier in the chapter. You calculate the volume in units break-even point by dividing the sales revenue break-even point by the unit sales price.
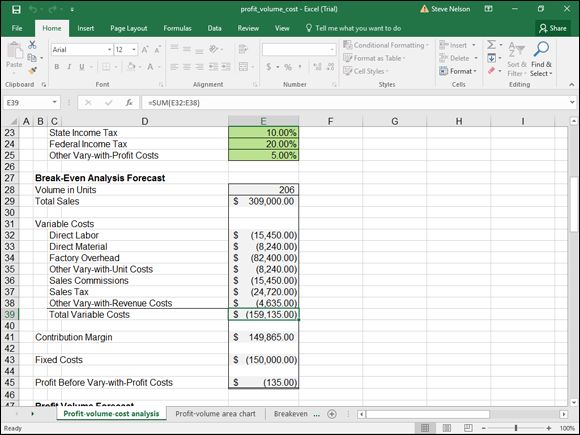
FIGURE 1-2: The Break-Even Analysis Forecast.
The variable costs portion of the break-even analysis shows the amount spent on each of the costs. Cell E32 shows the amount that will be spent on direct labor.
The contribution margin, which is the same thing as gross margin, appears in cell E41. This shows the amount left over from sales revenue after paying the variable costs.
A fixed cost appears in cell E43. By subtracting the fixed costs from the contribution margin, the workbook calculates the break-even point, which should be zero but may not be because of a rounding error. In Figure 1-2 , for example, the profit before vary-with-profit costs value equals -$135.
Although the information shown in Figure 1-2 may seem to be voluminous, you conceptually understand all this data. A little forecast worksheet simply shows the sales revenue and the sales units that produce the break-even point. This worksheet also shows the amounts that you’ll spend on variable costs and fixed costs. Profits equal zero at the break-even point, so there aren’t any vary-with-profit costs.
Understanding the profit-volume-cost forecast
Figure 1-3 shows the miniature income statement at various sales volume levels. Figure 1-4 shows the same information presented not in dollars but in percentages of total sales.
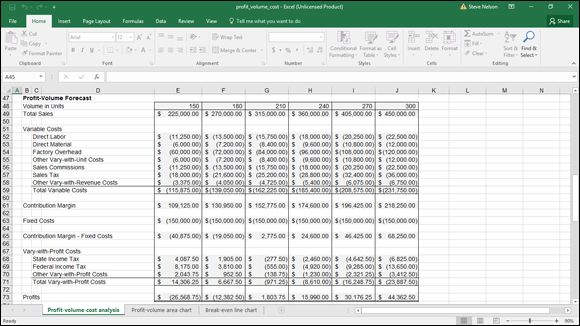
FIGURE 1-3: The Profit-Volume Forecast, in dollars.
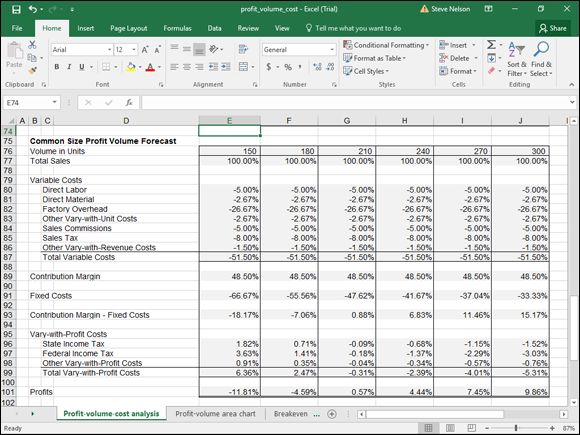
FIGURE 1-4: The Common Size Profit-Volume Forecast.
The Profit-Volume Forecast worksheet, shown in Figure 1-3 , shows the range of sales volume both in revenues and in units that the worksheet calculates. The lowest sales revenue volume and the highest sales revenue volume are set by your input for the low unit volume tested value and the high unit volume tested value. (See the numbers entered into cells E6 and E7 of Figure 1-1 .)
The miniature income statements in the Profit-Volume Forecast look very similar to a typical QuickBooks income statement. The variable-costs portion of the miniature income statement reports on the cost of goods sold. The contribution margin is equivalent to the gross margin reported in a QuickBooks income statement. A fixed cost amount summarizes the operating expenses. The vary-with-profit costs essentially summarize income taxes and other profit-based expenses, such as a profit-sharing plan. Profits equate to the net income.
Figure 1-3 shows a case in which modest changes in sales revenue can often produce huge changes in profits. In Figure 1-3 , column G in the worksheet shows the profit-volume-cost forecast at the sales level equal to $315,000. Column H shows the sales revenue and cost forecast at a sales revenue level of $360,000. As the firm increases its profits by roughly 15 percent (this increase shown in cells G48 and H48), profits increase by almost 900 percent from $1,804 to $15,990 (the change from the values in cells G73 to H73).
You may not be interested in the common-size profit volume forecast shown in Figure 1-4 because this income statement shows percentages based on sales rather than dollar amounts. This figure lets you see what percentage of total sales a cost item represents. Sometimes this information is useful, and sometimes it isn’t. If you aren’t interested in the information, simply select rows 75-101 and then delete them from your workbook.
Looking at the profit-volume-cost charts
For fun, I include a couple of simple charts that show results from the profit-volume-cost analysis. Figure 1-5 , for example, shows the break-even line chart. This line chart plots the total fixed costs, the total variable costs, and then the total sales. The intersection of the total sales line and the total fixed costs line shows the break-even point. By comparing the slopes of the total sales and the variable costs line, you can get an idea of how sensitive the profits are to changes in sales revenue. If you have a good eye, you can even use the break-even line chart to roughly estimate the profit at various revenue levels. To do this, find the point on the total sales line equal to the sales revenue level for which you want to guesstimate profits. Then use the value axis (the vertical axis on the left side of the chart) to calibrate the difference between the total sales line and the total variable costs line. The difference between these two lines shows your profit or loss.
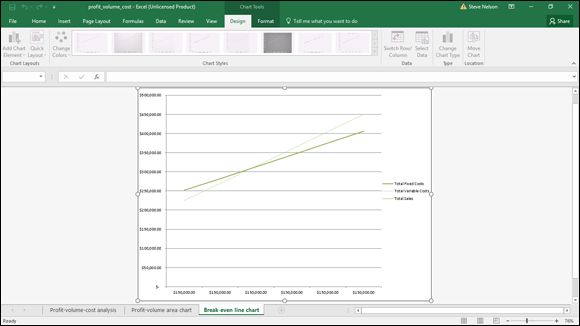
FIGURE 1-5: The break-even line chart.
The total variable costs line actually shows the total variable costs plus the total fixed costs because it’s stacked on top of the fixed costs line.
Figure 1-6 shows the profit-volume-cost data from the worksheet. This analysis is more complicated, so the chart is a bit trickier to interpret. Nevertheless, the chart resembles the break-even line chart. Fixed costs appear as a dark green band equal to $150,000 at the bottom of the graph. Variable costs appear as a sort of trapezoidal shape on top of the fixed costs. Above those costs appear the costs that vary with profits and the actual profit. Note that profits occur only after the firm exceeds the break-even point. (The data labels on the horizontal axis represent the different volumes being tested.)
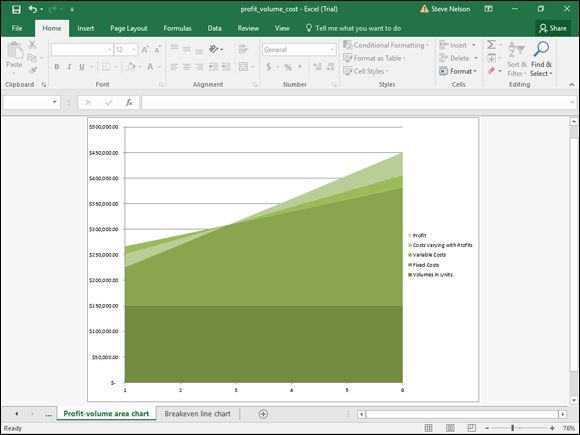
FIGURE 1-6: The profit-volume-cost analysis area chart.
You want to grab a working copy of the profit_volume_cost.xlsx workbook if you’re at all interested in this stuff. The chart’s colors simply don’t reproduce well in grayscale images on the page of a book.
The data plotted in the charts shown in Figures 1-5 and 1-6 comes from the worksheet range shown in Figure 1-7 . I collected all the data to be plotted in this area of the worksheet, which is below the profit volume forecast and common-size profit volume forecast to make it easy to see what data is plotted and where the data is coming from.
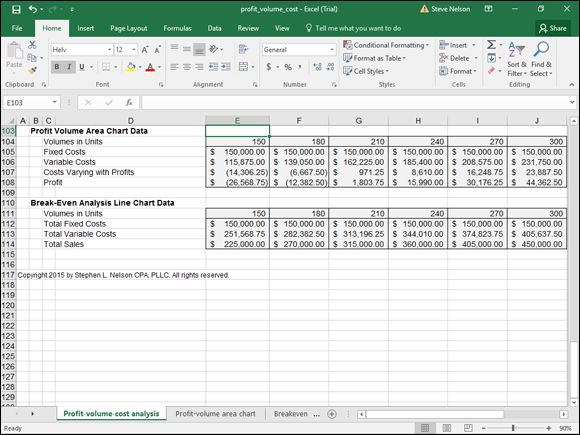
FIGURE 1-7: These cells supply the chart data.
DEALING WITH VARY-WITH-PROFIT COSTS
If your profit-volume-cost analysis includes more than a single vary-with-profit cost, you must deal with the possibility that your vary-with-profit costs are interrelated. In fact, vary-with-profit costs can have one of three relationships: independent-independent, independent-dependent, or dependent-dependent.
The independent-independent relationship is the easiest to deal with. If two vary-with-profit costs are independent, you can just enter the percentages into the appropriate workbook cells and not worry about them. An independent-independent relationship exists when vary-with-profit costs have no effect on each other. A partnership, for example, may have two profit-sharing plans — one for partners and one for employees — that aren’t related.
A slightly more complicated relationship between vary-with-profit costs is the case of an independent-dependent relationship. A good example of an independent-dependent relationship is the relationship of state and federal income taxes. Because federal income taxes allow for a deduction based on state income taxes, the federal income tax expense depends on the state income tax expense. If the federal income tax percent equals 20 percent, and the state income tax percent equals 10 percent, you can’t simply enter the state income tax as 10 percent and the federal income tax as 20 percent. You need to adjust the federal income tax percentage for the effect of the state income tax.
Suppose that the state income tax rate is 10 percent of the pre-tax profits and that after the state income tax is deducted from the pre-tax profits, the federal income tax rate is 20 percent of what’s left over. The correct input percentage for the state income tax rate is 10 percent, because 10 percent of the pre-tax profits calculates the correct state income tax cost, as follows:
State income tax = 10 percent × pre-tax profits
The federal income tax percentage, however, must recognize the state income tax costs:
Federal income tax = 20 percent × (pre-tax profits - (10 percent × pretax profits))
This formula can be further modified to express the federal income tax rate as a percentage of the pre-tax profits. Therefore, you input the following into the Profit-Volume-Cost Analysis workbook:
Federal income tax = 18 percent × pre-tax profits
A third type of relationship is the dependent-dependent relationship. This relationship occurs when one vary-with-profit cost affects another vary-with-profit cost. In the case of a typical employee profit-sharing plan, in which profits are based on after-tax profits, you need to know the profit-sharing plan expense to calculate the federal income taxes. The profit-sharing plan expense is deductible for purposes of calculating federal income taxes, but you must know the federal income tax expense to calculate the after-tax profits on which the profit-sharing plan is based. In cases of dependent-dependent relationships among vary-with-profit costs, you can calculate percentages that in effect adjust for the dependency. To do this, you need to employ a fair amount of high-school algebra.
All materials on the site are licensed Creative Commons Attribution-Sharealike 3.0 Unported CC BY-SA 3.0 & GNU Free Documentation License (GFDL)
If you are the copyright holder of any material contained on our site and intend to remove it, please contact our site administrator for approval.
© 2016-2026 All site design rights belong to S.Y.A.