Product Details Lean Enterprise: How High Performance Organizations Innovate at Scale (2015)
Part II. Explore
The best lack all conviction, while the worst / Are full of passionate intensity.
W. B. Yeats
When faced with a new opportunity or a problem to be solved, our human instinct is to jump straight to a solution without adequately exploring the problem space, testing the assumptions inherent in the proposed solution, or challenging ourselves to validate the solution with real users.
We can see this instinct at work when we design new products, add new features to existing products, address process and organizational problems, begin projects, or replace existing systems. It is the force that leads us towards buying expensive tools that purport to solve all of our use cases, rolling out a new methodology or organizational refresh across the whole company, or investing in “bet the company” programs of work.
Worse, we often fall in love with our own solutions, and then fall prey to the sunk cost fallacy when we ignore evidence that should cause us to question whether we should continue to pursue them. When combined with a position of power, these forces can have catastrophic consequences—one of our colleagues was nearly fired by a client for having the temerity to ask about the business case behind a particular project.
If we had one superpower, it would be to magically appear whenever a problem or new opportunity was under discussion. Our mission would be to prevent anybody from commencing a major program to solve the problem or pursue the opportunity until they do the following:
§ Define the measurable business outcome to be achieved
§ Build the smallest possible prototype capable of demonstrating measurable progress towards that outcome
§ Demonstrate that the proposed solution actually provides value to the audience it is designed for
Since we are only mortal, we trust that you will keep a copy of this book to hand to wield at the appropriate moment.
In this part, we discuss how to explore opportunities and problem spaces by taking a scientific and systematic approach to problem solving. By taking an experimental approach, we can effectively manage the risks and enable teams to make better decisions and judgements under the uncertainty that is inherent in innovation.
Chapter 3. Model and Measure Investment Risk
Doubt is not a pleasant condition, but certainty is absurd.
Voltaire
For enterprises experimenting with new business models and products, as for startups, the biggest risk is a failure to create something that actually delivers value to users. The Lean Startup framework allows us to rapidly discard ideas that do not deliver value or will not be adopted sufficiently quickly so we don’t waste our resources on them. However, the principles behind the Lean Startup can be applied to all kinds of activities within the enterprise, such as building internal tools, process improvement, organizational change, systems replacement, and GRC (governance, risk, and compliance) programs.
In this chapter we present the principles and concepts that enable us to take a systematic approach to managing the risk of planned work, by gathering information to reduce uncertainty. This framework forms the basis of a practical approach to exploring new opportunities we present throughout the rest of Part II.
Model Investment Risk
Typically in enterprises we must build a business case along with a plan to support it before we can get approval to proceed. This usually involves a team of people creating a detailed document that estimates the value the proposed initiative will create. The business case describes the required resources, dependencies, and finally a beautifully crafted set of numbers detailing the planned work with costs, key metrics, a resource plan, and timeframes. Depending on the level of detail and the estimated investment required, this process can take weeks or months to complete.
An important goal of the planning process is to support an investment decision. In order to make this decision, we need to have a good understanding of the risks involved with the investment. Following Douglas Hubbard, we define risk as “a state of uncertainty where some of the possibilities involve a loss, catastrophe, or other undesirable outcome,” and the measurement of risk as “a set of possibilities, each with quantified probabilities and quantified losses.”52 For example, “We believe there is a 50% chance the project will be cancelled, with a loss of $2m in development work.”
In How to Measure Anything, Hubbard discusses his work analyzing business cases for IT investments:53
Each of these business cases had 40 to 80 variables, such as initial development costs, adoption rate, productivity improvement, revenue growth, and so on. For each of these cases, I ran a macro in Excel that computed the information value for each variable. I used this value to figure out where to focus measurement efforts. When I ran the macro that computed the value of information for each of these variables, I began to see this pattern: 1) The vast majority of variables had an information value of zero…2) The variables that had high information values were routinely those that the client never measured. 3) The variables that clients used to spend the most time measuring were usually those with a very low…information value.
Take the example of estimating development costs in order to put together business cases to obtain project approval. This usually involves analyzing months’ worth of future work, breaking it into small pieces, and estimating the effort required for each piece. However, as Hubbard notes, “Even in projects with very uncertain development costs, we haven’t found that those costs have a significant information value for the investment decision…The single most important unknown is whether the project will be canceled…The next most important variable is utilization of the system, including how quickly the system rolls out and whether some people will use it at all.”54
Thus the business case essentially becomes a science fiction novel based in an universe that is poorly understood—or which may not even exist! Meanwhile significant time is wasted on detailed planning, analysis, and estimation, which provides large amounts of information with extremely limited value. According to research by Donald Reinertsen, author of The Principles of Product Development Flow: Second Generation Lean Product Development,55 it’s typical for 50% of total product development time to be spent in such “fuzzy front end” activities. Naturally, this leads to poor investment decisions and needlessly long product development cycles. This creates multiple negative outcomes:
§ Long product development cycles dramatically reduce the potential return on investment we can achieve from successful new products.
§ Most perniciously, long development cycles delay the time it takes to get customer feedback on whether we are building something valuable.
§ Typical market research activities are poor at predicting a product/market fit, especially in new product categories. Research said that minivans and iPods would not be successful.
§ In the absence of good data, people tend to get their pet projects funded. Particularly in enterprise IT, we often see spectacular amounts of money poured down the drain on systems replacement projects—even (perhaps especially?) in organizations operating in highly regulated sectors.
There are two factors we care about in a business plan. The first is the sensitivity of the key metric to the various variables in the business case. The second is the level of uncertainty in the variables to which the key metric is sensitive. Given distributions and ranges for the key variables, a simple but powerful approach is to perform a Monte Carlo simulation to work out the possible outcomes. This will allow us to find the variables to which we need to pay attention in order to make good investment decisions.
To run a Monte Carlo simulation, we use a computer to create thousands of randomized scenarios based on the distribution shape and ranges for the input variables, and then compute the value of the metric we are interested in for each scenario. The output of a Monte Carlo simulation is a histogram, with the number of scenarios for each range on the y-axis, and the ranges on the x-axis. You can perform a Monte Carlo simulation using Excel, or use one of a number of existing custom tools.56 The output of a Monte Carlo simulation for a business case might look something likeFigure 3-1. As Hubbard notes, the uncertainty in ROI for IT programs tends to be very high and increases with the duration of the program.
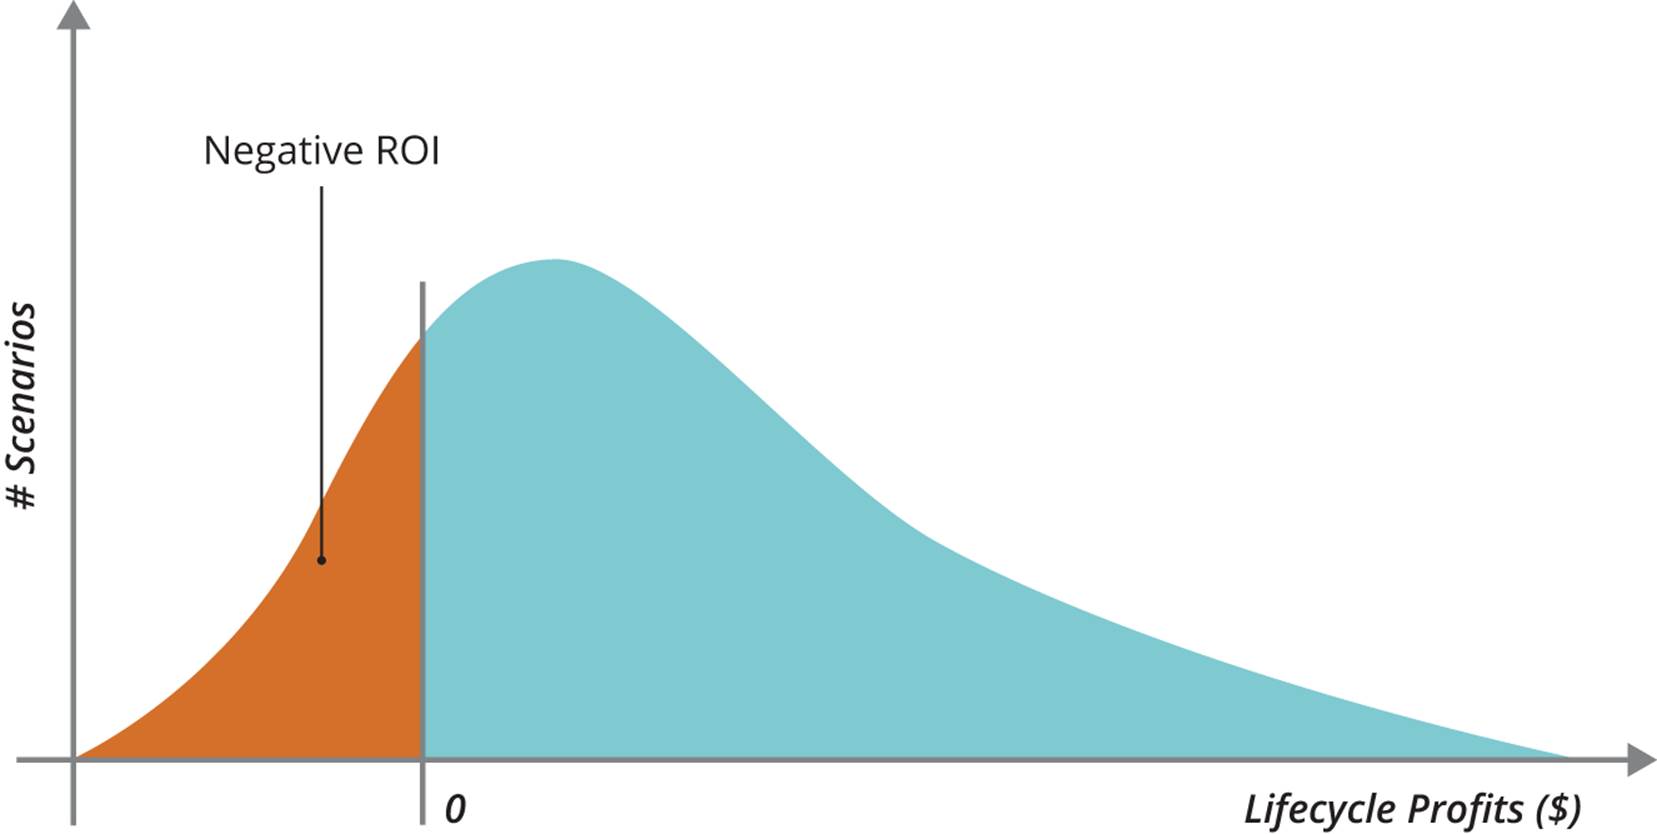
Figure 3-1. Output of a Monte Carlo simulation
As you can verify by doing a Monte Carlo simulation on your own business cases, ROI in IT programs is not very sensitive to cost, but rather to whether the program will be cancelled and to the utilization of the resulting system. These variables depend primarily on whether we have built the right thing. However, the standard enterprise planning process provides almost no validation of this.
Let us be absolutely clear. In most enterprises, around 30%-50% of the total time to market is spent on activity which provides almost zero value in terms of mitigating the risks of our investments. This near-zero-value activity is mostly driven by financial management and planning processes. In our experience, the fuzzy front end presents the biggest opportunity for radical process improvement (kaikaku) in enterprises. We can drastically reduce the required time, and make better decisions, by taking a systematic approach to risk management. In this chapter, we discuss how to attack the fuzzy front end for new businesses and new products. In Chapter 7, we show how to change the way program-level feature backlogs are managed.
Applying the Scientific Method to Product Development
The way the world tells you whether what you are doing is valuable is whether they send you money.
Donald Reinertsen
When there is a large amount of uncertainty in the key metric we care about, we begin by identifying the variables with the highest information value—the riskiest assumptions. These are the ones to which our outcome metric is most sensitive. In the case of both business model innovation and product development, Donald Reinertsen comments that “unit sales are where the bodies are buried.”
The most inefficient way to test a business model or product idea is to plan and build a complete product to see whether the predicted market for it really exists. Yet this is exactly what we do once we have an approved business case. Part of the problem is the language we use to describe the product development process. For example, consider the term “requirements.” Whose requirements are they? Are they user requirements? In Lean IT, Steve Bell and Mike Orzen comment that “users are often unable to articulate exactly what they need, yet they often seem insistent about what they don’t want…once they see it.”57
We should stop using the word “requirements” in product development, at least in the context of nontrivial features. What we have, rather, are hypotheses. We believe that a particular business model, or product, or feature, will prove valuable to customers. But we must test our assumptions. We can take a scientific approach to testing these assumptions by running experiments.
In the case of business model and product innovation, the Lean Startup movement provides us with a framework for operating in conditions of extreme uncertainty. In Running Lean (O’Reilly), Ash Maurya explains how to execute a Lean Startup model:
§ Do not spend a lot of time creating a sophisticated business model. Instead, design a simplified business model canvas which captures and communicates the key operating assumptions of your proposed business model.
§ Gather information to determine if you have a problem worth solving—meaning that it is both solvable and people will pay for it to be solved. If both of these conditions obtain, we have achieved a problem/solution fit.
§ Then, design a minimum viable product (MVP)—an experiment designed to maximize learning from potential early adopters with minimum effort. In the likely case that the results of the MVP invalidate your product hypothesis, pivot and start again. Continue this process until you decide to abandon the initial problem, run out of resources, or discover a product/market fit. In the latter case, exit the explore phase and proceed to exploit the validated model.
§ Throughout this process, update the business model canvas based on what you learn from talking to customers and testing MVPs.
We present this approach in detail in Chapter 4.
There are two key innovations in this model. First, we stop using detailed planning as a way to manage risk. Instead, we find customers and run cheap experiments to discover if our proposed business model or product is actually valuable to them. Second, rather than creating only one plan, we iterate by running a series of experiments in order to discover a product/market fit, since we expect that in conditions of uncertainty our first idea is very unlikely to bear fruit.
A common objection to these principles is that such experiments cannot possibly be representative of a complete product. This objection is based on a false understanding of measurement. The purpose of measurement is not to gain certainty but to reduce uncertainty. The job of an experiment is to gather observations that quantitatively reduce uncertainty.58 The key principle to bear in mind is this: when the level of uncertainty of some variable is high, we need very little information to significantly reduce that uncertainty.
DEFINITION OF MEASUREMENT
Measurement: A quantitively expressed reduction of uncertainty based on one or more observations.59
This definition may seem counterintuitive unless you have experience running experiments in a scientific context. In experimental science, the result of a measurement is never simply a single value. It is, rather, a probability distribution which represents the range of possible values, as shown in Figure 3-2. Any measurement that doesn’t indicate the precision of the result is considered practically meaningless. For example, a measurement of my position with a precision of 1 meter is far more valuable than that same position with a precision of 500 miles. The point of investing in measurement in a scientific context is to reduce our uncertainty about the actual value of some quantity. Thus, in particular, if we express our estimates as precise numbers (as opposed to ranges), we are setting ourselves up for failure: the chance of us meeting a date 6 months in the future precisely to the day is practically zero.
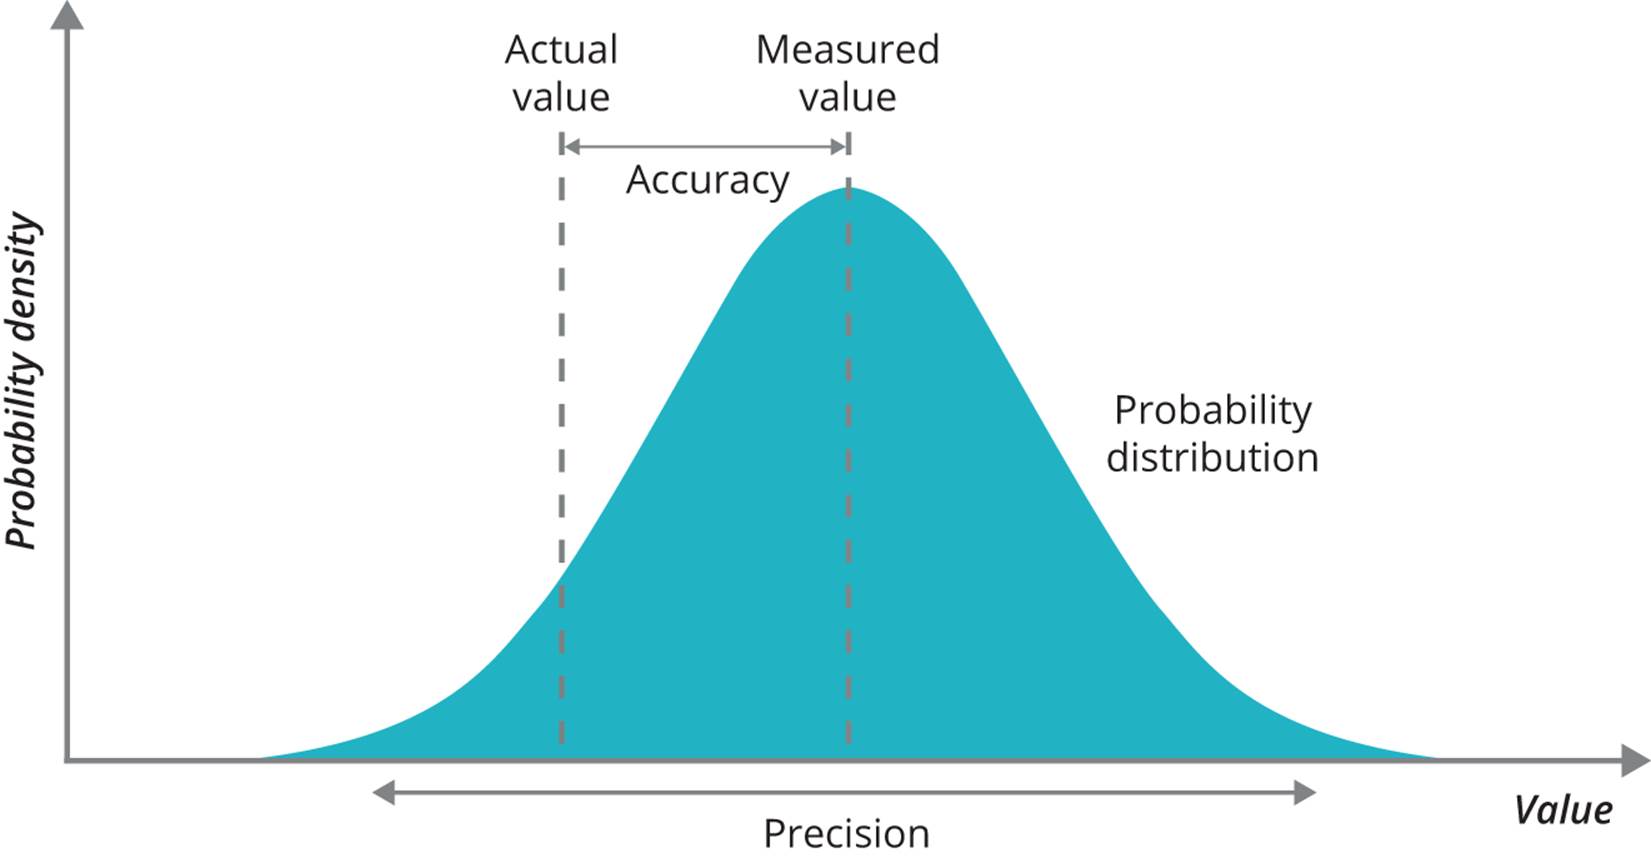
Figure 3-2. Accuracy and precision
A minimum viable product can be thought of as a way to conduct a relatively cheap measurement so as to reduce our uncertainty concerning our key metric. This is what makes an MVP such a good investment. Typically, putting together a business plan and requirements for a significant initiative takes weeks or months in an enterprise context. In the same amount of time, by following the Lean Startup model, we could run multiple experiments, learn from real customers, and emerge with a superior, battle-tested plan based on evidence. Let’s examine the differences between these two approaches when we need to make an investment decision, as show in Table 3-1.
|
Traditional project-planning process |
Lean Startup discovery process |
|
|
What data do we have to make the investment decision? |
A business plan based on a set of untested hypotheses and assumptions, backed by case studies and market research. |
Real data based on evidence compiled from a working product or service tested with real customers. |
|
What happens next? |
We must create detailed requirements, if we haven’t already, and then start a project to build, integrate, test, and finally release the system. |
We already have a validated MVP which we can build upon immediately with new features and enhancements based on customer feedback. |
|
When do we find out if the idea is any good (i.e., will it get a good return on investment)? |
Once the project is complete and the product or service is live. |
We already have this evidence based on the data we have collected. |
|
Table 3-1. Traditional product lifecycle versus Lean Startup lifecycle |
||
As discussed in Chapter 2, an important factor in the success of the Lean Startup approach is to limit the size of the explore team and the resources available to them (including time). This encourages people to apply their creativity and focus on learning rather than pursuing “perfect” solutions. There are no awards for elegance of software design or automated test coverage in an MVP—the more skeletal, the better, provided we can gather the information we need. Many of the “war stories” exchanged by Lean Startup practitioners describe the ingenious shortcuts they took in the pursuit of validated learning.
Of course a reasonable question is: given that product development is effectively a form of discovery, how much time and money should we spend on validated learning? Game theory actually provides a formula for the expected value of information (EVI). A detailed discussion of how to calculate this number is beyond the scope of this book, but it is covered in Hubbard’s How to Measure Anything.60 The EVI gives us an upper bound on how much we should be prepared to pay to gather the information in question. If the cost of performing a measurement is much less than the EVI (say, an order of magnitude less), it is clearly worth performing the measurement. Thus, the more risky and expensive the project in question, the more value you get for your money by pursuing a Lean Startup approach.
EXPECTED VALUE OF INFORMATION
Hubbard defines the value of information as follows: “Roughly put, the value of information equals the chance of being wrong times the cost of being wrong. The cost of being wrong—that is, what is lost if your decision doesn’t work out—is called an opportunity loss. For a simplistic example, say you’re considering investing $1 million in a new system. It promises a net $3 million gain over three years. (For our example’s sake, it’ll either be completely successful or a total bomb.) If you invest but the system fails, your mistake costs you $1 million. If you decide not to invest and you should have, the mistake costs you $3 million. When we multiply the opportunity loss by the chance of a loss, we get the expected opportunity loss (EOL). Calculating the value of information boils down to determining how much it will reduce EOL.”61
In reality, the success of a product is rarely a binary outcome. If we return to the example of the predicted ROI for a business case illustrated in Figure 3-1, we get the EOL by calculating the area of the shaded part of the curve, which represents the scenarios in which we lose money on our investment. In other words, we sum up the ROI at each point multiplied by the probability of that outcome. Assuming we had perfect information on the exact outcome in ROI, that could potentially be worth as much as the EOL we have just calculated. Since an MVP will typically provide less than perfect information, the EOL represents an upper bound on what we should spend on the runway for discovering a product/market fit.62
APPLYING THE LEAN STARTUP APPROACH INTERNALLY WITHIN ENTERPRISES
The Lean Startup model isn’t limited to new product development. It can be used for any kind of new work in an enterprise context, including systems replacement, building internal tools and products, process innovation, and evaluating commercial off-the-shelf software (COTS). In all cases, we begin by stating the measurable customer outcome that we wish to achieve. We can define our goal in terms of our immediate downstream customer, such as our colleague who will use the tool, process, or COTS. For example, for an internal test automation tool, we might aim to reduce the lead time for full regression testing to 8 hours.
To determine if we have a problem/solution fit, we look for a customer willing to work with us to pilot the new system, tool, process, or software. This is a critical step which is often skipped by enterprises. Indeed for internal tools it’s common to mandate their use—a disastrous policy which often results in enormous amounts of waste, unhappy users, and little value to the organization. The process of finding customers and figuring out a real problem they will pay you to solve (even if the payment takes the form of time and feedback rather than money)—thereby obtaining a problem/solution fit—is essential to developing internal tools, purchasing COTS, or internal systems replacement. Mandating the use of a particular solution makes it much harder to gather feedback on whether that solution actually provides value.
Once we have a pilot team, we design and execute a minimum viable product. This may be a prototype of a tool designed to help just one team, or an implementation of a COTS package to solve a problem for just one team or for a single business process for that team. The hardest part here is to limit scope so as to solve a real problem but deliver something in the space of days or weeks, rather than months. The worst thing we can do is disappear to design the perfect tool or adoption strategy, without continually delivering value to real users and gathering feedback from them throughout the process. It’s essential to be disciplined about time-boxing this activity and to focus on solving a real and an urgent problem as soon as possible.
The measure of success—and whether or not we should proceed—is whether our users find the MVP good enough to use of their own free will and whether we actually meet the measurable customer outcome we set out to achieve. If not, we need to pivot and return to the beginning.
Principles for Exploration
In Chapter 1, we showed how small, highly motivated forces were able to defeat larger, better trained enemies through a style of war known as maneuver warfare. “Disruption” is a word that is currently ubiquitous to the point of cliché, but in the context of maneuver warfare, the chief exponent of the idea of disrupting your opponent’s decision-making process was Colonel John Boyd of the US Air Force. In his career as a fighter pilot and instructor, Boyd was famous for never losing his bet that he could win any dogfight—from a position of disadvantage—within 40 seconds, and also for co-creating the energy-maneuverability theory of aircraft performance that led to the design of the F-16 fighter jet. However, his best-known creation is the “OODA loop,” a model (shown in Figure 3-3) of how humans interact with their environment which forms the basis of Boyd’s theory of maneuver warfare. OODA stands for observe, orient, decide, act, the four activities that comprise the loop.
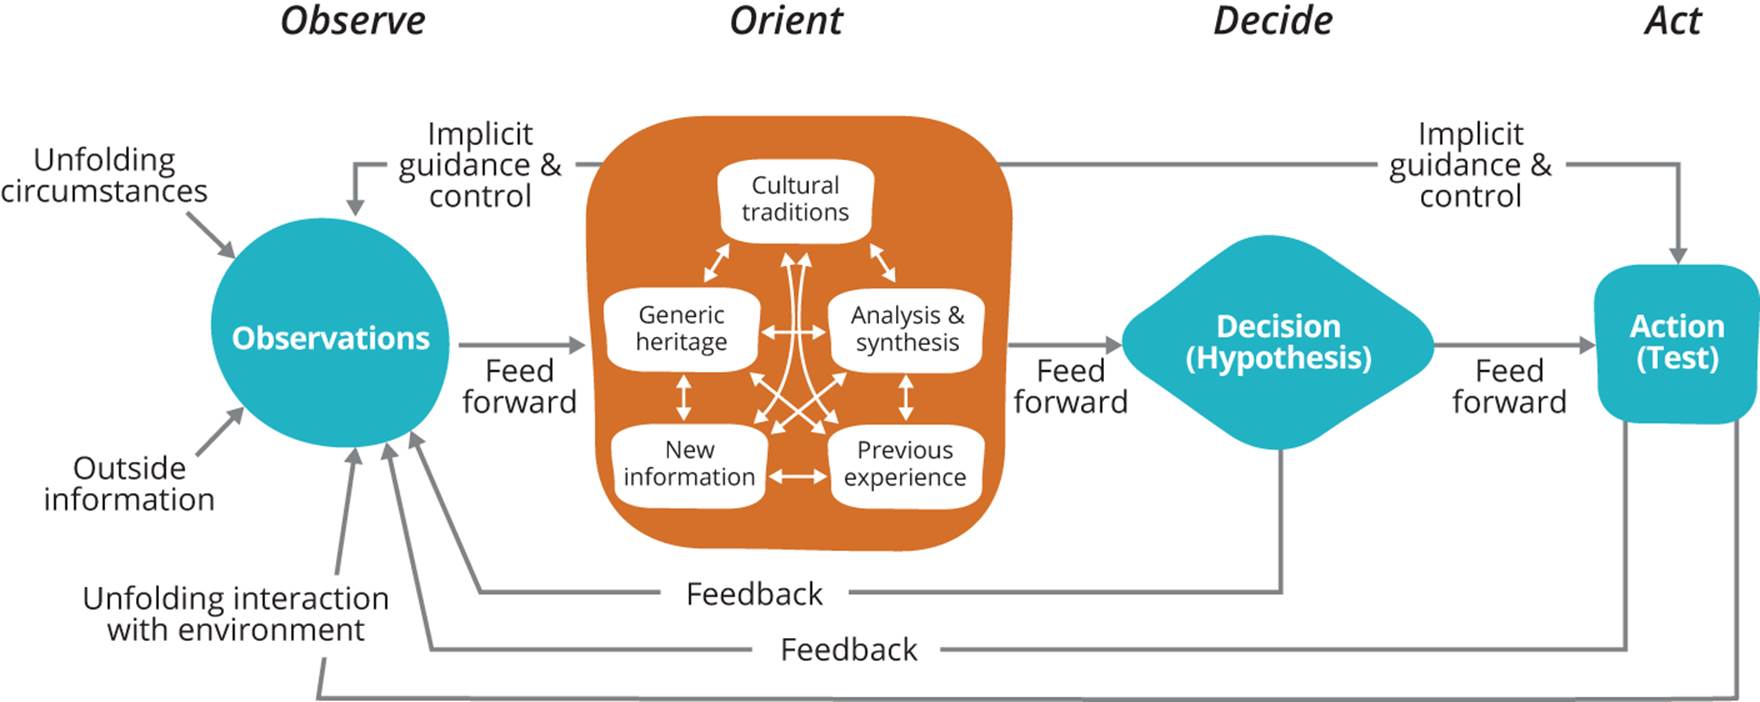
Figure 3-3. The OODA loop
A common misconception (primarily by people who have not actually seen the diagram) is that these activities are carried out one after the other in a loop, and that disruption is achieved by going through the cycle faster than your opponent. There are two important flaws with this interpretation. First, in reality both humans and organizations are performing all of these activities simultaneously, and there are multiple feedback and feed-forward loops between each of them. Second, it is often advantageous to delay making decisions until the “last responsible moment” (which we can analyze using optionality and Cost of Delay, see Chapter 7).
To truly understand the diagram, we must start with orientation. Boyd’s insight here is that our observations, decisions, and actions are all contingent upon our current orientation, which is in turn determined by a complex series of factors including our genetics, our habits and experiences, and the cultures within which we grew up and are currently operating, as well as the information we have to hand. The second thing to note about the diagram is that there are two mechanisms of influence: one is the feedback and feed-forward loops, and the other is “implicit guidance and control.”
Psychology tells us that our actions can be shaped either by IGT (implicit guidance and control) or by feed-forward from a conscious decision. Implicit guidance and control in humans is provided by a system in the mind, called System 1, which “operates automatically and quickly, with little or no effort and no sense of voluntary control.” Conscious decisions are made by System 2 which “allocates attention to the effortful mental activities that demand it, including complex computations. The operations of System 2 are often associated with the subjective experience of agency, choice, and concentration.”63 Equally, IGT affects how we observe things, for example our tendency to ignore information that contradicts our beliefs (this is known as confirmation bias).
Both of these mechanisms exist at the organizational level. In terms of action, organizations use the implicit guidance and control mechanism when they delegate decision-making using decentralized command and the Principle of Mission, relying on a shared understanding of their goals along with alignment across the organization to ensure that people act in the interests of the wider organization. However, some actions (particularly those involving compliance) must be taken using the explicit feed-forward mechanism.
Implicit guidance and control also govern how organizations observe. Generative cultures create monitoring systems and visible displays that enable people throughout the organization to rapidly access relevant information—which, in turn, changes their orientation. Changes in orientationwill cause us to update what we measure and how information flows through the organization. In pathological and bureaucratic organizational cultures, measurement is used as a form of control, and people hide information that challenges existing rules, strategies, and power structures. As Deming said, “whenever there is fear, you get the wrong numbers.”
When Boyd talks about “operating inside” an opponent’s OODA loop, he means understanding our opponent’s loop and how it determines their actions. Then you can use that knowledge against them:
The basic pattern is simple: An organization uses its better understanding of—clearer awareness of—the unfolding situation to set up its opponent by employing actions that fit with the opponent’s expectations, which Boyd, following Sun Tzu, called the zheng. When the organization senses (viz. from its previous experiences, including training) that the time is ripe, it springs the qi, the unexpected, extremely rapidly. The primary reason for implicit guidance when engaged with opponents is that explicit instructions—written orders, for example—would take too much time. As Boyd put it, “The key idea is to emphasize implicit over explicit in order to gain a favorable mismatch in friction and time (i.e., ours lower than any adversary’s) for superiority in shaping and adapting to circumstances.”64
The OODA model can also be applied in the context of customer engagement: “Instead of surprise → shock → exploitation, as in war and the martial arts, zheng/qi could operate as something more like surprise → delight → fascination → become more committed customers. Apple plays this game, the ‘pursuit of wow!’ as Tom Peters once described it, very well.”65
Boyd refers to the implicit guidance and control pathways within an organization, determined by its culture and existing institutional knowledge and processes, as its repertoire. We have discussed how organizations apply their existing repertoire to disrupt competitors, but in order to improve performance and avoid disruption, we must be constantly creating new repertoire of our own. This can take the form of process improvement, evolution of existing products, or creation of new businesses and new products. This loop is also represented in the OODA model, as shown inFigure 3-4.
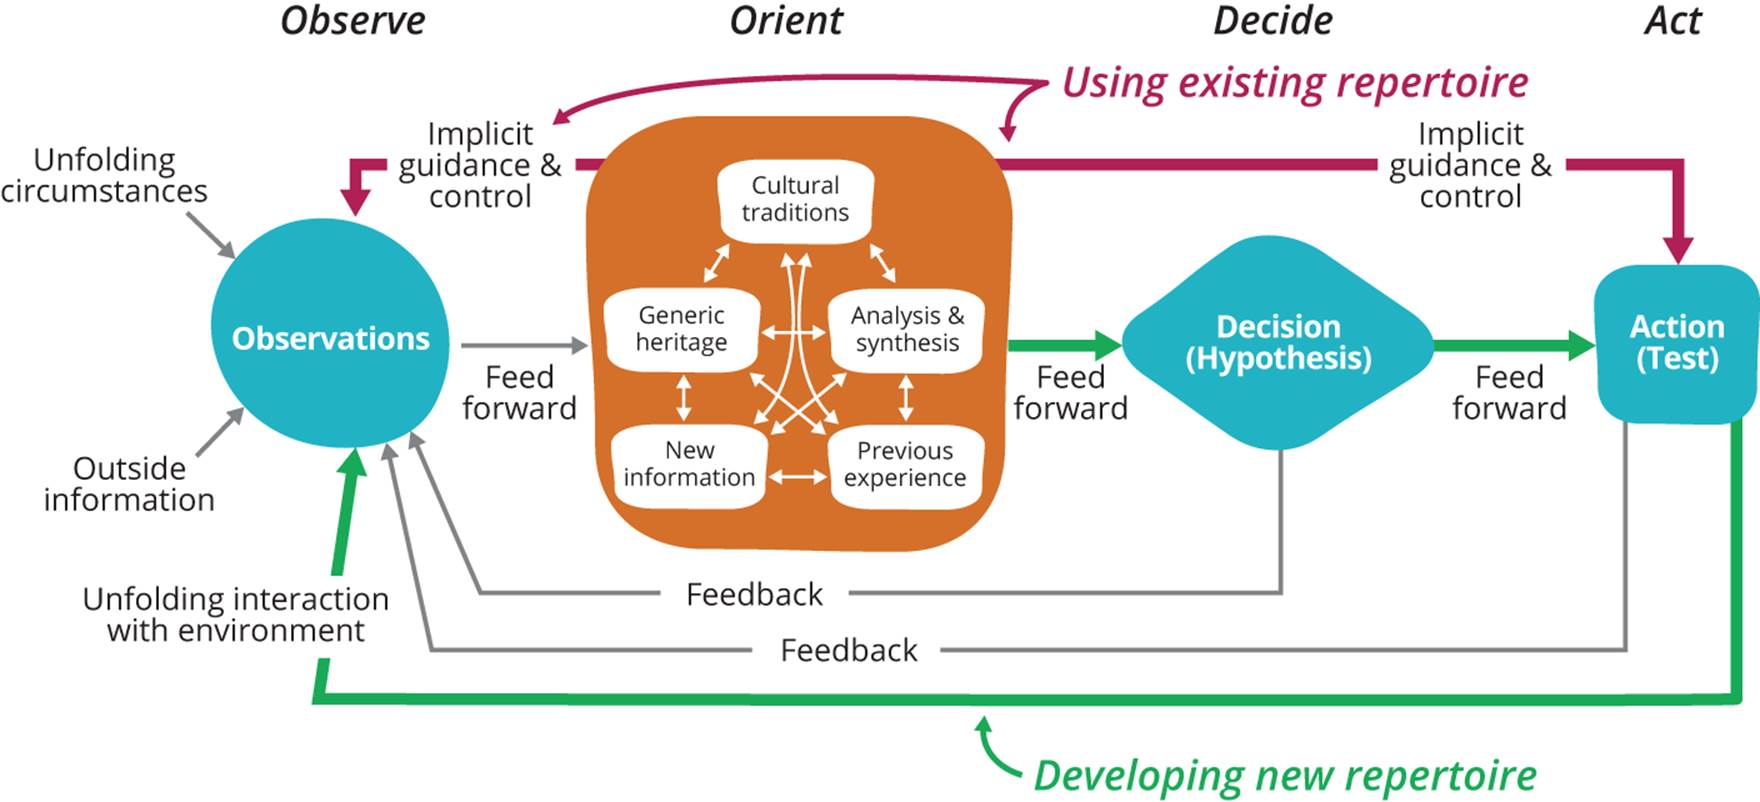
Figure 3-4. Creating new repertoire
The repertoire generation loop is more or less a statement of the scientific method, in which we create new hypotheses based on observation and synthesis, design experiments to test these hypotheses, and then update or discard our theories (which form part of our orientation) based on the results of the experiment. This loop, in turn, inspired Eric Ries’ build-measure-learn loop (Figure 2-4) which shows how to create new repertoire in the form of new business models, products, and features. The build-measure-learn loop seems straightforward, but is hard to adopt in practice due to its combination of a scientific approach (building to learn) with an engineering mindset (learning to build).
For process improvement (discussed in Chapter 6) and for changing organizational culture (discussed in Chapter 11), we can use a loop known as the Deming cycle, shown in Figure 3-5.
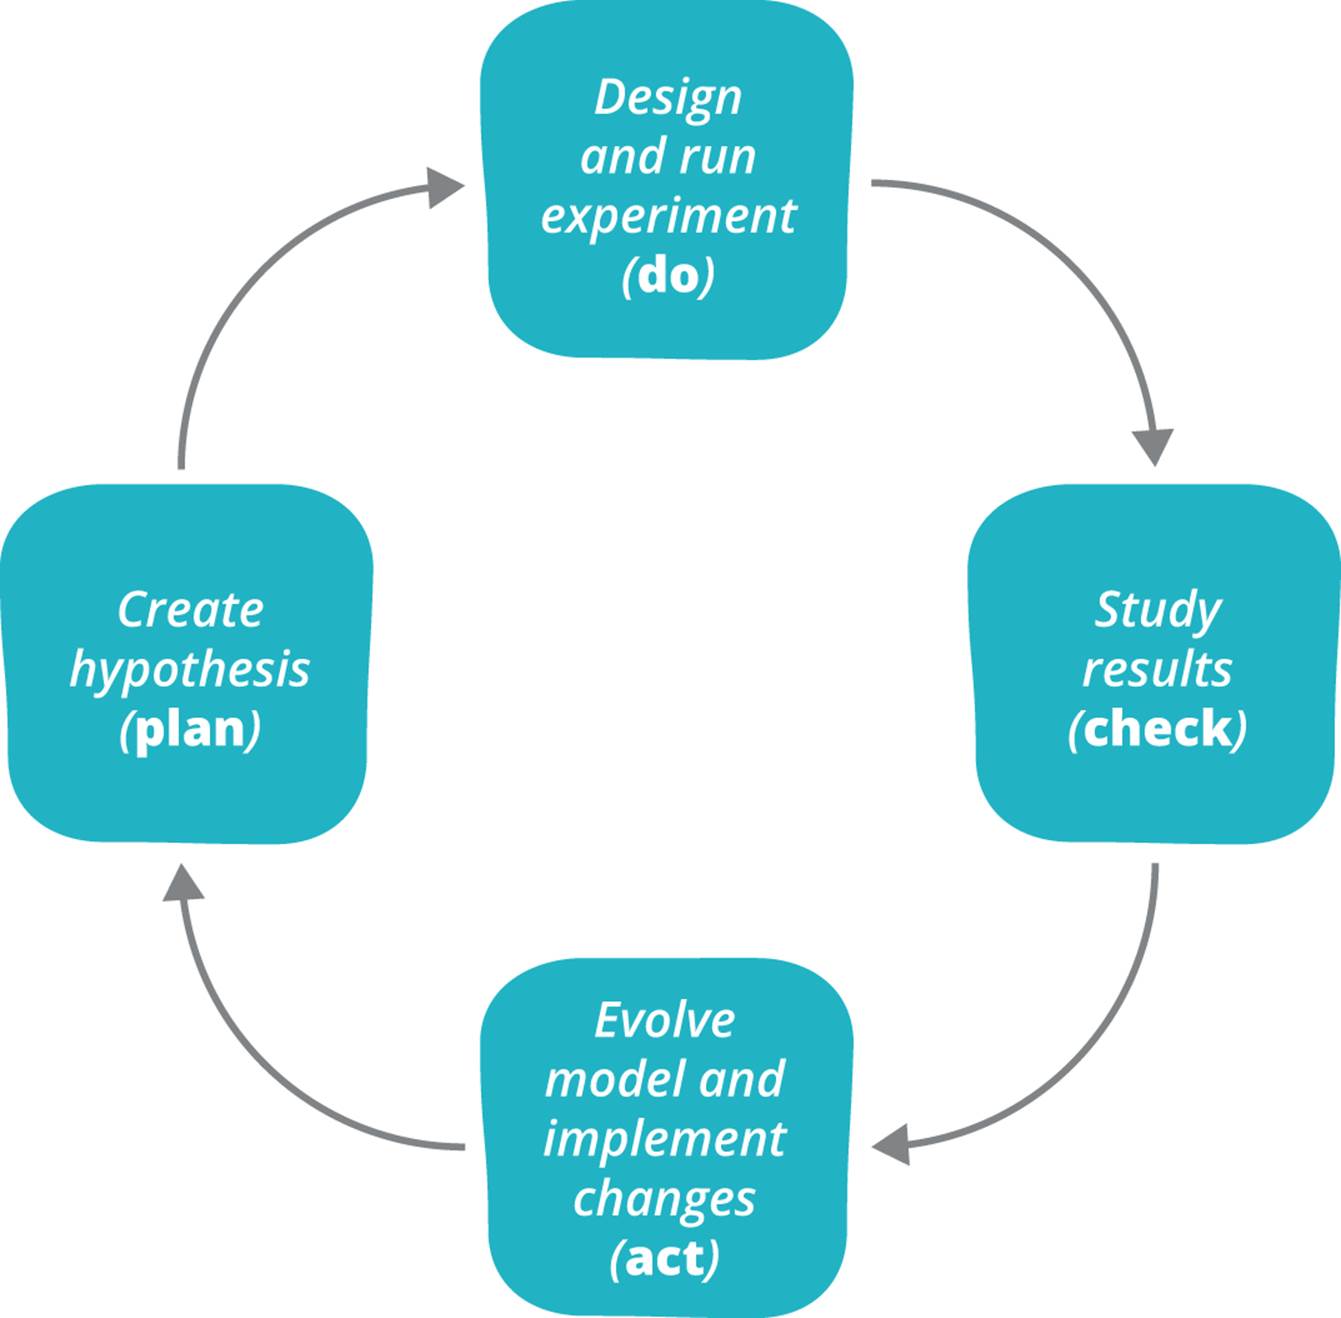
Figure 3-5. The Deming cycle
The key to being successful with these cycles (and the scientific method in general) is to use them systematically and continuously. Applying them systematically means using them as a general tool to explore all types of risk, ensuring that the expense of running an experiment is commensurate with the value of the information we will discover. Applying them continuously means doing it as often as possible (as Mike Roberts says, “Continuous means much more often than you think”), with a focus on getting through the loop in the shortest possible time. The most important question to ask in the context of repertoire generation is: how fast can we learn? While we may not immediately release the results of our learning exercises to the wider world—when to launch your product is a matter of strategy—we should learn and test our assumptions with real users as frequently as possible.
When everybody in the organization has been trained to employ the scientific approach to innovation as part of their daily work, we will have created a generative culture. We achieve this by practicing the experimental approach until it becomes habitual, part of our repertoire, using the Improvement Kata described in Chapter 6. That is what allows an organization to adapt rapidly to its changing environment. Toyota calls this “building people before building cars.”66
Scientific Management Versus the Scientific Method
It’s essential to distinguish between Taylor’s scientific management, discussed in Chapter 1, and the experimental approach we describe here. In scientific management, analysis is performed and decisions are taken by management, with the people who do the work functioning more or less as automatons. In the experimental approach, the job of leadership and management is to design, evolve, and operate a system in which the people doing the work have the necessary skills and resources to run their own experiments, thus individually and collectively learning, developing, and growing their knowledge.
As shown in Table 3-2, applying the scientific method to product development is fundamentally different from the traditional plan-based approach and requires different skills and behaviors. It is not that the traditional project lifecycle is bad—it can be effective in projects where the thing to be built has been built many times before and the risks are well understood. But traditional project management is the wrong model for conditions of uncertainty, such as new product development or any kind of custom software development.
|
Skill or behavior |
Traditional planning approach |
Experimental approach |
|
Changes to the plan |
Changes to the plan once it has been agreed upon are considered problematic and indicate a failure in the process. |
We expect that the initial plan will not survive contact with real customers, and aim to invalidate it and pivot as quickly as possible. |
|
Skills required |
Requirements gathering, analysis, determination of costs, resource and dependency planning, ability to gain political support |
Designing experiments and performing measurements, data collection and analysis, ability to work effectively in cross-functional teams and communicate with wider organization |
|
How success is measured |
Whether the plan is approved and funded |
How fast we can go through learning cycles and exit the explore phase, either by deprioritizing or canceling the work, or proceeding to the exploit phase |
|
How we achieve compliance |
Were the appropriate processes correctly followed and have the necessary signoffs been gathered? |
Did we identify the actual risks to stakeholders and gather the relevant information to effectively manage them? |
|
Table 3-2. Traditional project planning versus Lean Startup |
||
The biggest obstacles to taking a scientific approach to product development and organizational change are cultural and organizational, as we discuss in Part IV. In most cases, organizations have simply never taken an experiment-based approach and lack the skills and experience to implement it. In the context of product development, understanding how to design and execute experiments and analyze data is both hard and critically important—and yet they are not part of the core curriculum in most MBA programs or courses in software design and analysis. In bureaucratic and pathological organizations, an experimental approach may also challenge existing power structures and cultural norms.
Conclusion
We have laid out the foundations of a scientific approach to exploring new work—whether it’s new business models and products, internal enterprise work such as building new tools, or adopting new processes. When we have a shared understanding of what we mean by risk, measurement, and uncertainty, we can apply the principles and practices of the Lean Startup movement. These provide a superior way to manage the investment decision risks than traditional planning activities.
Our ability to compete is based on creating a common orientation across the organization and enabling the people doing the work to constantly create and practice new repertoire through a process of experimentation. These activities enable us to more effectively detect and analyze changes in our environment, to get inside the decision-making processes of other organizations, and to act—to better serve our customers and shape our environment. Boyd’s OODA model shows that adaptation to our environment is a continuous and ongoing process—for organizations as much as for people.
Questions for readers:
§ How does your organization or department model investment risks in your business plan? What data is it based on?
§ What are the variables in the plan with the highest information value? What measurements have been made to reduce the uncertainty in these variables?
§ How confident are you that people will find the work you are currently doing valuable? What evidence do you have to support your decision?
§ How often have you tried out the product you are working on with any of its intended users? What did you change as a result?
52 Definitions are taken from [hubbard], p. 50.
53 [hubbard], p. 111.
54 http://www.cio.com/article/119059/The_IT_Measurement_Inversion
55 [reinertsen]
56 See http://www.howtomeasureanything.com for an example. For an introduction to Monte Carlo simulation for business models, see http://bit.ly/1vKoXBE.
57 [bell], p. 48.
58 [hubbard], p. 23.
59 Ibid.
60 [hubbard], Chapter 7.
61 http://bit.ly/1v6YRcp
62 On his website, http://howtomeasureanything.com, Hubbard provides a spreadsheet that helps you calculate the value of information.
63 [kahneman], pp. 20-21. These names were coined by Stanovich and West in [stanovich].
64 This quote and the OODA loop diagrams in this section were taken from Chet Richards’ excellent discussion of the OODA loop: http://www.jvminc.com/boydsrealooda_loop.pdf. Chinese words have been updated to use pinyin.
65 Chet Richards, op. cit.
66 [liker]