Building Microservices (2015)
Chapter 8. Monitoring
As I’ve hopefully shown so far, breaking our system up into smaller, fine-grained microservices results in multiple benefits. It also, however, adds complexity when it comes to monitoring the system in production. In this chapter, we’ll look at the challenges associated with monitoring and identifying problems in our fine-grained systems, and I’ll outline some of the things you can do to have your cake and eat it too!
Picture the scene. It’s a quiet Friday afternoon, and the team is looking forward to sloping off early to the pub as a way to start a weekend away from work. Then suddenly the emails arrive. The website is misbehaving! Twitter is ablaze with your company’s failings, your boss is chewing your ear off, and the prospects of a quiet weekend vanish.
What’s the first thing you need to know? What the hell has gone wrong?
In the world of the monolithic application, we at least have a very obvious place to start our investigations. Website slow? It’s the monolith. Website giving odd errors? It’s the monolith. CPU at 100%? Monolith. Smell of burning? Well, you get the idea. Having a single point of failure also makes failure investigation somewhat simpler!
Now let’s think about our own, microservice-based system. The capabilities we offer our users are served from multiple small services, some of which communicate with yet more services to accomplish their tasks. There are lots of advantages to such an approach (which is good, as otherwise this book would be a waste of time), but in the world of monitoring, we have a more complex problem on our hands.
We now have multiple servers to monitor, multiple logfiles to sift through, and multiple places where network latency could cause problems. So how do we approach this? We need to make sense of what otherwise might be a chaotic, tangled mess—the last thing any of us wants to deal with on a Friday afternoon (or at any time, come to that!).
The answer here is pretty straightforward: monitor the small things, and use aggregation to see the bigger picture. To see how, we’ll start with the simplest system we can: a single node.
Single Service, Single Server
Figure 8-1 presents a very simple setup: one host, running one service. Now we need to monitor it in order to know when something goes wrong, so we can fix it. So what should we look for?
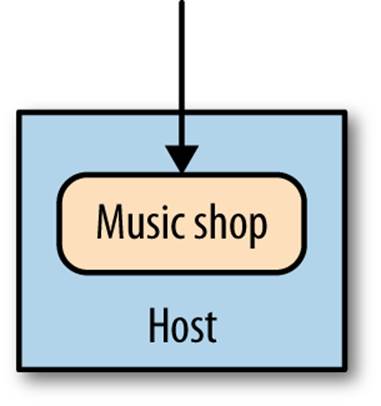
Figure 8-1. A single service on a single host
First, we’ll want to monitor the host itself. CPU, memory—all of these things are useful. We’ll want to know what they should be when things are healthy, so we can alert when they go out of bounds. If we want to run our own monitoring software, we could use something like Nagios to do so, or else use a hosted service like New Relic.
Next, we’ll want to have access to the logs from the server itself. If a user reports an error, these logs should pick it up and hopefully tell us when and where the error is. At this point, with our single host we can probably get by with just logging on to the host and using command-line tools to scan the log. We may even get advanced and use logrotate to move old logs out of the way and avoid them taking up all our disk space.
Finally, we might want to monitor the application itself. At a bare minimum, monitoring the response time of the service is a good idea. You’ll probably be able to do this by looking at the logs coming either from a web server fronting your service, or perhaps from the service itself. If we get very advanced, we might want to track the number of errors we are reporting.
Time passes, loads increase, and we find ourselves needing to scale…
Single Service, Multiple Servers
Now we have multiple copies of the service running on separate hosts, as shown in Figure 8-2, with requests to the different service instances distributed via a load balancer. Things start to get a bit trickier now. We still want to monitor all the same things as before, but need to do so in such a way that we can isolate the problem. When the CPU is high, is it a problem we are seeing on all hosts, which would point to an issue with the service itself, or is it isolated to a single host, implying that the host itself has the problem—perhaps a rogue OS process?
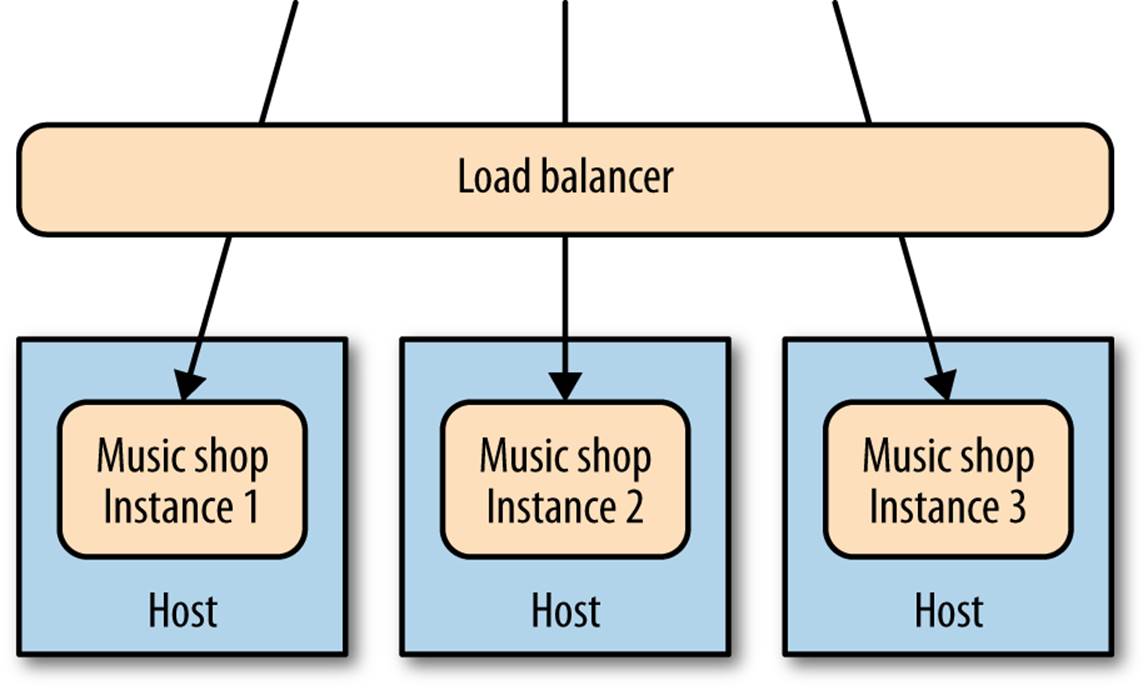
Figure 8-2. A single service distributed across multiple hosts
So at this point, we still want to track the host-level metrics, and alert on them. But now we want to see what they are across all hosts, as well as individual hosts. In other words, we want to aggregate them up, and still be able to drill down. Nagios lets us group our hosts like this—so far, so good. A similar approach will probably suffice for our application.
Then we have our logs. With our service running on more than one server, we’ll probably get tired of logging into each box to look at it. With just a few hosts, though, we can use tools like ssh-multiplexers, which allow us to run the same commands on multiple hosts. A big monitor and agrep "Error" app.log later, and we can find our culprit.
For tasks like response time tracking, we can get some of the aggregation for free by tracking at the load balancer itself. But we need to track the load balancer as well, of course; if that misbehaves, we have a problem. At this point, we also probably care a lot more about what a healthy service looks like, as we’ll configure our load balancer to remove unhealthy nodes from our application. Hopefully by the time we get here we have at least some idea of that…
Multiple Services, Multiple Servers
In Figure 8-3, things get much more interesting. Multiple services are collaborating to provide capabilities to our users, and those services are running on multiple hosts—be they physical or virtual. How do you find the error you’re looking for in thousands of lines of logs on multiple hosts? How do you determine if one server is misbehaving, or if it is a systematic issue? And how do you track back an error found deep down in a call chain between multiple hosts and work out what caused it?
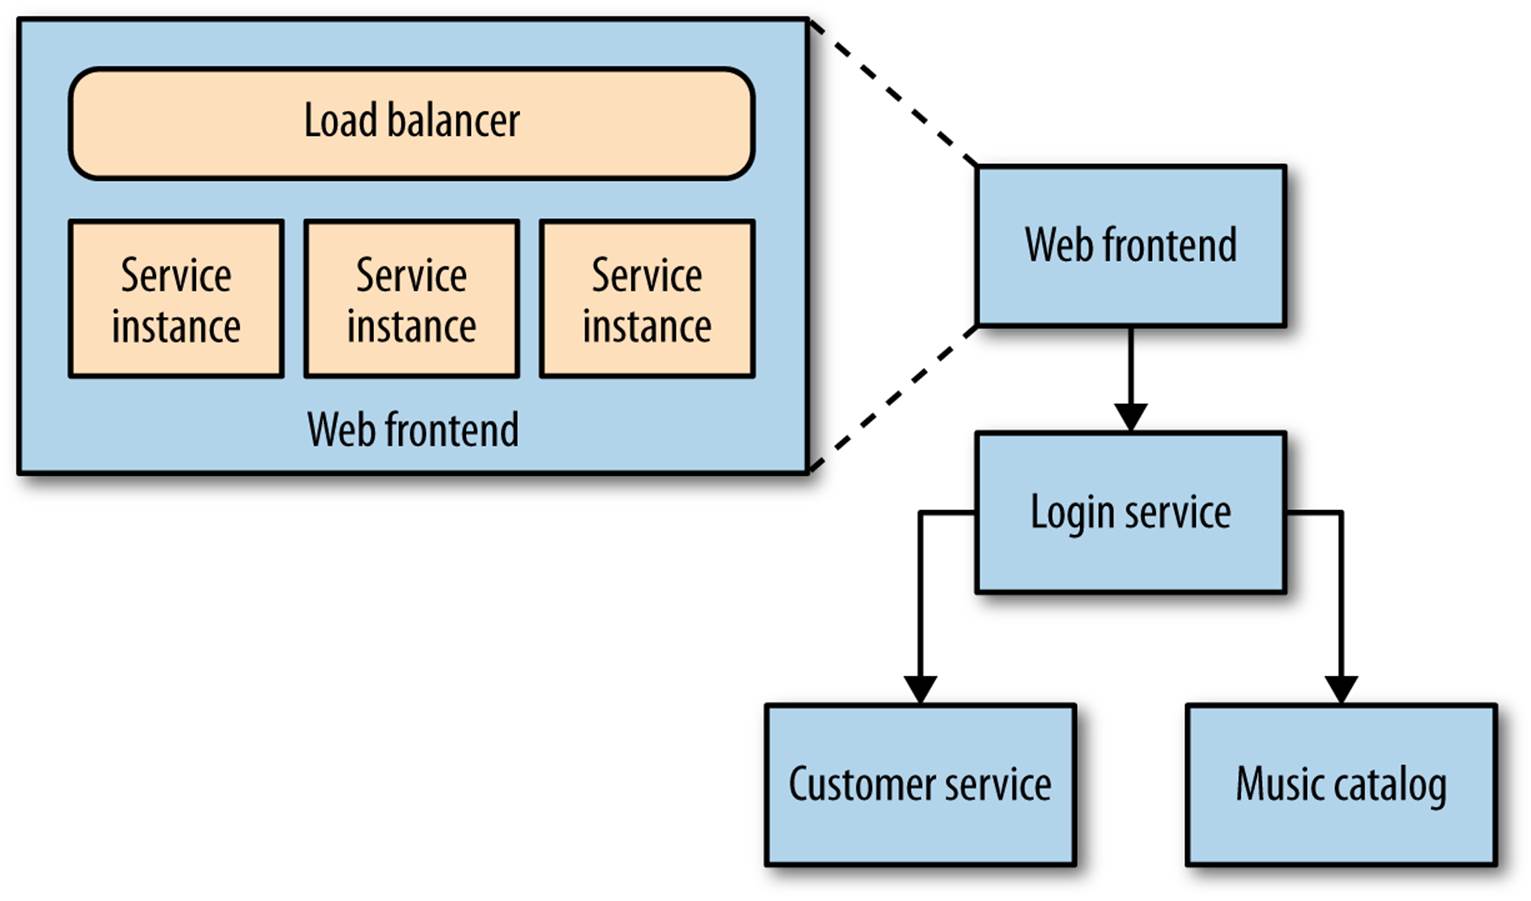
Figure 8-3. Multiple collaborating services distributed across multiple hosts
The answer is collection and central aggregation of as much as we can get our hands on, from logs to application metrics.
Logs, Logs, and Yet More Logs…
Now the number of hosts we are running on is becoming a challenge. SSH-multiplexing to retrieve logs probably isn’t going to cut it now, and there isn’t a screen big enough for you to have terminals open on every host. Instead, we’re looking to use specialized subsystems to grab our logs and make them available centrally. One example of this is logstash, which can parse multiple logfile formats and can send them to downstream systems for further investigation.
Kibana is an ElasticSearch-backed system for viewing logs, illustrated in Figure 8-4. You can use a query syntax to search through logs, allowing you to do things like restrict time and date ranges or use regular expressions to find matching strings. Kibana can even generate graphs from the logs you send it, allowing you to see at a glance how many errors have been generated over time, for example.
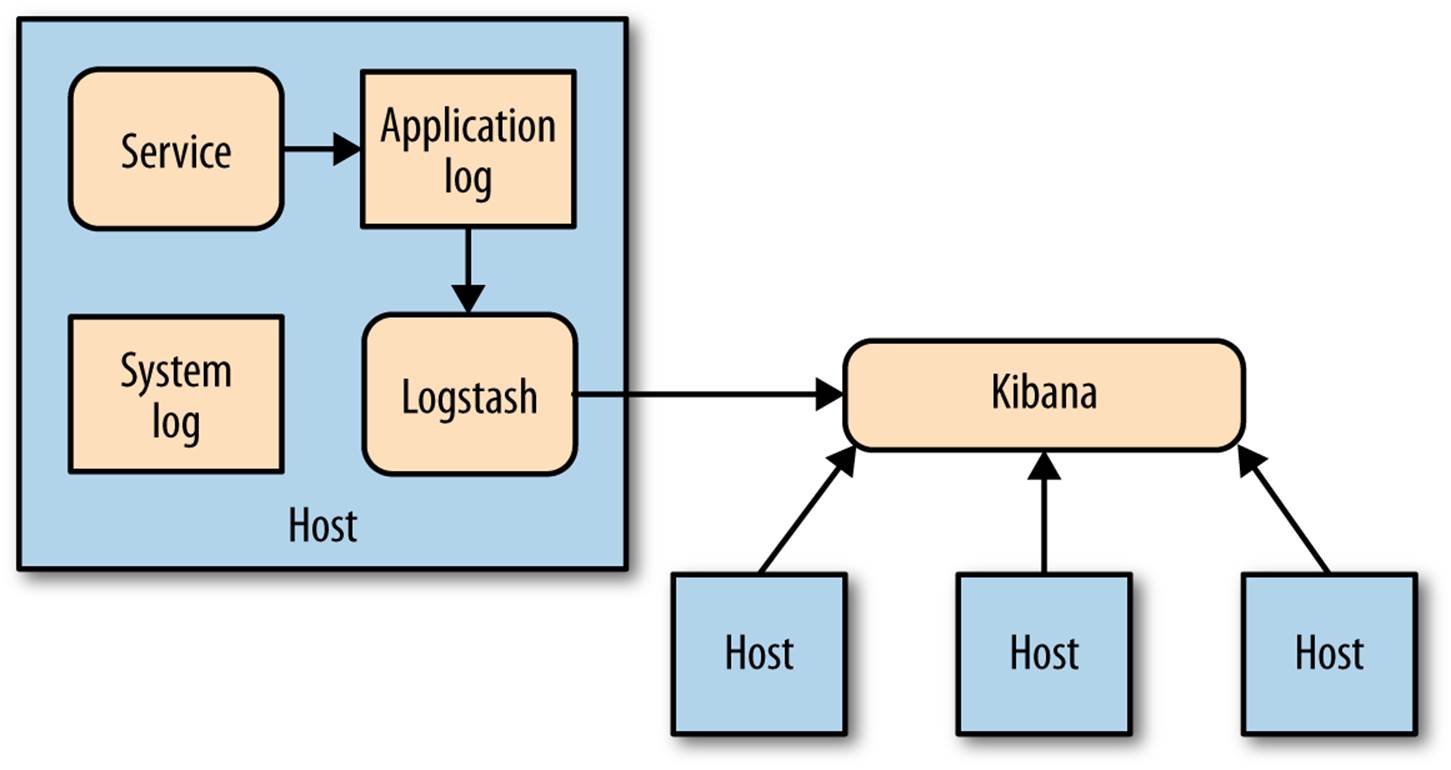
Figure 8-4. Using Kibana to view aggregated logs
Metric Tracking Across Multiple Services
As with the challenge of looking at logs for different hosts, we need to look at better ways to gather and view our metrics. It can be hard to know what good looks like when we’re looking at metrics for a more complex system. Our website is seeing nearly 50 4XX HTTP error codes per second. Is that bad? The CPU load on the catalog service has increased by 20% since lunch; has something gone wrong? The secret to knowing when to panic and when to relax is to gather metrics about how your system behaves over a long-enough period of time that clear patterns emerge.
In a more complex environment, we’ll be provisioning new instances of our services pretty frequently, so we want the system we pick to make it very easy to collect metrics from new hosts. We’ll want to be able to look at a metric aggregated for the whole system—for example, the avergage CPU load—but we’ll also want to aggregate that metric for all the instances of a given service, or even for a single instance of that service. That means we’ll need to be able to associate metadata with the metric to allow us to infer this structure.
Graphite is one such system that makes this very easy. It exposes a very simple API and allows you to send metrics in real time. It then allows you to query those metrics to produce charts and other displays to see what is happening. The way it handles volume is also interesting. Effectively, you configure it so that you reduce the resolution of older metrics to ensure the volumes don’t get too large. So, for example, I might record the CPU for my hosts once every 10 seconds for the last 10 minutes, then an aggregated sample every minute for the last day, down to perhaps one sample every 30 minutes for the last several years. In this way, you can store information about how your system has behaved over a long period of time without needing huge amounts of storage.
Graphite also enables you to aggregate across samples, or drill down to a single series, so you can see the response time for your whole system, a group of services, or a single instance. If Graphite doesn’t work for you for whatever reason, make sure you get similar capabilities in any other tool you select. And certainly make sure you can get access to the raw data to provide your own reporting or dashboards if you need to.
Another key benefit of understanding your trends is when it comes to capacity planning. Are we reaching our limit? How long until we need more hosts? In the past when we brought physical hosts, this was often an annual job. In the new age of on-demand computing provided by infrastructure as a service (IaaS) vendors, we can now scale up or down in minutes, if not seconds. This means that if we understand our usage patterns, we can make sure we have just enough infrastructure to serve our needs. The smarter we are in tracking our trends and knowing what to do with them, the more cost effective and responsive our systems can be.
Service Metrics
The operating systems we run on generate a large number of metrics for us, as you’ll find the moment you install collectd on a Linux box and point it at Graphite. Likewise, supporting subsystems like Nginx or Varnish exposes useful information like response times or cache hit rates. But what about your own service?
I would strongly suggest having your services expose basic metrics themselves. At a bare minimum, for a web service you should probably expose metrics like response times and error rates—vital if your server isn’t fronted by a web server that is doing this for you. But you should really go further. For example, our accounts service may want to expose the number of times customers view their past orders, or your web shop might want to capture how much money has been made during the last day.
Why do we care about this? Well, for a number of reasons. First, there is an old adage that 80% of software features are never used. Now I can’t comment on how accurate that figure is, but as someone who has been developing software for nearly 20 years, I know that I have spent a lot of time on features that never actually get used. Wouldn’t it be nice to know what they are?
Second, we are getting better than ever at reacting to how our users are using our system to work out how to improve it. Metrics that inform us of how our systems behave can only help us here. We push out a new version of the website, and find that the number of searches by genre has gone up significantly on the catalog service. Is that a problem, or expected?
Finally, we can never know what data will be useful! More times than I can count I’ve wanted to capture data to help me understand something only after the chance to do so has long passed. I tend to err toward exposing everything and relying on my metrics system to handle this later.
Libraries exist for a number of different platforms that allow our services to send metrics to standard systems. Codahale’s Metrics library is one such example library for the JVM. It allows you to store metrics as counters, timers, or gauges; supports time-boxing metrics (so you can specify metrics like “number of orders in the last five minutes”); and also comes out of the box with support for sending data to Graphite and other aggregating and reporting systems.
Synthetic Monitoring
We can try to work out if a service is healthy by, for example, deciding what a good CPU level is, or what makes for an acceptable response time. If our monitoring system detects that the actual values fall outside this safe level, we can trigger an alert—something that a tool like Nagios is more than capable of.
However, in many ways, these values are one step removed from what we actually want to track—namely, is the system working? The more complex the interactions between the services, the further removed we are from actually answering that question. So what if our monitoring systems were programmed to act a bit like our users, and could report back if something goes wrong?
I first did this back in 2005. I was part of a small ThoughtWorks team that was building a system for an investment bank. Throughout the trading day, lots of events came in representing changes in the market. Our job was to react to these changes, and look at the impact on the bank’s portfolio. We were working under some fairly tight deadlines, as the goal was to have done all our calculations in less than 10 seconds after the event arrived. The system itself consisted of around five discrete services, at least one of which was running on a computing grid that, among other things, was scavenging unused CPU cycles on around 250 desktop hosts in the bank’s disaster recovery center.
The number of moving parts in the system meant a lot of noise was being generated from many of the lower-level metrics we were gathering. We didn’t have the benefit of scaling gradually or having the system run for a few months to understand what good looked like for metrics like our CPU rate or even the latencies of some of the individual components. Our approach was to generate fake events to price part of the portfolio that was not booked into the downstream systems. Every minute or so, we had Nagios run a command-line job that inserted a fake event into one of our queues. Our system picked it up and ran all the various calculations just like any other job, except the results appeared in the junk book, which was used only for testing. If a re-pricing wasn’t seen within a given time, Nagios reported this as an issue.
This fake event we created is an example of synthetic transaction. We used this synthetic transaction to ensure the system was behaving semantically, which is why this technique is often called semantic monitoring.
In practice, I’ve found the use of synthetic transactions to perform semantic monitoring like this to be a far better indicator of issues in systems than alerting on the lower-level metrics. They don’t replace the need for the lower-level metrics, though—we’ll still want that detail when we need to find out why our semantic monitoring is reporting a problem.
Implementing Semantic Monitoring
Now in the past, implementing semantic monitoring was a fairly daunting task. But the world has moved on, and the means to do this is at our fingertips! You are running tests for your systems, right? If not, go read Chapter 7 and come back. All done? Good!
If we look at the tests we have that test a given service end to end, or even our whole system end to end, we have much of what we need to implement semantic monitoring. Our system already exposes the hooks needed to launch the test and check the result. So why not just run a subset of these tests, on an ongoing basis, as a way of monitoring our system?
There are some things we need to do, of course. First, we need to be careful about the data requirements of our tests. We may need to find a way for our tests to adapt to different live data if this changes over time, or else set a different source of data. For example, we could have a set of fake users we use in production with a known set of data.
Likewise, we have to make sure we don’t accidentally trigger unforeseen side effects. A friend told me a story about an ecommerce company that accidentally ran its tests against its production ordering systems. It didn’t realize its mistake until a large number of washing machines arrived at the head office.
Correlation IDs
With a large number of services interacting to provide any given end-user capability, a single initiating call can end up generating multiple more downstream service calls. For example, consider the example of a customer being registered. The customer fills in all her details in a form and clicks submit. Behind the scenes, we check validity of the credit card details with our payment service, talk to our postal service to send out a welcome pack in the post, and send a welcome email using our email service. Now what happens if the call to the payment service ends up generating an odd error? We’ll talk at length about handling the failure in Chapter 11, but consider the difficulty of diagnosing what happened.
If we look at the logs, the only service registering an error is our payment service. If we are lucky, we can work out what request caused the problem, and we may even be able to look at the parameters of the call. Now consider that this is a simple example, and that one initiating request could generate a chain of downstream calls and maybe events being fired off that are handled in an asynchronous manner. How can we reconstruct the flow of calls in order to reproduce and fix the problem? Often what we need is to see that error in the wider context of the initiating call; in other words, we’d like to trace the call chain upstream, just like we do with a stack trace.
One approach that can be useful here is to use correlation IDs. When the first call is made, you generate a GUID for the call. This is then passed along to all subsequent calls, as seen in Figure 8-5, and can be put into your logs in a structured way, much as you’ll already do with components like the log level or date. With the right log aggregation tooling, you’ll then be able to trace that event all the way through your system:
15-02-2014 16:01:01 Web-Frontend INFO [abc-123] Register
15-02-2014 16:01:02 RegisterService INFO [abc-123] RegisterCustomer ...
15-02-2014 16:01:03 PostalSystem INFO [abc-123] SendWelcomePack ...
15-02-2014 16:01:03 EmailSystem INFO [abc-123] SendWelcomeEmail ...
15-02-2014 16:01:03 PaymentGateway ERROR [abc-123] ValidatePayment ...
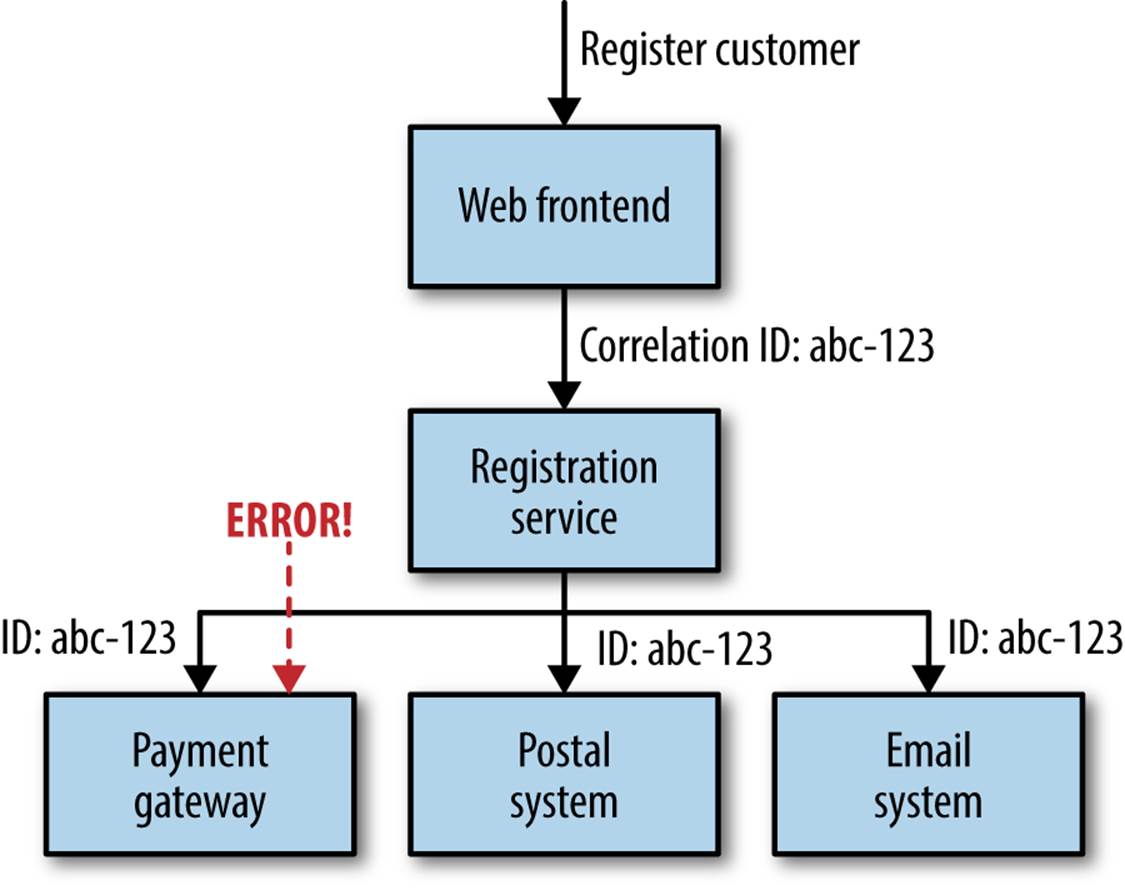
Figure 8-5. Using correlation IDs to track call chains across multiple services
You will, of course, need to ensure that each service knows to pass on the correlation ID. This is where you need to standardize and be stronger in enforcing this across your system. But once you have done this, you can actually create tooling to track all sorts of interactions. Such tooling can be useful in tracking down event storms, odd corner cases, or even identifying especially costly transactions, as you can picture the whole cascade of calls.
Software such as Zipkin can also trace calls across multiple system boundaries. Based on the ideas from Google’s own tracing system, Dapper, Zipkin can provide very detailed tracing of interservice calls, along with a UI to help present the data. Personally, I’ve found the requirements of Zipkin to be somewhat heavyweight, requiring custom clients and supporting collection systems. Given that you’ll already want log aggregation for other purposes, it feels much simpler to instead make use of data you’re already collecting than have to plumb in additional sources of data. That said, if you find that you need a more advanced tool to track interservice calls like this, you might want to give them a look.
One of the real problems with correlation IDs is that you often don’t know you need one until after you already have a problem that could be diagnosed only if you had the ID at the beginning! This is especially problematic, as retrofitting correlation IDs in is very difficult; you need to handle them in a standardized way to be able to easily reconsititute call chains. Although it might seem like additional work up front, I would strongly suggest you consider putting them in as soon as you can, especially if your system will make use of event-drive architecture patterns, which can lead to some odd emergent behavior.
Needing to handle tasks like consistently passing through correlation IDs can be a strong argument for the use of thin shared client wrapper libraries. At a certain scale, it becomes difficult to ensure that everyone is calling downstream services in the right way and collecting the right sort of data. It only takes one service partway through the chain to forget to do this for you to lose critical information. If you do decide to create an in-house client library to make things like this work out of the box, do make sure you keep it very thin and not tied to any particular producing service. For example, if you are using HTTP as the underlying protocol for communication, just wrap a standard HTTP client library, adding in code to make sure you propogate the correlation IDs in the headers.
The Cascade
Cascading failures can be especially perilous. Imagine a situation where the network connection between our music shop website and the catalog service goes down. The services themselves appear healthy, but they can’t talk to each other. If we just looked at the health of the individual service, we wouldn’t know there is a problem. Using synthetic monitoring—for example, to mimic a customer searching for a song—would pick up the problem. But we’d also need to report on the fact that one service cannot see another in order to determine the cause of the problem.
Therefore, monitoring the integration points between systems is key. Each service instance should track and expose the health of its downstream dependencies, from the database to other collaborating services. You should also allow this information to be aggregated to give you a rolled-up picture. You’ll want to see the response time of the downstream calls, and also detect if it is erroring.
As we’ll discuss more in Chapter 11, you can use libraries to implement a circuit breaker around network calls to help you handle cascading failures in a more elegant fashion, allowing you to more gracefully degrade your system. Some of these libraries, such as Hystrix for the JVM, also do a good job of providing these monitoring capabilities for you.
Standardization
As we’ve covered previously, one of the ongoing balancing acts you’ll need to pull off is where to allow for decisions to be made narrowly for a single service versus where you need to standardize across your system. In my opinion, monitoring is one area where standardization is incredibly important. With services collaborating in lots of different ways to provide capabilities to users using multiple interfaces, you need to view the system in a holistic way.
You should try to write your logs out in a standard format. You definitely want to have all your metrics in one place, and you may want to have a list of standard names for your metrics too; it would be very annoying for one service to have a metric called ResponseTime, and another to have one called RspTimeSecs, when they mean the same thing.
As always with standardization, tools can help. As I’ve said before, the key is making it easy to do the right thing—so why not provide preconfigured virtual machine images with logstash and collectd ready to go, along with application libraries that let you talk to Graphite really easily?
Consider the Audience
All this data we are gathering is for a purpose. More specifically, we are gathering all this data for different people to help them do their jobs; this data becomes a call to action. Some of this data needs to trigger an immediate call to action for our support team—for example, in the case of one of our synthetic monitoring tests failing. Other data, like the fact that our CPU load has increased by 2% over the last week, is potentially only of interest when we’re doing capacity planning. Likewise, your boss is probably going to want to know right away that revenue dipped 25% after the last release, but probably doesn’t need to be woken up because searches for “Justin Bieber” have gone up 5% in the last hour.
What our people want to see and react to right now is different than what they need when drilling down. So, for the type of person who will be looking at this data, consider the following:
§ What they need to know right now
§ What they might want later
§ How they like to consume data
Alert on the things they need to know right now. Create big visible displays with this information that sit in the corner of the room. Give them easy access to the data they need to know later. And spend time with them to know how they want to consume data. A discussion about all the nuances involved in the graphical display of quantitative information is certainly outside the scope of this book, but a great place to start is Stephen Few’s excellent book Information Dashboard Design: Displaying Data for At-a-Glance Monitoring (Analytics Press).
The Future
I have seen many organizations where metrics are siloed into different systems. Application-level metrics, like the number of orders placed, end up in a proprietary analytics system like Omniture, which is often available only to select parts of the business, or else ends up in the dreaded data warehouse, aka where data goes to die. Reporting from such systems is often not available in real time, although that is starting to change. Meanwhile, system metrics like response times, error rates, and CPU load are stored in systems that the operations teams can access. These systems typically allow for real-time reporting, as normally the point of them is to provoke an immediate call to action.
Historically, the idea that we can find out about key business metrics a day or two later was fine, as typically we were unable to react fast enough to this data to do anything about it anyway. Now, though, we operate in a world in which many of us can and do push out multiple releases per day. Teams now measure themselves not in terms of how many points they complete, but instead optimize for how long it takes for code to get from laptop to live. In such an environment, we need all our metrics at our fingertips to take the right action. Ironically, the very systems that store business metrics are often not tuned for immediate access to data, but our operational systems are.
So why handle operational and business metrics in the same way? Ultimately, both types of things break down to events that say something happened at X. So, if we can unify the systems we use to gather, aggregate, and store these events, and make them available for reporting, we end up with a much simpler architecture.
Riemann is an event server that allows for fairly advanced aggregation and routing of events and can form part of such a solution. Suro is Netflix’s data pipeline and operates in a similar space. Suro is explicitly used to handle both metrics associated with user behavior, and more operational data like application logs. This data can then be dispatched to a variety of systems, like Storm for real-time analysis, Hadoop for offline batch processing, or Kibana for log analysis.
Many organizations are moving in a fundamentally different direction: away from having specialized tool chains for different types of metrics and toward more generic event routing systems capable of significant scale. These systems manage to provide much more flexibility, while at the same time actually simplifying our architecture.
Summary
So, we’ve covered a lot here! I’ll attempt to summarize this chapter into some easy-to-follow advice.
For each service:
§ Track inbound response time at a bare minimum. Once you’ve done that, follow with error rates and then start working on application-level metrics.
§ Track the health of all downstream responses, at a bare minimum including the response time of downstream calls, and at best tracking error rates. Libraries like Hystrix can help here.
§ Standardize on how and where metrics are collected.
§ Log into a standard location, in a standard format if possible. Aggregation is a pain if every service uses a different layout!
§ Monitor the underlying operating system so you can track down rogue processes and do capacity planning.
For the system:
§ Aggregate host-level metrics like CPU together with application-level metrics.
§ Ensure your metric storage tool allows for aggregation at a system or service level, and drill down to individual hosts.
§ Ensure your metric storage tool allows you to maintain data long enough to understand trends in your system.
§ Have a single, queryable tool for aggregating and storing logs.
§ Strongly consider standardizing on the use of correlation IDs.
§ Understand what requires a call to action, and structure alerting and dashboards accordingly.
§ Investigate the possibility of unifying how you aggregate all of your various metrics by seeing if a tool like Suro or Riemann makes sense for you.
I’ve also attempted to outline the direction in which monitoring is moving: away from systems specialized to do just one thing, and toward generic event processing systems that allow you to look at your system in a more holistic way. This is an exciting and emerging space, and while a full investigation is outside the scope of this book, hopefully I’ve given you enough to get started with. If you want to know more, I go into some of these ideas and more in my earlier publication Lightweight Systems for Realtime Monitoring (O’Reilly).
In the next chapter, we’ll take a different holistic view of our systems to consider some of the unique advantages—and challenges—that fine-grained architectures can provide in the area of security.
All materials on the site are licensed Creative Commons Attribution-Sharealike 3.0 Unported CC BY-SA 3.0 & GNU Free Documentation License (GFDL)
If you are the copyright holder of any material contained on our site and intend to remove it, please contact our site administrator for approval.
© 2016-2026 All site design rights belong to S.Y.A.