The Profitable Supply Chain: A Practitioner’s Guide (2015)
Chapter 6. Network Planning
The demand and supply planning methods described in earlier chapters are required for ensuring that a company is performing the tactical steps required to align supply with demand, which will support high customer service and fill rates and minimize cost variances. However, operating metrics and profits are also dictated by the cost structure of the supply chain, which includes purchase prices for raw material, facility costs, labor costs for manufacturing and distribution, and transportation costs across the network. This analysis of the network for opportunities is one of the areas of supply chain management that is performed poorly or inadequately by most companies, largely due to the difficulty related to data gathering and use of analytical models. This chapter covers simple processes and approaches for analyzing the network, and easy-to-use models for performing quantitative analysis.
The Importance of Network Planning
Network planning refers to the series of steps for analyzing the impact of supply chain structure on responsiveness and costs. The following quote is from the home improvement company Lowe’s, emphasizing the importance of network planning for a company that services a vast geography and provides a wide array of products that require special handling and storage:
Supply Chain: To efficiently move product from our vendors to our stores and maintain in-stock levels, we own and operate 15 highly-automated regional distribution centers (RDCs) in the United States. Through our RDCs, products are received from vendors, stored and picked or cross-docked, and then shipped to retail locations. On average, each RDC serves 115 stores. We also lease and operate a distribution facility to serve our Canadian stores.
We also operate 15 flatbed distribution centers (FDCs) to distribute merchandise that requires special handling due to size or type of packaging such as lumber, boards, panel products, irrigation pipe, vinyl sidings, ladders and building materials. Additionally, we operate five facilities to support our import and e-commerce businesses and flexible fulfillment capabilities. We also utilize three third-party transload facilities. These facilities do not hold inventory, but are the first point of receipt for imported products. The transload facilities sort and allocate products to RDCs based on individual store demand and forecasts.
On average in fiscal 2013, over 75% of the total dollar amount of stock merchandise we purchased was shipped through our distribution network, while the remaining portion was shipped directly to stores from our vendors.
—Lowe’s Companies Inc., 2013 Annual Report
A major occasion for analyzing the network is related to mergers and acquisitions, because there is a need to leverage assets across multiple companies to improve utilization metrics. The following press release details of some of the decisions that Federated Stores had to take in connection with an acquisition:
Federated Department Stores today announced a consolidation of its distribution center network in the Midwest to reduce duplication, increase efficiency and streamline operations. As a result, the company will close three distribution centers in early 2007. These centers were acquired in 2005 as part of The May Department Stores Company and now are operated by the Federated Logistics division.
The difficult decision to consolidate facilities was necessary because we simply have too much distribution capacity for the company's needs going forward. In addition, the work performed in some facilities no longer is needed, “said Federated Vice Chair Tom Cole”. Advances in logistics and distribution center technology allow us to handle a larger volume of goods more effectively with fewer facilities that are more regional in nature. This helps us to deliver fresh fashion merchandise to the selling floors of our stores more quickly and consistently across the country.
—November 2006 press release, Federated Department Stores, Inc.
A similar need for consolidation is expressed by Whirlpool, following a huge merger with Maytag:
Following our acquisition of Maytag, we began consolidating redundant facilities and trimming the number of distribution centers by more than 50 locations, increasing efficiencies and streamlining deliveries.
—Whirlpool Corporation, 2006 Annual Report
Some of the questions addressed by network planning are:
· Where should manufacturing plants and distribution centers be placed to minimize facility and transportation costs, while increasing or achieving a level of responsiveness?
· How should this network change over time in order to meet the demands of new markets and products?
· Should goods be shipped to distribution centers in a finished form, or in bulk?
· Which transportation modes should be used to move products?
· When is it necessary to consider a cross-docking model for delivery of goods?
· Which fulfillment model is beneficial—make-to-order or make-to-stock?
A prerequisite for analyzing network options is an understanding of the different cost categories and accounting methods. The methods for specifying costs for internal analysis and decision-making is commonly referred to as managerial accounting. While financial accounting is aimed at providing information to parties outside the organization, managerial accounting is aimed at helping managers within the organization make decisions. Due to this difference, managerial accounting specifies costs in many different ways and with far greater detail. At the highest level, the cost categories considered are manufacturing, storage, direct material purchases, and transportation. The sum of these costs results in the computation of cost-of-goods, which, in turn, allows for the gross margin to be computed as the difference between revenue and cost-of-goods. An additional financial measure of importance in network planning is operating assets, defined as all assets that are used to create revenue. (Cash, buildings, and equipment that are not used to generate revenue do not count as operating assets.) With the computation of gross margins and operating assets, the gross margin return on operating assets (GMROOA) is defined as:

GMROOA provides an excellent measure of the efficiency of the supply network and is useful for comparing one network option with another. Since cost-of-goods requires the computation of manufacturing, transportation, raw material, distribution, and inventory costs, the analyst requires an intimate understanding of accounting concepts and measurements. Refer to Appendix A for additional details regarding managerial accounting.
The Network Planning Process
Given the number of variables and possibilities that need to be considered, it is necessary to follow a structured procedure while designing and configuring the network. These steps—together with interactions with other supply chain processes—are described below and illustrated in Figure 6-1.
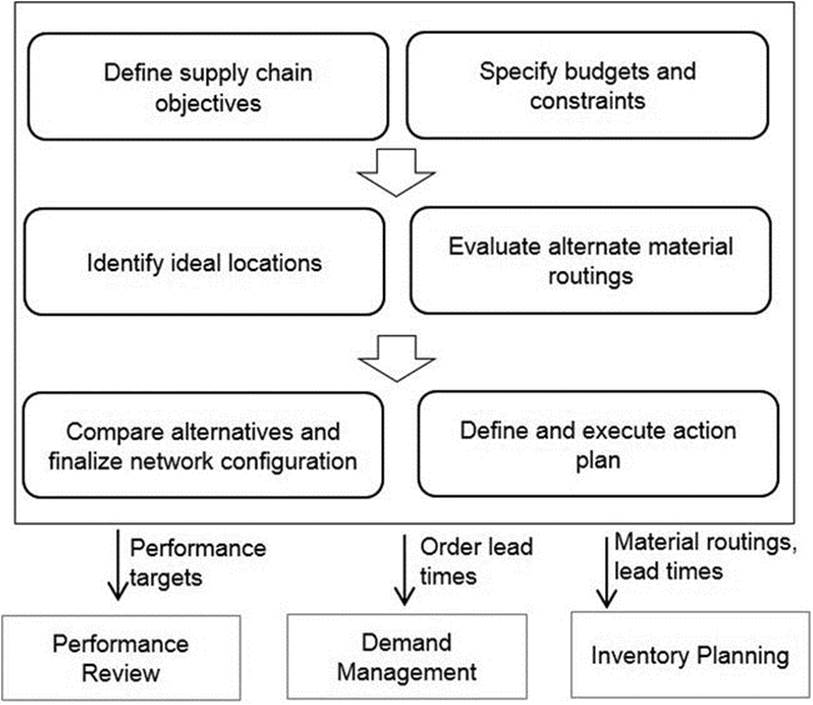
Figure 6-1. The Network Planning process
The process begins with a definition of supply chain objectives. These objectives are primarily related to the current and projected demand that needs to be supported by the supply chain, targeted costs and margins, and desired responsiveness and customer service levels. It is equally important to specify financial and operational constraints. Examples of constraints are budgets for expansion and availability of resources.
When a new section of the supply chain is being created for expansion into a new market or manufacture of a new product, the next step is to identify ideal locations for distribution centers and manufacturing plants. These new locations need to consider different transportation and material routing options and the cost of operating these new facilities in order to meet the objectives.
It is possible to improve the performance of an existing network without adding new facilities, but just by changing material routings and transportation modes. An example of such a change is the use of a postponement strategy, which can result in material being routed in a raw or sub-assembly form closer to the customer.
Upon identifying viable options, the decision to reconfigure the network accordingly needs to be taken with care. In several cases, each of the options can provide different benefits. For example, one option can provide greater responsiveness at a higher cost, while another less responsive supply chain can be more cost effective. It might not be possible to decide between these options based solely on a quantitative comparison. Instead, the trade-off often requires management’s subjective view of the relative importance of these drivers for the company’s future.
Once a network configuration has been selected, a series of actions are required for implementation. For example, a change to material routings requires communication with logistics or a third-party logistics provider (3PL and also changes to software systems to reflect these new rules and costs. Similarly, selection of a new facility requires contacting a real estate agent regarding properties, and a subsequent series of steps to set up facilities, hire resources, purchase machinery, and set up systems. Each of these steps is explained in greater detail in the following sections.
Definition of Objectives and Constraints
The primary objectives of network design are to satisfy demand for products and provide the targeted response times, while simultaneously reducing costs related to manufacturing, inventorying, and transportation. Therefore, the following information needs to be collected:
· Anticipated demand by product or product line and by location (market), usually for a three- to five-year horizon.
· Order response times, often by product, location, or even customer.
· Targeted margins and spend or unit costs by product, for transportation, inventorying, and manufacturing.
The supply chain network impacts every function in the company—sales, manufacturing, distribution, procurement, customer service, and finance. Therefore, it is important for management from these impacted areas to participate in the definition of objectives.
Once objectives have been specified, it is necessary to understand constraints. These include business or product boundaries that can limit the options that can be considered. Examples of constraints include:
· The financial situation of the company and the budget available for investment in new facilities or initiation of new markets
· Management’s direction regarding network options that can be considered. For example, a focus on growth may increase the importance of expansion into new markets and eliminate focus on reconfiguring existing markets.
· Manufacturing and distribution capabilities, and the willingness to change. For example, initiating a postponement strategy will require changes to manufacturing routings and the purchase of materials. Therefore, a willingness and capability for manufacturing to support changes needs to be established before additional consideration.
· The time available for evaluating the network and implementing changes
The value in conversing with the different stakeholders and gaining a comprehensive understanding of constraints cannot be overstated; it ensures that valuable time is not spent on analyzing and implementing options that will eventually fail.
Identification of Ideal Locations
Ideal locations are identified based on minimizing customer response times and transportation and facility costs in the supply chain. Since both response times and transportation costs are largely determined by distance traveled, it is common to begin to identify locations based on proximity to markets with high volumes. While a simple visual review on a map can suffice for small supply chains with just a few products and markets, a more rigorous method is needed when the number of products and locations increase. A simple method for performing this analysis is called thegravity model. This model uses the geometric concept of weighted centroids1 to analyze demand and costs across different locations. The gravity model can be applied to several demand locations, resulting in the calculation of the center of demand (COD). The COD is the geographic point that minimizes the demand-weighted distance for delivery and is defined by latitude and longitude coordinates. The significance of the COD is that it represents the optimal location for a distribution center that services all the demand locations. The mathematical details of the model are shown in Figure 6-2. An application of this method is provided in Example 6-1.
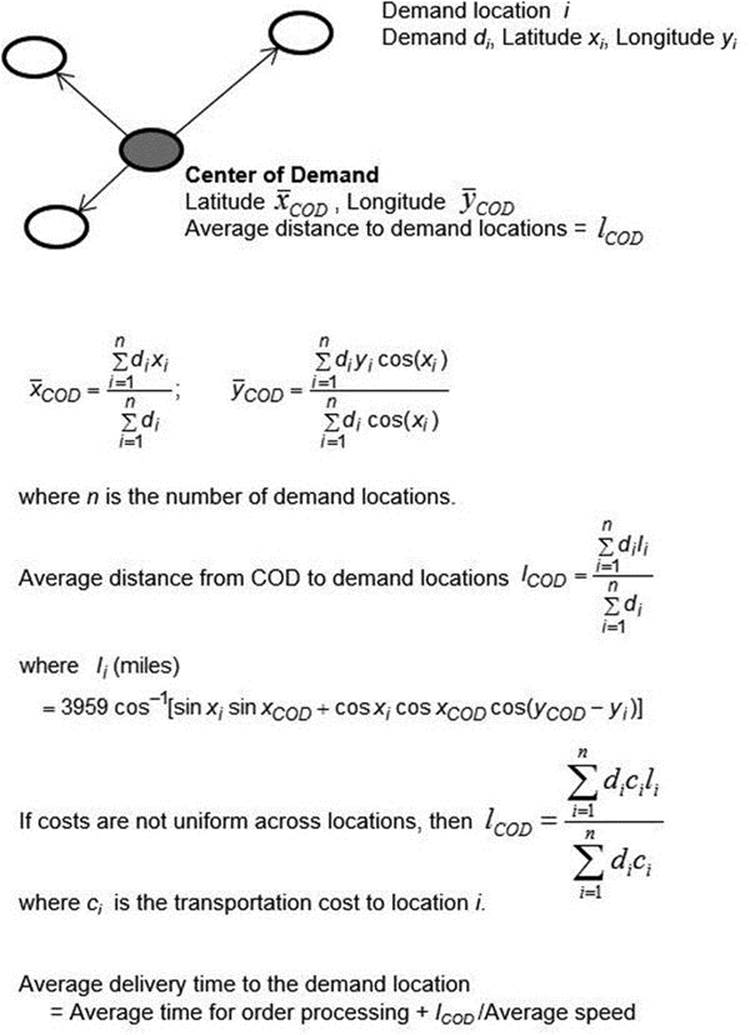
Figure 6-2. Use of the Gravity Model for calculating the Center of Demand
EXAMPLE 6-1: DETERMINING THE OPTIMAL LOCATION FOR A DISTRIBUTION CENTER
Demand and geographic data for a consumer electronic company are provided in the first table in Figure 6-3 for eight markets. Each of the columns in the table is explained below.
· The first column is the U.S. city being evaluated.
· The second column is sales data collected for each of the cities.
· The third and fourth columns are latitude and longitude information for the respective cities.
· The last three columns are computed from the data given in the preceding three columns. Note that the calculation that utilizes the cosine function requires the angle to be specified in radians. Therefore, the Excel formula for Washington is COS(38.95*Pi/180) = COS(0.6798) = 0.777.
With this data, the coordinates of the COD are calculated as:
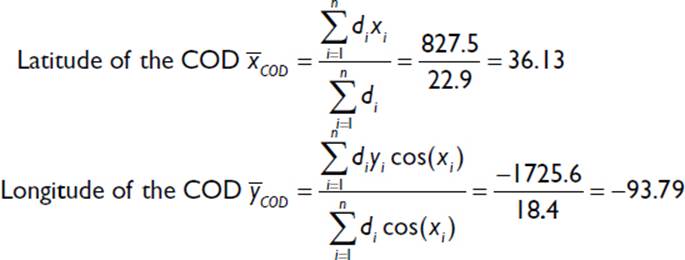
With these coordinates, the closest distribution hub can be identified from a map based on accessibility and connectedness. For example, Tulsa (Oklahoma) is a candidate location.
Next, the average distance from the COD to the individual cities needs to be computed, as shown in Figure 6-2. A sample calculation in Microsoft Excel for Washington DC follows:
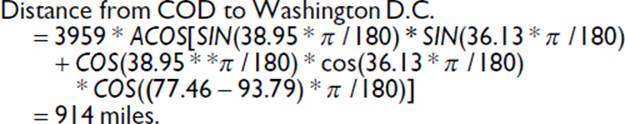
Performing the computation for each of the cities results in an average distance from the COD to the demand locations of 1,009 miles. If, for example, the average unit transportation cost is $0.002 per mile (based on $1 per mile by truck, and 500 units of the product in a truckload), the average unit cost of transportation is $0.002*1009 = $2.02.
Finally, if the average order processing time is 1 day, and the average speed of transportation is 45 miles per hour over a 10-hour day, the average delivery time from Washington DC is calculated from Figure 6-2 as
Average delivery time from COD
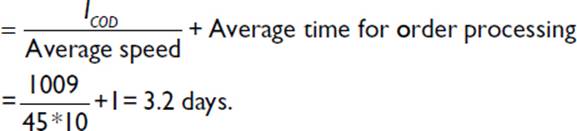
The delivery times to each of the cities is given in the second table in Figure 6-3, and the difference across cities should be noted: From 2 days to Houston to 4.4 days to San Jose, CA. The average delivery time can be used to compare the responsiveness of different networks. If the maximum response time is excessively high, it is an important indicator of the need for additional distribution centers.
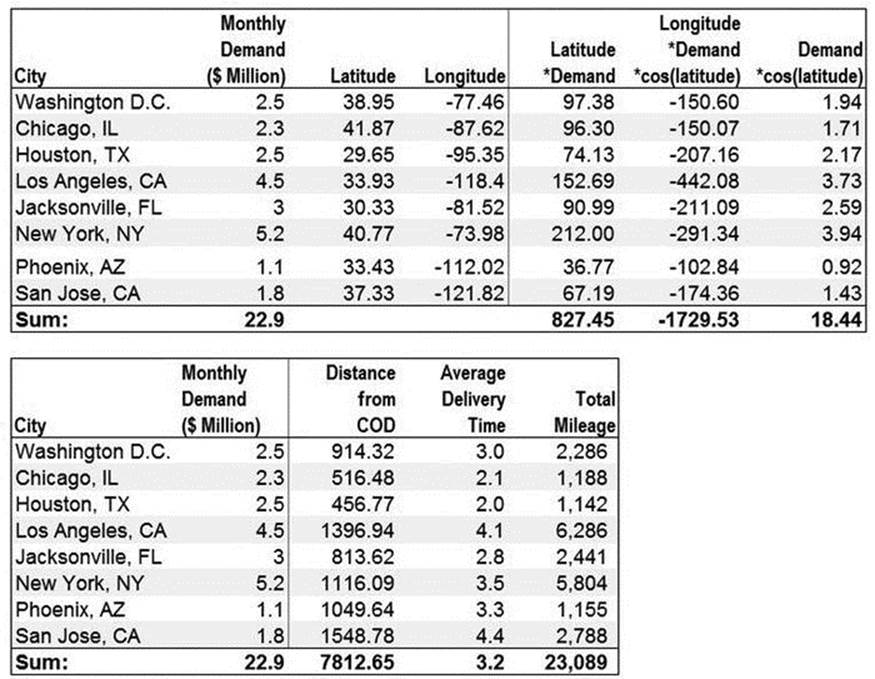
Figure 6-3. Data and results for Example 6-1
Note that this example utilizes air distances between the different locations. A more complete analysis would refine the calculations utilizing actual highway distances. The gravity model can be used to evaluate the effectiveness of the existing network: The current supply chain has a distribution center in the proximity of New York City, and the average distance from this location to the demand locations is calculated from Figure 6-2 to be 1,148 miles. For this mileage, the average unit transportation cost is (1148*$0.002) = $2.3, and the average delivery time is 3.55 days. Therefore, the current network results in an additional transportation cost of 14% and additional delivery time of 11%.
Example 6-2 demonstrates the use of the gravity model for determining optimal locations for distribution. In a similar manner, the gravity model can be used to identify optimal locations for manufacturing locations to service a distribution network. The simplicity of the model makes it a useful tool to begin the analysis. Once the optimal geography has been identified, a more detailed follow-up needs to be performed to identify transportation hubs in close proximity, the availability and price of distribution facilities, the presence of 3PL providers, and actual road distances.
One of the important decisions to be made is regarding the number of facilities in the network, and the considerations include costs and responsiveness to the individual markets. Since total cost includes facility and transportation, it may be possible for costs to decrease with the addition of facilities, followed by an increase as facility costs begin to outweigh transportation. An example of the impact of number of facilities on costs is illustrated in Figure 6-4 (considering inventory, transportation, and facility costs).
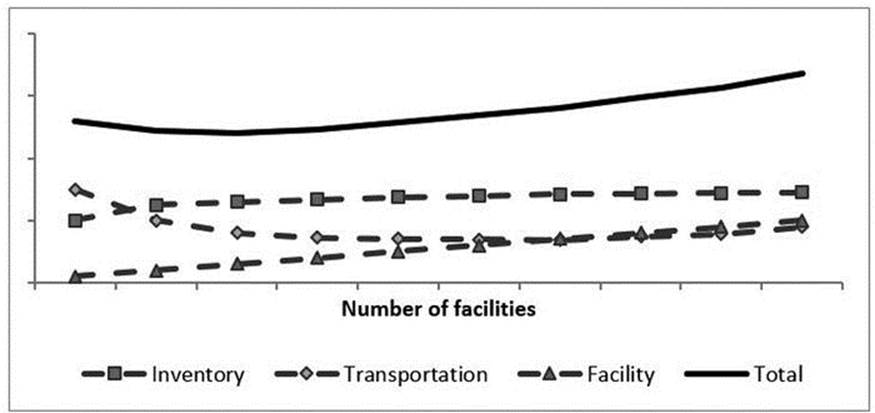
Figure 6-4. Inventory, facility, and transportation costs in a network
Evaluation of Alternative Material Routings
When the intent is to utilize the network that is in place, improvements are possible by modifying material routings, which can result in lower fuel and transportation costs, lower inventories, or improvement customer responsiveness. Material routings refer to the steps to convert raw material into finished goods and delivery to the customer. Examples of changes to material routings include:
· Manufacturing a product at a different plant
· Fulfilling geographic demands specific to a different plant
· Moving final assembly or packaging from a manufacturing plant to a distribution center (postponement)
· Transporting goods using a different mode of transport or a different route
· Using a 3PL provider for distributing inventory instead of owned facilities
For each option that is considered, relevant cost data will need to be collected in order to complete the analysis. Examples of data to be collected include:
· Rental costs for facilities, and availability of space
· Labor rates and availability
· Transportation costs for relevant modes, for inbound and outbound shipments
· Third-party storage and handling rates, and availability of providers
· Manufacturing costs, if postponement or new plants are being considered
· Exchange rates for goods manufactured in other countries. If rates have become or are anticipated to become unfavorable, alternative country locations may need to be considered.
· Tariffs and tax incentives for manufacturing. Tariffs are customs duties incurred when material moves across country borders. While selecting facility locations or suppliers, any existing treaties or existence of free trade zones that can reduce duties and taxes need to be included in the consideration.
It is clear that these changes can give rise to a large number of options for even a mid-sized supply chain. Unfortunately, a rigorous modeling framework to evaluate these different options is not easy to formulate or execute. The most prevalent methods from operations research are linear programming and mixed integer programming; however, these methods are not easy to set up and use, and underlying assumptions limit their applicability to several situations, particularly for incorporating the impact of inventory and uncertainty. As a result, it is common for such analyses to be performed using spreadsheets. The drawback with the spreadsheet approach is that the fluid framework shifts the onus of rigor to the analyst. Therefore, the quality of the analysis is dependent on the adherence to a structured process to ensure that all aspects of transportation, manufacturing, and inventorying costs are considered. This procedure is illustrated in Figure 6-5 and demonstrated in Example 6-2.
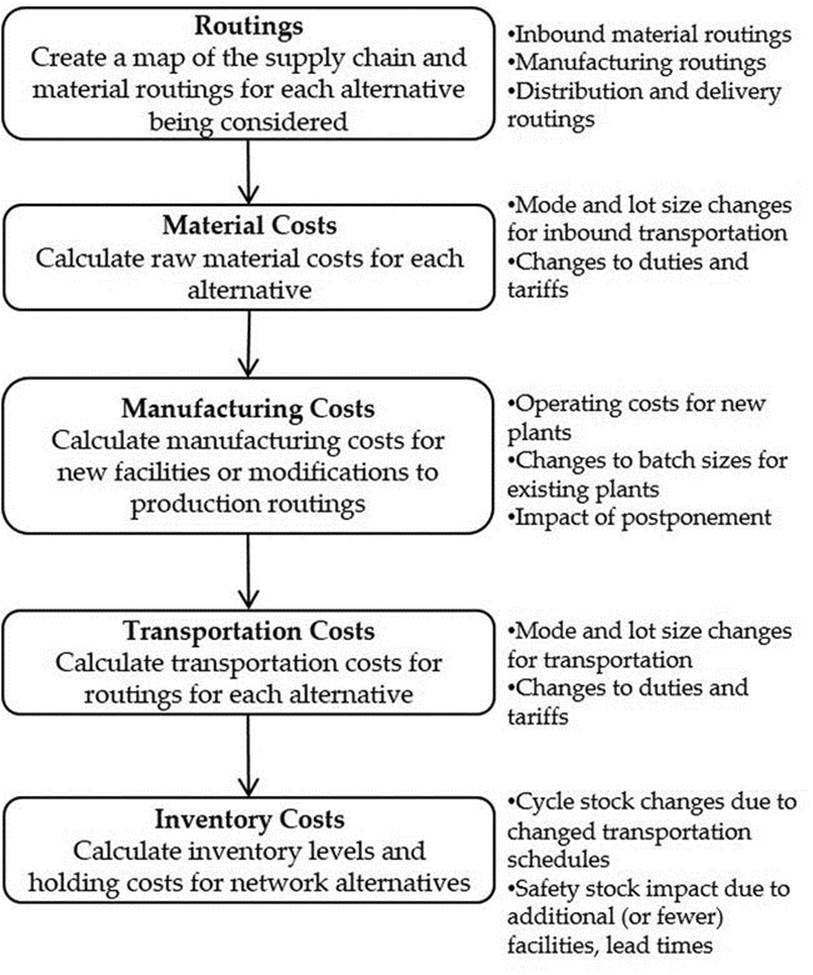
Figure 6-5. Inventory, facility, and transportation costs in a network
EXAMPLE 6-2: EVALUATING ALTERNATE NETWORK CONFIGURATIONS
The supply chain for a manufacturer of custom wall units (entertainment centers and book shelves) is shown in Figure 6-6, along with financial data for the product. The supplier in Chicago delivers raw material (wood) to the manufacturing plant in Philadelphia. The manufacturing operation consists of cutting wood into parts to match custom dimensions for each job. Upon completion, the parts are transported to the distribution centers, shown as numbered circles in the figure, and subsequently delivered to the home for installation.
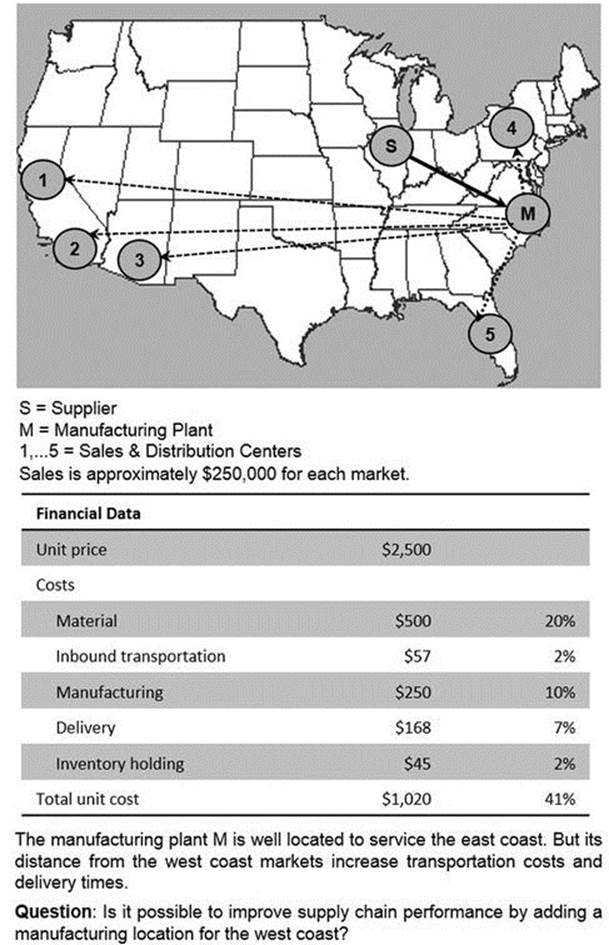
Figure 6-6. Supply network and data for Example 6-2
The five markets are of approximately the same size, each with monthly revenues of $250,000. The bounds or constraints placed on changes are that no investment is available for new facilities, but existing facilities can be utilized differently, if appropriate. The company wants to determine whether the network can be changed to reduce costs.
The first step in the network planning process is to identify alternate configurations that have the potential to lower costs. This example describes one such alternative—the setup of manufacturing operations at one of the three markets in the West Coast. Based on available space and expertise of the local management, the Phoenix distribution center (location 3 in the map) is targeted. Following the process for evaluating network alternatives, the routings for the new network are mapped, and the impact on the different cost categories are summarized in Figure 6-7. The details of the cost calculations for each of the steps are provided below.
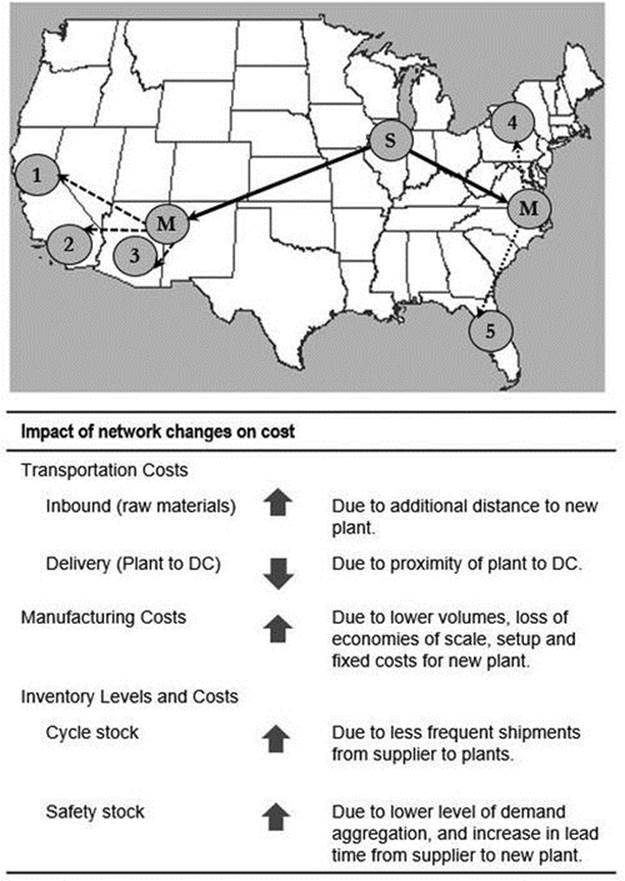
Figure 6-7. Assessing the impact of routing changes on the network (Example 6-2)
Inbound Transportation Costs
In the new network, raw material is routed separately to the two manufacturing plants. The unit cost for transportation is $0.08 per mile (based on full truckload rates). The distance from the supplier to Phoenix is 1,762 miles, and the unit cost for transportation to Phoenix is (1762 * 0.08) = $141. Note the increase compared to the current cost of $57.
Delivery Costs
Unit transportation costs, using full truckloads, are estimated to be $0.11 per mile for the finished product. (The per-mile cost for delivering the finished product is greater than the per-mile cost for raw material, because fewer units of the finished product can be fit into a truck.) Delivery cost estimates for each of the markets are shown below.
The decrease in delivery costs, from $168 to $46, is the primary cost benefit provided by the new network. If this improvement is large enough to offset the cost increases in other categories, the new network can deliver higher profits.
Manufacturing Costs
An incremental overhead cost of $5,000 per month is determined to be required for the manufacturing operations in Phoenix. Since the combined average volume for the three western markets is 300 units, the absorbed cost is $17 per unit. Manufacturing variable costs are estimated to be the same (i.e., $250 per unit). Therefore, the unit manufacturing cost for the Phoenix plant is $267.
In addition, an investment of $60,000 is determined to be required to set up the new manufacturing facility.
Inventory Costs
Routing changes are almost always accompanied by a change in inventory levels in order to maintain service levels and responsiveness. In this situation, the presence of two manufacturing plants will require raw material inventory to be held in two separate locations, which has the effect of increasing overall inventory levels. These levels can be determined by estimating cycle stock requirements based on replenishment schedules and safety stock requirements by using the service level method. Safety stock is determined using the data provided below for the western region:
Demand variability = 40% (compared to 20% for consolidated demand)
Supply lead time = 1 month
Supply variability = 9 days
With this information, safety stock for a 95% service level is calculated according to the Service Level Method (Chapter 2) to be
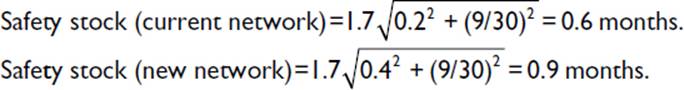
Cycle stock levels depend on shipment schedules. In the current network, higher volumes permit full truckloads twice a month. In the modified network, taking advantage of full truckload rates requires that shipments be made once a month. As a result, the total inventory is calculated to be
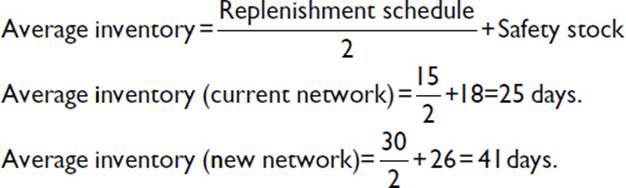
Therefore, the new configuration results in an additional 16 days of inventory. The monthly holding cost, inclusive of the cost of capital and spoilage, is determined to be 1% of the price. Therefore, the incremental holding cost is (0.01*2500*16/30) = $13.
With this information, the total cost is calculated as the sum of material, transportation, manufacturing, and inventorying costs. Figure 6-8 summarizes the costs for the western and eastern regions separately, along with cost estimates for the combined operations.
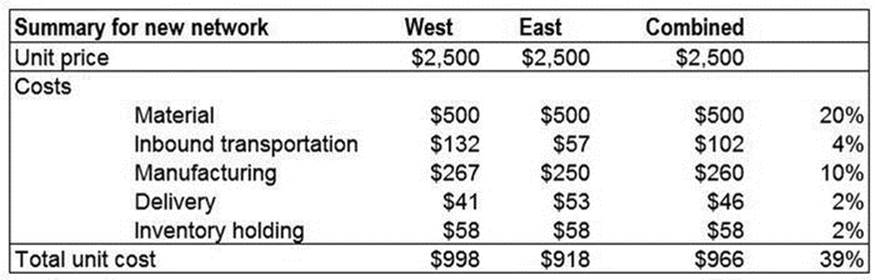
Figure 6-8. Summary of costs for the new network (Example 6-2)
As expected, the eastern region has a lower cost as compared to the western region due to proximity to the supplier and demand locations. The analysis indicates that the unit cost for the modified two-hub network results is $966, which is approximately 5% lower than the unit cost of $1,020 for the current network.
Comparison and Selection of Network Alternatives
Once costs have been calculated for the identified alternatives, it is necessary to follow a formal process for review and selection. Some of the factors that need to be considered are the following:
· Quantitative factors, including total cost, responsiveness of the supply chain, and return on investment (ROI). The cost estimate needs to include all factors that can change while comparing the different options, including transportation, manufacturing, and inventorying. Responsiveness is dictated by the time taken to fulfill demand, and the service level provided. Investment refers to the upfront cash and resource requirements for an option, along with an estimate of the return on investment.
· Qualitative factors can vary significantly across companies and industries. For several smaller- or mid-sized companies, implementation complexity and duration can prove to be the most important factors, since diverse expertise and the long project timelines are scarce. For companies on an aggressive growth path, the ability of a network configuration to support scale may be the most important factor. For other companies in a highly competitive market, matching the competition's lead time and service levels may be important. In almost all cases, mitigating risk due to the economy and environmental factors—including the risk of rising fuel and commodity prices—are important.
An illustration of this review procedure for the network configuration of Example 6-2 is shown in Figure 6-9. The view captures costs, margins, and investment details, as well as opinions and feedback regarding the options. Such a view, which combines quantitative and qualitative factors, can improve communication, facilitate the consensus process, and reduce the time to a decision.
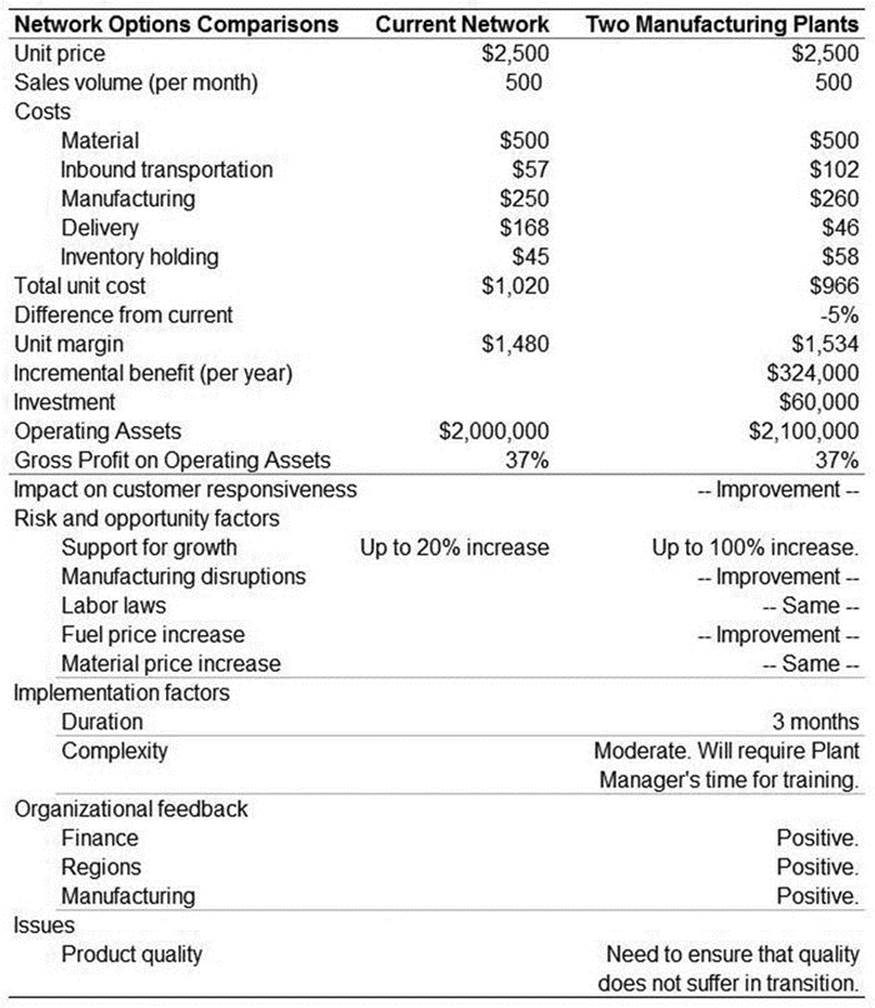
Figure 6-9. Summary of costs for the new network (Example 6-2)
Definition of an Action Plan and Execution
The time required to implement a change to the network can range from a few months to even a year or more, depending on the complexity. Therefore, it is important to define an action plan to ensure that tasks are completed on a timely basis. Some of the activities that need to be included in the plan include the following:
· Appointment of a project owner. A single person who has responsibility for the project is an extremely step. Often, this person transitions to managing operations once the changes to the network have been completed.
· Evaluation and selection of sites. If new sites are being evaluated, this step includes activities related to contacting real estate brokers, visiting sites, calculating total costs, and making decision regarding specific buildings or land.
· Evaluation and selection of partners. The availability of several third-party logistics providers results in numerous facility and transportation choices. Site visits, total costs, system sophistication, and ramp-up time are some of the considerations in evaluating the different providers.
· Placing purchase orders for machinery. Since purchase of machinery for distribution centers and manufacturing has a long lead time, it is important to research suppliers and purchase the necessary equipment well in advance.
· Appointment of staff and preparation of facility. Depending on the size of the facility that is required, it may be necessary for staff members to be hired in advance for helping prepare the facility.
· Implementation of software systems. Enterprise systems must be configured to include the new facility, new manufacturing operations, new material and transportation routings, and appropriate training for the staff.
· Preparation of the labor force and initiation of operations. The processes of specifying skill sets, roles, number of people, advertising, and hiring will need to begin a few weeks to months prior to initiation of operations, depending on the number of hires and skill sets required.
· Monitoring and adjustment of network. The efficiency of operations and the performance of the network need to be evaluated on a weekly or monthly basis, with adjustments being made to labor force, routings, work schedules, and systems as necessary.
Given the numerous tasks and people involved in such supply chain projects, delays can easily occur. The use of project management software and methods to organize tasks and milestones and aid timely execution is recommended.
Summary
Network planning is performed infrequently by a majority of companies, often annually or only after a merger or acquisition. However, given the increasingly challenging business environment due to higher distribution costs, aggressive competition and demanding customers, the need to maintain a flexible network has never been greater. Several challenges exist in making such changes, including investment and long project durations. However, a fundamental problem is the lack of awareness of the benefit due to the effort required to gather the necessary data and perform the analyses. To this end, the maintenance of a routing and cost database helps reduce the time required for gathering data and re-education and enables frequent analysis. In addition, the use of simple models as demonstrated in this chapter is recommended, because the upkeep effort is kept to a minimum. If the simple model indicates a significant benefit, a more detailed analysis can be performed.
The ready availability of outsourced providers for transportation and warehousing has allowed a greater degree of network flexibility, because routing adjustments can be made relatively quickly and without significant investments. Therefore, a quarterly review of the network and the identification of such changes can have a marked impact on profitability and responsiveness.
Given the constant change in fuel and commodities prices, a rigorous process to review the performance of the network is necessary. The gravity model, described earlier in this chapter, is a useful model for quantifying improvement or deterioration. A downward trend in the performance metric provided by the model can be used to trigger network review and further analysis.
While deciding on a network of facilities, one of the important considerations is management's projection of the state of the business in three to five years. If sales are estimated to grow aggressively, the ability to absorb additional fixed costs across higher volumes makes additional facilities more attractive. However, a challenge faced in network optimization is that a location that is ideal for one demand profile is not necessarily ideal when demand volumes are higher, as shown in Figure 6-10. In the figure, the placement of each of the facilities for the current and five-year projection is different. If the company decides to locate the facility based on current volumes, the effort and cost required to shutdown these facilities can prove to be very expensive. On the other hand, locating facilities based on future projections can result in excessive costs for the current environment. In addition, this placement can prove to be costly even in the long term if the expected demand does not materialize. When faced with such a situation, the company needs to evaluate other strategies, including the use of temporary or third-party facilities. Such facilities can be identified close to the optimal locations for current demand, and, if appropriate, transitioned to owned facilities or to a different set of third-party warehouses as volumes increase.
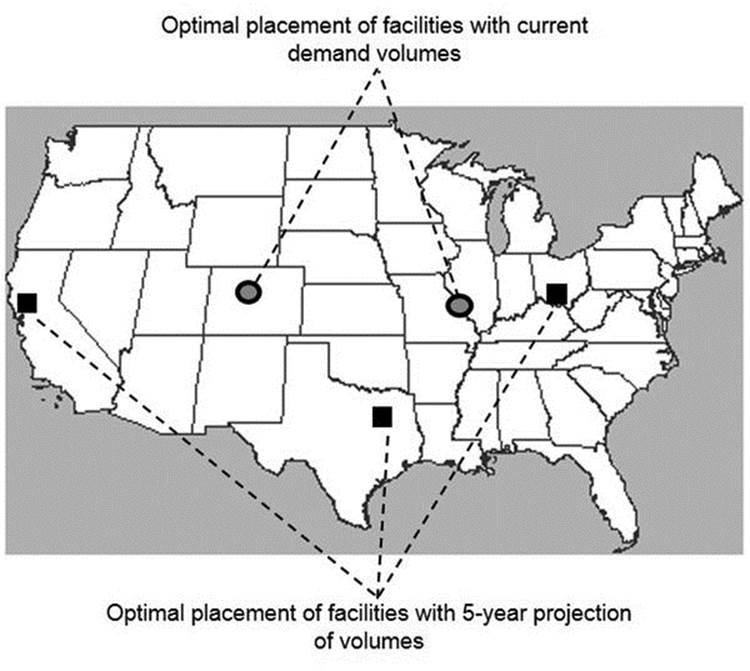
Figure 6-10. Impact of changing demand on the network
Finally, it is important for the practitioner to remain up-to-date on new offerings in the marketplace. Supply chain innovations will continue to occur as manufacturers, distributors, and logistics providers continue to increase the scope of their activities for differentiation and competitive advantage. Insufficient leverage of these new offerings will result in lost savings opportunities, as well as a loss in market share if the competition has adopted these options.
________________
1Centers of Population Computation. Geography Division, U.S. Census Bureau, U.S. Department of Commerce, 2001.