iOS 6 Application Development For Dummies (2013)
Part I. Getting Started
Chapter 2. Getting to Know the SDK
In This Chapter
![]() Understanding what’s in the SDK
Understanding what’s in the SDK
![]() Getting an overview of how programmers use Xcode for application development
Getting an overview of how programmers use Xcode for application development
![]() Taking a detailed tour of the Workspace window
Taking a detailed tour of the Workspace window
I’ll admit it. In my coding life up until quite recently, I never really considered Xcode to be a true partner in the development process. Using it was like having to include your little brother when you went out to play with your friends because your parents made you.
With Xcode 4, that has changed. Xcode, if you finesse it a bit, can make your development much easier with fewer errors. In this chapter, I take you on a guided tour of the features you’ll find in Xcode — giving you the view from 30,000 feet. If you have never used Xcode before, some of its features may not make all that much sense — but not to worry, I’ll be going through it all in detail as you use it. The point of this chapter is to provide a frame of reference as you move forward, and a complete reference for you to look back on.
Developing Using the SDK
The iOS Software Development Kit (SDK) provides support for developing iOS applications and includes the complete set of Xcode tools, compilers, and frameworks for creating applications for iOS and Mac OS X. These tools include the Xcode IDE (its integrated development environment) and the Instruments performance analysis tool, among many others.
Xcode 4.5 (the latest version) is now an application you simply download from the Mac App store. (You will need OS X 10.7.3 or better.) You should also become a registered developer. To do that, first go to http://developer.apple.com/devcenter/ios, look for (and then click) the link to become a registered developer, fill out some registration information, and then start reaping the benefits of being a registered developer, starting with access to tons of documentation sample code and a lot of other useful information). Note: If you want to actually run your application on your iPhone or iPad and submit it to the App Store, you need to join the official iOS Developer Program, which you can do right after you become a registered developer.
 Apple links do change from time to time, so if a link I provide in this book doesn’t work, you can always start at http://developer.apple.com and navigate to the iOS Dev Center from there.
Xcode 4 is the latest iteration of Apple’s IDE, a complete toolset for building Mac OS X and iOS applications. With Xcode 4, you can develop applications that run on any iPhone, iPad, or iPod touch running iOS. You can also test your applications using the included iOS Simulator, which supports iOS 5 and iOS 6.
The Xcode IDE includes a powerful Source editor, a sophisticated graphical user interface editor, and many other features, including source code repository management. Moreover, as you code, Xcode can identify mistakes in both syntax and logic, and even suggest fixes.
Xcode includes everything you need to create your app — which is both the good news and the bad news. The good news is that it has everything you need. The bad news is that because it has everything you need, it can be pretty complex. But again, not to worry: I guide you through everything involved in creating an app, step by step.
To start with, I give you an overview of Xcode and how you’ll use it to develop your app. As you move from step to step, I provide more detail on how to use Xcode to specifically do what you need to do in any given step.
Using Xcode to Develop an App
To develop an iPhone, iPod touch, or iPad app, you have to work within the context of an Xcode project. Although I don’t explain any particular development methodologies in this book, I can tell you that Xcode supports the following activities that are parts of developing your application:
![]() Creating an Xcode project
Creating an Xcode project
![]() Developing the application (designing the user interface using a storyboard, coding, and running and debugging the code)
Developing the application (designing the user interface using a storyboard, coding, and running and debugging the code)
![]() Tuning application performance
Tuning application performance
![]() Distributing the application
Distributing the application
The following sections tell you more about each of these tasks.
Creating an Xcode project
To develop an iOS application, you start by creating an Xcode project. A project contains all the elements needed to create an application, including the source files, a graphical representation of the user interface, and build settings needed to build your application. You work on your project in the Workspace window, which allows you to create all of these elements as well as build, run, debug, and submit your application to the App Store.
Developing the application
You have a lot to do to develop an application. You need to design the user experience and then implement what you came up with as a user interface. You need to write code to implement the features of the app. You also need to test and debug the app.
Designing the user interface using a storyboard
Xcode’s Interface Builder is the editor you use to assemble your application’s user interface with the help of preconfigured objects found in the Library. The objects include windows, controls (such as switches, text fields, and buttons), and the views you’ll use, such as Image, Web, and Table views. The Interface Builder editor allows you to add objects, configure their properties, and create connections not only between user interface objects, but also between user interface objects and your code.
 When you use a storyboard (which you do in this book), most of if not all your screens end up being displayed in the storyboard, and Interface Builder saves your storyboard in a storyboard file (with the .storyboard extension). When you don’t use a storyboard, each screen is saved separately as a nib file (with the .xib extension). Either way, these files contain all the information iOS needs to reconstitute the user interface objects in your application at runtime.
Interface Builder saves you time and effort when it comes to creating your application’s user interface. You don’t have to code each object (thereby saving you a lot of work), and what’s more, because Interface Builder is a visual editor, you get to see what your application’s user interface will look like at runtime.
Coding
To code, you use the Source Code editor, which supports features such as code completion, syntax-aware indentation, and source code folding (to hide “code blocks” temporarily). You can get context-based help to assist you, and if you need information about a particular symbol, you can either get a summary of a symbol’s documentation directly in the editor, or you can opt for more extensive documentation in the Organizer (more on the Organizer later).
Xcode’s Live Issues and Fix-it features work together to point out mistakes as you enter your code and offer to fix those mistakes for you.
Running and debugging
When you run your application to debug or test it, you can run it in the iOS Simulator on your Mac and then on an iOS-based device (if you’re in the developer program). Using the simulator, you can make sure your application behaves the way you want. You can also get debugging information — as you run — in the Debug area. By running your app on a device connected to your Mac (still using the debugger, if you like), you can observe the actual user experience and see how the app will perform.
Tuning application performance
The Instruments application enables you to analyze the performance of your application as it runs in the simulator or on a device. The Instruments application gathers data from your running application and presents that data in a graphical timeline.
Among other measurements, you can gather data about your application’s memory usage, disk activity, network activity, and graphics performance. This data enables you to analyze your application’s performance and identify performance and resource usage problems.
In-depth coverage of Instruments is beyond the scope of this book.
Distributing the application
Xcode provides various kinds of application distribution, including:
![]() Ad Hoc Distribution for testing on up to 100 iOS devices.
Ad Hoc Distribution for testing on up to 100 iOS devices.
![]() The App Store for distributing to hundreds of millions of iOS device users. You can give your apps away for free or let Apple sell them for you.
The App Store for distributing to hundreds of millions of iOS device users. You can give your apps away for free or let Apple sell them for you.
![]() Custom B2B Apps for distributing business-to-business apps directly to your business customers who have a Volume Purchase Program account.
Custom B2B Apps for distributing business-to-business apps directly to your business customers who have a Volume Purchase Program account.
You create an archive of your application that contains debugging information, making it easier to track down bugs reported by testers (and users) of your application. When your application is ready to go, you submit it to the App Store. (Before you submit your app to the store, you can even run some of the same software-validation procedures on your applications that Apple does passing these tests makes your application’s approval process as fast as possible).
The Workspace Window
Command central for Xcode is the Workspace window, where you’ll do all the things you need to do to develop your app.
In this section, I present only an overview — more or less the map of what’s in the Workspace window and what each bar and button is and does. I came up with this as a way to provide a quick reference to the Workspace window so you can see all its elements, including the various bars and buttons and what they do.
Figure 2-1 shows a “map” of the window. (If you like, bookmark this page so you can refer to this figure at any time when reading the book.) At first glance, it may seem overwhelming, but take a deep breath and don’t worry: I explain each part. As I take you through using Xcode to develop your app, I go into more detail as needed. So for now, take a quick read through the upcoming sections just to familiarize yourself with the lay of the land and then return to Figure 2-1 as needed for quick reference.
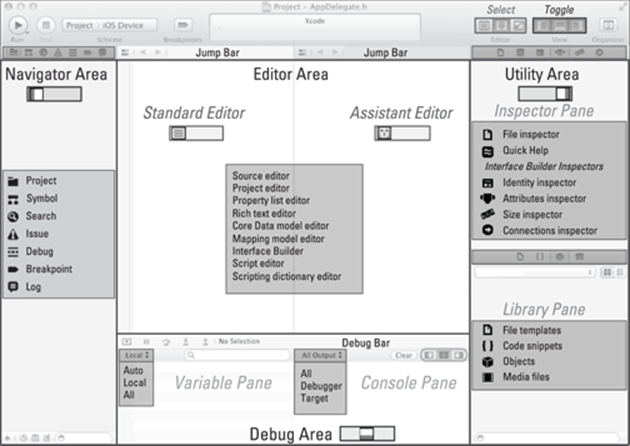
Figure 2-1: The Xcode Workspace window.
Although I have added shadings to the Workspace window components in this chapter for easy reference, figures in the remainder of the book show the components as they appear on your screen.
The Workspace window consists of
![]() Workspace areas
Workspace areas
![]() The toolbar
The toolbar
![]() An optional tab bar
An optional tab bar
The following sections describe each of these elements — the heart of Xcode.
Workspace areas
The Workspace is divided into four areas, as follows:
![]() Editor area (always shown)
Editor area (always shown)
![]() Navigator area
Navigator area
![]() Utility area
Utility area
![]() Debug area
Debug area
You can configure the Workspace area in a number of ways. Right off the bat, you can choose to hide and/or show various areas in various combinations. (Note that the Editor area is always present.). The Debug and Utility areas are already configured with panes, but in the Debug area, you can select the pane configuration.
Editor area (always present)
The Editor area is always present. If you want, you can show or hide various “editors” contained within the Editor area; you do so using the Editor selector, the group of buttons in the toolbar you can see in Figure 2-2.
![]()
Figure 2-2: The Editor selector.
The term editor here is really a misnomer, even though that’s the term used in the documentation. The “editors” you can select in the Editor area are really editor area configurations, within which you use the content editors available to you. (See the “Editor area content editors” section, later in this chapter, for more on this distinction.)
The editors (configurations) you have available are as follows:

![]() Standard editor: The button for this Editor area configuration is on the left side of the Editor selector. The Standard editor displays a single pane for editing and is always shown.
Standard editor: The button for this Editor area configuration is on the left side of the Editor selector. The Standard editor displays a single pane for editing and is always shown.

![]() Assistant editor: Select this Editor area (configuration) using the center button. This adds an additional pane to the Editor area, with a content editor in each. The additional Assistant pane has some navigation features that I explain in Chapters 7 and 9. You can further split this pane into two panes.
Assistant editor: Select this Editor area (configuration) using the center button. This adds an additional pane to the Editor area, with a content editor in each. The additional Assistant pane has some navigation features that I explain in Chapters 7 and 9. You can further split this pane into two panes.

![]() Version editor: Open this editor using the right button on the Editor selector. This enables you to compare two different versions of files you have saved in repositories. (Repositories and the Version editor are beyond the scope of this book.)
Version editor: Open this editor using the right button on the Editor selector. This enables you to compare two different versions of files you have saved in repositories. (Repositories and the Version editor are beyond the scope of this book.)
I later explain the tasks you can perform within these areas.
Additional areas to view as needed
You use the View selector (see Figure 2-3) to toggle between showing and hiding any of the optional areas. By optional, I mean that you can open and close these areas as needed. These areas are as follows:
![]()
Figure 2-3: The View selector.

![]() Navigator area (left button): No further configuration is possible (you don’t divide this area into other views).
Navigator area (left button): No further configuration is possible (you don’t divide this area into other views).

![]() Debug area (center button): Displays various panes depending on what you need to see (the Console pane, which displays debugging information or program output for example, or the Variables pane which displays your program’s variables and their values); you change panes using the Debug area Scope bar, shown in Figure 2-4.
Debug area (center button): Displays various panes depending on what you need to see (the Console pane, which displays debugging information or program output for example, or the Variables pane which displays your program’s variables and their values); you change panes using the Debug area Scope bar, shown in Figure 2-4.
![]()
Figure 2-4: The Debug area Scope bar.
The Debug area Scope bar toggles from one to another of the following:
• Variables pane only (left button)
• Both Variables and Console panes (center button)
• Console pane only (right button)

![]() Utility area (right button): Is further configured with two panes (either can be expanded to hide the other):
Utility area (right button): Is further configured with two panes (either can be expanded to hide the other):
• Inspector pane
• Library pane
I explain what you see in each of those panes when I explain the Utility area section, later in the chapter.
When you hover your mouse pointer over a toolbar button, a tooltip describes its function.
Displaying an area’s content
Each area displays certain content, and each area has its own way of displaying its content:
![]() The Navigator area has navigators.
The Navigator area has navigators.
![]() The Editor area has content editors.
The Editor area has content editors.
![]() The Utility area has
The Utility area has
• Quick Help or Inspectors in the Inspector/Quick Help pane.
• Libraries in the Library pane.
![]() The Debug area has
The Debug area has
• Debugger variables in the Variables pane.
• Debugger output in the Console pane.
The following sections tell you about these areas in more detail.
Navigator area navigators
The Navigator area contains a host of navigators that organize the tasks and components you use within your Xcode project. You use a Navigator selector bar to select the navigator you need. Figure 2-5 shows the various navigators you can choose from, and the following bullet list explains what each navigator does:
![]()
Figure 2-5: The Navigator selector.

![]() Project navigator: Here’s where you manage all the files in your project. You can add files, delete files, and even organize your files by placing them into groups. Selecting a file in the Project navigator launches the appropriate editor in the Editor area.
Project navigator: Here’s where you manage all the files in your project. You can add files, delete files, and even organize your files by placing them into groups. Selecting a file in the Project navigator launches the appropriate editor in the Editor area.

![]() Symbol navigator: Lets you zero in on a particular symbol — an element such as a variable, method, or function name — in your project. Selecting a symbol highlights it in the editor.
Symbol navigator: Lets you zero in on a particular symbol — an element such as a variable, method, or function name — in your project. Selecting a symbol highlights it in the editor.

![]() Search navigator: Finds any string within your projects and frameworks.
Search navigator: Finds any string within your projects and frameworks.

![]() Issue navigator: Displays issues such as diagnostics, warnings, and errors that arise when you’re coding and building your project.
Issue navigator: Displays issues such as diagnostics, warnings, and errors that arise when you’re coding and building your project.

![]() Debug navigator: Displays the call stack — information about what method has called what method — during program execution.
Debug navigator: Displays the call stack — information about what method has called what method — during program execution.

![]() Breakpoint navigator: Manages and edits the breakpoints — markers you add to your code that stop program execution at a certain point in your program — in your project or Workspace.
Breakpoint navigator: Manages and edits the breakpoints — markers you add to your code that stop program execution at a certain point in your program — in your project or Workspace.

![]() Log navigator: Examines the logs that Xcode generates when you run and debug your application.
Log navigator: Examines the logs that Xcode generates when you run and debug your application.
Editor area content editors
The Editor area has a number of editors you use to edit specific content. Content editors are context based, meaning that the selection you make in a Navigator or Editor jump bar — the toolbar that appears at the top of each Editor area pane and is used to navigate through the files and symbols in your project — determines the Content editor. The following bullet list names each Content editor and outlines the tasks associated with each one (note that not all tasks are applicable to iOS application development):
![]() Source editor: Write and edit your source code; set, enable, or disable breakpoints; and control program execution.
Source editor: Write and edit your source code; set, enable, or disable breakpoints; and control program execution.
![]() Project editor: View and edit settings such as build options, target architectures, and code signing.
Project editor: View and edit settings such as build options, target architectures, and code signing.
![]() Interface Builder: Graphically create and edit user interface files in storyboards (and XIB files if you are not using a storyboard).
Interface Builder: Graphically create and edit user interface files in storyboards (and XIB files if you are not using a storyboard).
![]() Property list editor: View and edit various types of small, highly structured property lists (plists). (You’ll use one for some of your program’s data.)
Property list editor: View and edit various types of small, highly structured property lists (plists). (You’ll use one for some of your program’s data.)
![]() Rich text editor: View and edit rich text (.rtf) files, much as you would with Text Edit.
Rich text editor: View and edit rich text (.rtf) files, much as you would with Text Edit.
![]() Core Data model editor: Implement or modify a Core Data model. (iOS’s persistent object store is beyond the scope of this book).
Core Data model editor: Implement or modify a Core Data model. (iOS’s persistent object store is beyond the scope of this book).
![]() Mapping model editor: Graphically create and edit a mapping between an old Core Data store and a new one.
Mapping model editor: Graphically create and edit a mapping between an old Core Data store and a new one.
![]() Script editor: Create and edit AppleScript script files.
Script editor: Create and edit AppleScript script files.
![]() Scripting dictionary editor: Create and edit the scripting definition (.sdef) file — used by AppleScript — for your application.
Scripting dictionary editor: Create and edit the scripting definition (.sdef) file — used by AppleScript — for your application.
![]() Viewer: Display files for which there is no editor (some audio, video, and graphics files, for example) using the same Quick Look facility used by the Finder.
Viewer: Display files for which there is no editor (some audio, video, and graphics files, for example) using the same Quick Look facility used by the Finder.
Utility area
The Utility area has two panes: the Inspector pane and the Library pane. You can expand either pane to hide the other.
When working within the Inspector pane, you click a button in the Inspector selector (shown in Figure 2-6) to select a particular inspector. (Note that a previous navigator selection or Content editor selection may determine which inspectors are available.) Your choices are as follows:
![]()
Figure 2-6: The Inspector selector.

![]() File inspector: For viewing (and managing) file metadata, such as a filename, type, and path.
File inspector: For viewing (and managing) file metadata, such as a filename, type, and path.

![]() Quick Help (second button): For viewing (applicable) details about what has been selected in an editor, such as an abstract or concise description, where and how it is declared, and selection-based information such as an element’s scope, the parameters it takes, its platform and architecture availability, references, sample code, and so on. The following selections are supported:
Quick Help (second button): For viewing (applicable) details about what has been selected in an editor, such as an abstract or concise description, where and how it is declared, and selection-based information such as an element’s scope, the parameters it takes, its platform and architecture availability, references, sample code, and so on. The following selections are supported:
• Symbols, in the Source editor
• Interface objects, in Interface Builder
• Build settings, in the Project editor
Additional inspectors are available in some editors; for example, Interface Builder offers the following:

![]() Identity inspector: For viewing (and managing) object metadata such as an object’s class, runtime attributes, label, and so forth.
Identity inspector: For viewing (and managing) object metadata such as an object’s class, runtime attributes, label, and so forth.

![]() Attributes inspector: For configuring the attributes specific to the selected interface object. For example, some text field attributes include text alignment and color, border type, and editability.
Attributes inspector: For configuring the attributes specific to the selected interface object. For example, some text field attributes include text alignment and color, border type, and editability.

![]() Size inspector: For specifying characteristics such as the initial size and position of an interface object, its minimum and maximum sizes, and various autosizing rules for the object.
Size inspector: For specifying characteristics such as the initial size and position of an interface object, its minimum and maximum sizes, and various autosizing rules for the object.

![]() Connections inspector: View the outlets and actions for an interface object, make new connections, and delete existing connections. (Connections “connect” your program code to user interface objects you create in Interface Builder.)
Connections inspector: View the outlets and actions for an interface object, make new connections, and delete existing connections. (Connections “connect” your program code to user interface objects you create in Interface Builder.)
When working within the Library pane, you click a button in the Library selector bar (shown in Figure 2-7) to select a library of resources you can use in your project. The following libraries are available:
![]()
Figure 2-7: The Library selector.

![]() File templates: These templates are for the common types of files listed as choices in the New File menu. To add a file of that type to your project, drag it from the library to the Project navigator.
File templates: These templates are for the common types of files listed as choices in the New File menu. To add a file of that type to your project, drag it from the library to the Project navigator.

![]() Code snippets: These are short pieces of source code for use in your application. To use one, drag it directly into your source code file.
Code snippets: These are short pieces of source code for use in your application. To use one, drag it directly into your source code file.

![]() Objects: This library contains the kinds of interface objects you’d use to make up your user interface. To add one to a view, drag it directly into your storyboard or nib file in the Interface Builder editor.
Objects: This library contains the kinds of interface objects you’d use to make up your user interface. To add one to a view, drag it directly into your storyboard or nib file in the Interface Builder editor.

![]() Media files: This library contains a whole slew of graphics, icons, and sound files. To use one, drag it directly to your storyboard or nib file in the Interface Builder editor.
Media files: This library contains a whole slew of graphics, icons, and sound files. To use one, drag it directly to your storyboard or nib file in the Interface Builder editor.
Debug area
The Debug area is where you’d try to track down the bugs in your code and squash them. A selection in the Debug area Scope bar (refer to Figure 2-4) determines the information the debugger displays:
![]() Variables Pane Only: Left button
Variables Pane Only: Left button
![]() Both Variables and Console Panes: Center button
Both Variables and Console Panes: Center button
![]() Console Pane Only: Right button
Console Pane Only: Right button
![]() The pop-up menu in the Variables Pane Scope bar lets you display in the following ways:
The pop-up menu in the Variables Pane Scope bar lets you display in the following ways:
![]() Auto: Display recently accessed variables.
Auto: Display recently accessed variables.
![]() Local: Display local variables.
Local: Display local variables.
![]() All: Display all variables and registers.
All: Display all variables and registers.
![]() The pop-up menu in the Console Pane Scope bar lets you display
The pop-up menu in the Console Pane Scope bar lets you display
![]() All Output: Target and debugger output
All Output: Target and debugger output
![]() Debugger Output: Debugger output only
Debugger Output: Debugger output only
![]() Target Output: Target output only
Target Output: Target output only
You also find other controls and filters for what is displayed; explore them on your own.
Xcode has extensive contextual help articles that you can view by Control-clicking in the Workspace window in the context you need help on.
The toolbar and Tab bar
The toolbar (see Figure 2-8) includes Workspace-level tools for managing and running schemes (instructions on how to build your application), viewing the progress of (executing) tasks, and configuring the Workspace window. That’s a lot of tools, so to keep things straight, it’s best to think of the toolbar as actually having three parts: A Flow control part, an Activity Viewer part, and a Workspace Configuration part.
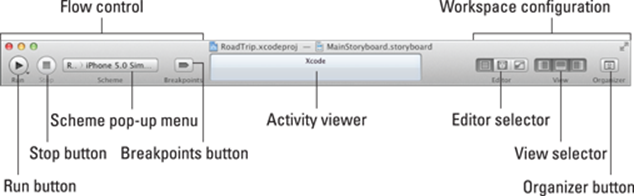
Figure 2-8: The toolbar with the Tab bar.
Flow controls are for defining, choosing, running, and stopping projects. A scheme defines characteristics such as build targets, build configurations, and the executable environment for the product to be built in.
The Flow controls are as follows:
![]() Run button: Clicking the Run button builds and runs the targets. (A target, in this context, is the product you want to build as well as the instructions for building that product from a set of files in a project or Workspace for the currently selected scheme). Pressing and holding the mouse button opens a menu (which is also available in the Product menu) that allows you to run, test, profile, or analyze your application.
Run button: Clicking the Run button builds and runs the targets. (A target, in this context, is the product you want to build as well as the instructions for building that product from a set of files in a project or Workspace for the currently selected scheme). Pressing and holding the mouse button opens a menu (which is also available in the Product menu) that allows you to run, test, profile, or analyze your application.
![]() Stop button: Terminates your executing application in either the Simulator or the device.
Stop button: Terminates your executing application in either the Simulator or the device.
![]() Scheme menu: Lets you select the scheme and build destination to use.
Scheme menu: Lets you select the scheme and build destination to use.
![]() Breakpoints button: Activates or deactivates all breakpoints.
Breakpoints button: Activates or deactivates all breakpoints.
The Activity Viewer part of the toolbar shows the progress of tasks currently executing. This viewer displays status messages, build progress, and other information about your project. Click the Issues icon in the Activity viewer to open the Issue navigator (explained earlier in this chapter, in the “Navigator area navigators” section).
You use the final part of the toolbar — the Workspace Configuration part — to configure the Xcode Workspace window to suit your needs. You can use these controls to select an editor type, show or hide optional view areas, and open the Organizer window. (See the “Displaying an area’s content” section, earlier in the chapter, for more on your choices here.)
The Tab bar is great for keeping track of where you’ve been and what you might want to go back to. Note, however, that showing the Tab bar is optional. If you decide that the Tab bar is something you just can’t do without, choose View⇒Show Tab Bar from Xcode’s main menu. You can reorder tabs, close them individually, or drag them out of the bar to create a new window.
If you lose the toolbar (or Tab bar), you can always add it back to any window by selecting View⇒Show Toolbar (or View⇒Show Tab Bar). The View menu also allows you to configure the Workspace window.
The Organizer window
The Organizer window (see Figure 2-9) enables you to do the supplemental tasks associated with development, such as accessing documentation and managing devices, archives, and project-related metadata.
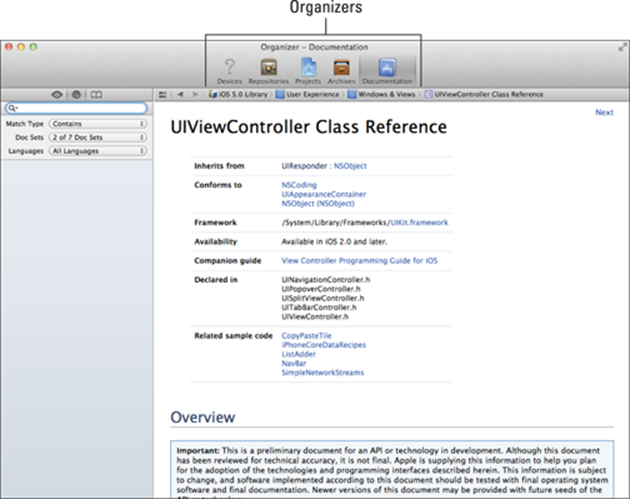
Figure 2-9: The Organizer window.
To display the Organizer window, click the Organizer button on the Workspace window toolbar (refer to Figure 2-8) or choose Window⇒Organizer from Xcode’s main menu. The Organizer window includes five individual organizers, which enable you to do the following:
![]() Devices organizer: Provision a device, manage your developer profile, install iOS on the device, and manage your application and data on a device.
Devices organizer: Provision a device, manage your developer profile, install iOS on the device, and manage your application and data on a device.
![]() Repositories organizer: Create, view, and manage Git and Subversion repositories for your Workspace. These are where your various project versions are managed.
Repositories organizer: Create, view, and manage Git and Subversion repositories for your Workspace. These are where your various project versions are managed.
![]() Projects organizer: Lets you locate your projects without having to remember where they are in the file system) and offers snapshots — a Save feature that enables you to save different versions of your projects).
Projects organizer: Lets you locate your projects without having to remember where they are in the file system) and offers snapshots — a Save feature that enables you to save different versions of your projects).
![]() Archives organizer: Submit your application to the App Store or testers and manage your product archives.
Archives organizer: Submit your application to the App Store or testers and manage your product archives.
![]() Documentation organizer: Access documentation and sample code from within Xcode.
Documentation organizer: Access documentation and sample code from within Xcode.
Each of these organizers includes task-oriented contextual help that you get by Control-clicking an organizer’s content pane.