C++ All-in-One For Dummies (2009)
Book III
Fixing Problems
Chapter 2: Debugging a Program
In This Chapter
Working with debuggers
Using the CodeBlocks debugger
Tracing through a program and in and out of functions
Using other debuggers
Getting seriously advanced debuggers
In this chapter, we talk about how you can use a debugger to track down problems and bugs in your program. Sooner or later, things don’t work the way you planned them. In this case, you have several plans of attack. One plan involves a hammer and the computer, but we don’t recommend that one. Instead, we suggest using a debugger to try to fix the program.
Programming with Debuggers
A debugger is a special tool that you use for tracing line by line through your program. Take a look at Listing 2-1. This is just a basic program with a main and a couple of functions that we use to demonstrate the debugger.
Listing 2-1: Tracing a Simple Program
#include <iostream>
using namespace std;
int CountRabbits(int original)
{
int result = original * 2;
result = result + 10;
result = result * 4;
cout << “Calculating “ << result << endl;
return result * 10;
}
int CountAntelopes(int original)
{
int result = original + 10;
result = result - 2;
cout << “Calculating “ << result << endl;
return result;
}
int main()
{
int rabbits = 5;
int antelopes = 5;
rabbits = CountRabbits(rabbits);
cout << “Rabbits now at “ << rabbits << endl;
antelopes = CountAntelopes(antelopes);
cout << “Antelopes now at “ << antelopes << endl;
// system(“PAUSE”); // add this for Windows
return 0;
}
When you type and run this program, you see the following output:
Calculating 80
Rabbits now at 800
Calculating 13
Antelopes now at 13
Now look closely at main and follow it through, line by line. The first thing main does is declare a couple of integers. Then main calls into the CountRabbits functions. The CountRabbits function declares an integer and does a few lines of calculations. Then theCountRabbits function prints a message. Finally it returns. Once back in main, the program prints another message and then calls into the CountAntelopes function. This function also declares an integer, does some calculations, prints a message, and then returns. Back in main, the program prints another message, and the program finally finishes.
What we just gave you is a linear description of the entire process of this program. You can see these same steps by using a debugger. With a debugger, you see the computer going line by line through your code. A debugger performs the first line of your program and then waits for you to tell it to perform the next line — then the next, and the next, and so on, until the end of the program.
 In this example, we use the debugger that comes with the CodeBlocks application. If you prefer to use some other debuggers, we recommend that, for most of this chapter, you at least try the CodeBlocks debugger. It is a nice tool, and we think that you’ll be happy with it. But besides that, it allows you to follow through the examples we give. Then you can return to whatever other tool you’re using.
 You must know one important aspect before using a debugger. For the debugger to understand your code, you must compile it with debugging information. The compiler adds extra information into the final executable so that the debugger can locate your source code and variable information. Here’s how you turn on debug information:
Adding debug and symbol information
When you compile with debug information, you are adding debug and symbol information to the final executable file. This information includes data about the source-code files, including the line numbers and the variable names. This is the primary difference between a debug version and a release version of your product: People typically don’t include debug and symbol information in a version of the product that they release to the general public. One reason is that including it makes it too easy for competitors and hackers to reverse-engineer the product. (Another reason is that including the debug and symbol information makes the application run slower and consume more system resources.) However, the actual source code is not in the debug and symbol information; that stays in the source-code file. The debug information, instead, just contains line numbers, which serve as references (pointers, if you will!) into the source-code file. So hackers and competitors won’t have the complete source to your program, but they will have variable names and other information that could make their job easier (and yours harder).
♦ CodeBlocks: Choose Debug in the Build Target drop-down list box.
♦ Dev-C++ 5.0: Open the project and choose Tools⇒Compiler Options. In the Linker tab, make sure that Generate Debugging Information is turned on.
♦ gcc under MinGW and Cygwin: Add the -g option to the compiler. You will probably do this inside a Makefile.
After you change the compiler options to generate debug information, you must rebuild your project. The reason is that the compiler and linker must regenerate object files and executable files with the debug information.
Running the debugger
After you have rebuilt your project, you can run the debugger. To start the debugger, click Debug/Continue, choose Debug⇒Start, or press F8. (If you click Run, the application runs as normal without entering debug mode.) When you start the debugger, you should see a screen like that shown in Figure 2-1. (You also get a console window behind that screen. This console window contains the output for the program you are debugging.)
Figure 2-1 shows two special features you need to know to debug programs. The first is the red circle and the second is the yellow triangle. The red circle is a breakpoint — a place where you want the debugger to stop. You add breakpoints to the Editing window by clicking the left side next to the instruction where you want to stop. When you click that spot again, the red circle goes away, showing that you have cleared the breakpoint. You can place as many breakpoints as you want in the application, but you can place breakpoints only on instructions.
Figure 2-1: The main CodeBlocks window shows your source code.
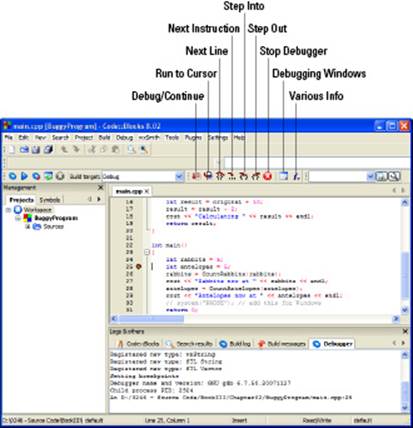
The yellow triangle is the instruction pointer, which shows the instruction that the debugger will execute next. As you tell the debugger to execute instructions, the yellow triangle moves. Whenever you start the application in debug mode, the yellow pointer automatically stops at each breakpoint. Figure 2-1 shows how the debugger looks when the yellow triangle stops at a breakpoint.
When you start the debugger again by clicking Debug/Continue, execution begins as if the application is in normal run mode until the debugger encounters another breakpoint. If the debugger doesn’t encounter a breakpoint, the dialog box closes, and the program returns to the source screen.
If you don’t set any breakpoints and try to debug your program, it will run without letting you trace through the code. That is, the program will run as if you’re not running it in the debugger.
Look at the Debugger tab of the Logs and Others window shown in Figure 2-1. This tab contains debugging messages from your application. Whenever you see the At message, you know that the debugger has stopped at a particular location. The remainder of the message tells you where the debugger has stopped. In Figure 2-1, the debugger has stopped at line 25 of the D:/0246 - Source Code/BookIII/Chapter02/BuggyProgram/main.cpp file.
So go ahead and run the program. Begin by setting a breakpoint at line 22, the int main() entry. Click Debug/Continue, choose Debug⇒Start, or press F8 to start the debugger. You’ll see a number of messages appear in the Debugger tab and then you’ll see the At message when the debugger stops at line 23. (If you spaced your program slightly different from the way we did in Listing 2-1, you may see a slightly different line number.) The yellow triangle should appear on line 23, which contains a curly bracket, meaning that the program is stopped at that line. The instruction pointer stopped at the curly bracket because it is the first instruction after the main() entry.
Click Next Line, which is the third button on the Debugger toolbar. The button you want is the one with an icon with two braces, {}, and an arrow pointing over it from the left side to the right side. (You can also press F7.) The yellow triangle (instruction pointer) moves to the first assignment statement on line 24, which is
int rabbits = 5;
Click Next Line. When you click the button, the instruction pointer advances to the next line. The computer just performed the first line in main(), and next the computer will perform the second line in main(), which is this:
int antelopes = 5;
Click Next Line again. Now the instruction pointer is on the third line of main(), which looks like this:
rabbits = CountRabbits(rabbits);
This third line of main() is a function call, and now you have a choice. (Don’t click Next Line!) You can either tell the computer to just perform what’s inside this function without stopping on each line for you to see, or you can “step into it” and see the individual lines.
Click the fifth button from the left, the one called Step Into, which shows two braces, {}, and an arrow going from the left into them. (Or press Shift+F7.) When you do, the instruction pointer moves into the CountRabbits() function. The highlight will be on the first line in that function:
int result = original * 2;
When the highlight moved into the function, the computer stepped into the function. Now think about the symbol for the icon that caused this to happen: The icon has two braces, {}, and an arrow pointing into them. The two braces represent a function. (They’re supposed to be the open and closing brace for the function.) And the arrow points into the middle of the braces, which means that you’re going to step into the function. That’s the idea behind the odd symbols. The one you’ve been clicking before, the Next Line icon that has an arrow going over, means steppingover the function.
Now, before stepping into this function, because you were clicking lines that were not functions but just individual lines, you used the Next Line (that is, the step over) button. But you could have used either the Next Line button or the Step Into button, because stepping into a functiondoesn’t bear much meaning on statements that are not functions.
Normally, we use the Next Line button by default and choose the Step Into button only when we specifically want to go into a function. The reason is that some lines of code that may not appear to be functions really are. For example, cout << “a”; is, in fact, a function, and you might not want to step into that code, because either the source code for it might not be present or you simply might not be interested in the details of the function.
It’s time to see how these debugging features work. The following procedure takes you through the debugging process so that you can see the CodeBlocks debugger in action:
1. Click Next Line three times until the instruction pointer appears on the cout line:
cout << “Calculating “ << result << endl;
This line writes output to the console. Remember, in addition to the main CodeBlocks window, you also have a console window. That’s where the output from this line goes.
2. Click Next Line.
3. Click the console window.
You see the results of the cout statement:
Calculating 80.
Then the instruction pointer lands on the return statement.
4. Click Next Line again.
The instruction pointer is on the closing brace of the function. Note that CodeBlocks highlights both the opening brace and the closing brace in blue. This feature helps you see where a function begins and ends in the Integrated Development Environment (IDE).
5. Click Next Line yet again.
The instruction pointer returns to main(), on the line following the call to the CountRabbits() function:
cout << “Rabbits now at “ << rabbits << endl;
6. Click Next Line again.
The instruction pointer is on the second function call:
antelopes = CountAntelopes(antelopes);
7. But this time, instead of stepping into the function, just press Next Line to step over it.
The instruction pointer advances to the next line, which is this:
cout << “Antelopes now at “ << antelopes << endl;
Take a look at the console. The CountAntelopes() function itself contained a call to cout. You can see on the console that this cout line did its stuff:
Calculating 13
You saw the output from the CountAntelopes() function because, although you stepped over the function, you didn’t actually skip it: The function ran in its entirety during that one click of the Next button. The debugger just didn’t go through it line by line, that’s all.
8. Click Next Line to do the final cout line.
Your entire output now looks like this:
Calculating 80
Rabbits now at 800
Calculating 13
Antelopes now at 13
and the instruction pointer ends on the final return statement:
return 0;
9. Click Next Line one more time and the highlight is on the closing brace of main().
Now things get just a little strange. Unbeknownst to us, there’s really more code than we see. When you compile and link your program, the linker includes some special startup code that calls your main() function.
10. Click Next Line one more time, and you are timewarped out of your source file and into some assembly language code. The Debugger window shows the following message:
In __mingw_CRTStartup () ()
11. To see the assembly language code, you must click a new button, Next Instruction (four buttons from the left on the Debugger toolbar).
CodeBlocks automatically displays a new window called Disassembly, as shown in Figure 2-2. The numbers in your figure may differ from ours, but the code is the same.
Figure 2-2: The Disassembly window displays the assembly language version of your code.
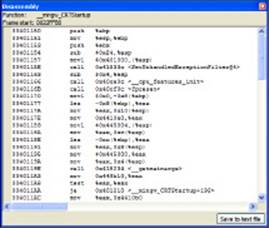
Yuck. This is assembly, a human-readable form of the language that the computer understands. You don’t have to know what all this means, but you can probably figure out that the line
(hexadecimal number) call (another hexadecimal number) <__main>
is where this code stuff calls into your main.
12. To get out of this, just click the first button (called Debug/Continue) or the sixth button (called Step Out), the one with an arrow pointing to the left of the two braces, {}. (Or just press Ctrl+F7 or Ctrl+Shift+F7, respectively.)
Clicking Debug/Continue causes the program to run to the real end of your program (or the next breakpoint) and then finish. Clicking Step Out tells the debugger to step out of the current function, which in this case is the same as running to the end of the program.
13. If you want to avoid going into the crazy assembly-code stuff, you can avoid it by clicking Debug/Continue when you get to the final return line of your program.
And that’s how you trace through your program line by line. But you can do a lot more with the program when you’re tracing through it. You can look at the values in your variables, you can change the values of the variables, and you can get a list of all the function calls that led up to the current position in your program. You can do plenty, and we explain all this in the remainder of this minibook.
Recognizing the parts of the CodeBlocks debugger
The CodeBlocks debugger displays the Debugger toolbar whenever you debug an application. The previous sections of this chapter have discussed many of the buttons on the Debugger toolbar: Debug/Continue, Next Line, Next Instruction, Step Into, and Step Out. However, the toolbar contains a number of other interesting buttons you should know about.
Sometimes you examine a piece of code in the editor and want to see what the variables look like when you get to that point. To see what happens, place your text cursor at the place you want to stop (using only the mouse cursor isn’t enough) and click Run to Cursor (the second button on the Debugger toolbar). The debugger stops at the line where your cursor is resting. In this case, the text cursor acts as a kind of breakpoint for the debugger.
After you debug your application for a while and locate problems you want to fix, you may not want to run the rest of the application. When this situation occurs, simply click Stop Debugger (the button that looks like a stop sign). The debugger stops immediately. You can make any required changes and restart the debugger as normal.
CodeBlocks provides access to a number of debugging windows. In fact, you saw one of these windows previously in the chapter — the Disassembly window. You access these windows by clicking the Debugging Windows button (the one that looks like a window, to the right of the stop sign buttons). Later chapters in this minibook describe these windows in detail. Here is a quick summary of the windows for now:
♦ Breakpoints: Presents all the breakpoints you’ve set in your application. Double-clicking a breakpoint entry takes you to that breakpoint in the editor. You can use this window also to remove one or more breakpoints.
♦ Call Stack: Displays the function calls used to get to the current point in the code.
♦ CPU Registers: Shows the contents of the hardware registers in the processor. You won’t normally need to view these registers unless you’re performing low-level programming tasks.
♦ Disassembly: Let’s you see the underlying machine code used to make your code work. You won’t normally need to view this information unless you’re performing low-level programming tasks.
♦ Memory Dump: Displays the precise way that the application stores data in memory, which may not look very much like the C++ view. This is a useful window because it helps you better understand how memory works and how your application uses memory. In some cases, knowing how a variable stores memory can help you locate problems with your code.
♦ Running Threads: Shows a list of threads, other than the main thread, associated with the current application. You use this window for debugging multithreaded applications.
♦ Watches: Displays a list of local variables and function arguments. You can also add other variables to monitor as a watch. The Watches window is probably the most useful debugger window because it illustrates the C++ view of your data and shows how the application code manipulates that data.
The debugger also provides access to a number of information windows. You access these windows by clicking the Various Info button (the one with an i in italics far down on the left). Here is a quick summary of the information windows:
♦ Current Stack Frame: Shows the current stack frame information. C++ creates something called a stack frame when certain events occur, such as calling a function. This stack frame contains the data and data references for the current function. You won’t normally need to view this information unless you’re performing low-level programming tasks.
♦ Loaded Libraries: Contains a list of all of the libraries loaded to run your application. It’s important to know which libraries your application uses when you deploy (load) it on other machines. In many cases, you may not even know that C++ requires certain libraries to run your application, so this is an exceptionally useful window.
♦ Targets and Files: Provides a detailed view of how the loaded libraries are used in your application. You won’t normally need to view this information unless you’re performing low-level programming tasks.
♦ FPU Status: Displays the register information for the Floating-Point Unit (FPU) in your processor. At one time, the FPU was a separate chip, but now it appears as part of your main processor. The FPU is exceptionally adept at performing real number (versus integer) math. You won’t normally need to view this information unless you’re performing low-level programming tasks.
♦ Signal Handling: Shows how CodeBlocks handles signals between the hardware and your application, such as an arithmetic exception or a segmentation fault. You won’t normally need to view this information unless you’re performing low-level programming tasks.
Debugging with Different Tools
You can use several tools for debugging your code. However, which compiler you usually use dictates which debugging tools you can use. For example, Microsoft Visual C++ has a really good debugger. But getting it to debug a program compiled with Dev-C++, for example, is difficult because different compilers use different forms of debugging and symbol information. The type used by the various breeds of gcc compilers is different from the type used by Microsoft Visual C++.
Standard debuggers
Here’s a quick rundown of some of the debuggers that are available:
♦ Visual C++: This debugger works similarly to the CodeBlocks debugger. It’s primarily for debugging programs that were built by using Visual C++. However, if you are brave and need to debug something for which you have no code or symbol information, its support for assembly-code debugging is good.
♦ gdb: This is the standard debugger that ships with MinGW and Cygwin. It’s a command-line tool, but we don’t recommend using it as such. Instead, we suggest using the Insight debugger with it so you can use a graphical front end. This makes life a lot easier. But if you insist on using the command-line version, you can learn about it by typing gdb at the command prompt and then typing help.
♦ Dev-C++ 5.0: Starting with Version 5.0, Dev-C++ has an integrated debugger that works similarly to the Insight debugger. You may want to give this a try. (If you’re using a version of Dev-C++ prior to 5.0, you have to use the Insight debugger.)
All materials on the site are licensed Creative Commons Attribution-Sharealike 3.0 Unported CC BY-SA 3.0 & GNU Free Documentation License (GFDL)
If you are the copyright holder of any material contained on our site and intend to remove it, please contact our site administrator for approval.
© 2016-2025 All site design rights belong to S.Y.A.