C++ All-in-One For Dummies (2009)
Book III
Fixing Problems
Chapter 3: Stopping and Inspecting Your Code
In This Chapter
Setting, enabling, and disabling breakpoints
Temporarily setting or disabling a breakpoint
Inspecting a variable
Watching all the local variables
Watching any variable
Sometimes, things break. But what we’re talking about here is the code. Now this is one of those instances when a word or phrase has lots of different meanings. Programmers talk about breaking the code. This phrase usually means one of two things: It may mean that the programmer made a mistake and the code no longer works. But in this chapter, we’re using a different definition for the term. When you’re debugging a program, you can have the program run until it gets to a certain line in the code. The debugger then stops at that line, and you can look at the values of variables, inspect things about the code, or even change the variables. When the program stops, that’s called breaking. The reason it stops on that particular line is because you put a breakpoint on that line.
In this chapter, we talk about setting and manipulating breakpoints in your code (if nothing else in your code is broken) and inspecting and modifying various aspects of your code, such as variables, after your code stops at a breakpoint.
 In the examples in this chapter, we use the debugger supplied with the CodeBlocks IDE. If you use a different product, the debugger will probably work about the same but not precisely the same. For example, everything we show you how to do here you can do in Microsoft Visual C++. The keystrokes and mouse clicks may be different, but the features are present. Make sure you check the vendor documentation for precise details on using your debugger.
 To work through the examples in this chapter, make sure that you compile with debug information turned on. (In CodeBlocks, you can compile with debug information by choosing Debug in the Build Target field of the Compiler toolbar. If you can’t see the Compiler toolbar, choose View⇒Toolbars⇒Compiler to place a checkmark next to the Compiler entry.)
When you are developing software, you should always have debug information on. That way, you’re always ready to debug your code and fix things. Only when you’re ready to release the product formally should you recompile it without debug information. (Although we do recommend doing a full test of the software again without debug information, just to make sure that it still functions correctly.)
Setting and Disabling Breakpoints
A breakpoint is a place in your code where you tell the debugger to stop.
In the sections that follow, we talk about breakpoints. Please use the code in Listing 3-1 for these sections. Remember what you’re supposed to do? Make sure that you compile it with debug information on!
Listing 3-1: Using a Program for Breakpoints and Inspections
#include <iostream>
using namespace std;
class BrokenMirror
{
private:
int NumberOfPieces;
public:
int GetNumberOfPieces();
void SetNumberOfPieces(int newamount);
BrokenMirror() : NumberOfPieces(100) {}
};
int BrokenMirror::GetNumberOfPieces()
{
return NumberOfPieces;
}
void BrokenMirror::SetNumberOfPieces(int newamount)
{
newamount = newamount * 20;
NumberOfPieces = newamount;
}
int main()
{
BrokenMirror mirror;
mirror.SetNumberOfPieces(10);
cout << mirror.GetNumberOfPieces() << endl;
return 0;
}
Setting a breakpoint in CodeBlocks
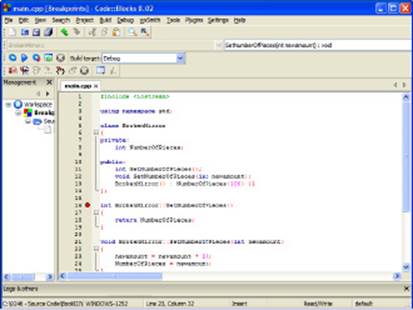
Go ahead and compile the program in Listing 3-1 (with debug information turned on). Look at the left margin of the window, to the right of the line numbers. Figure 3-1 shows a small circle on line 16. When you view the IDE, this circle is red. The red circle is a breakpoint that we set. To set this breakpoint in your code, click in the area between the left margin and the code, as shown in the figure on line 16. (It’s line 16 on our screens, but if you formatted your code differently, you may see it on a different line number.) If you haven’t done so, go ahead and click the mouse in the left margin of the int BrokenMirror::GetNumberOfPieces() line. You see a red circle appear in the left margin. You just placed a breakpoint on that line! Hurray!
Figure 3-1:CodeBlocks displays any breakpoints you set using a red circle.
Click again in the left margin of the same line. The red circle disappears. When the circle disappears, the breakpoint is gone.
Finally, click a third time, because for now you do want a breakpoint there.
Now, run the program by clicking the Debug/Continue button (it looks like a sheet of paper with a down-pointing arrow next to it) on the Debugger toolbar. If you don’t see the Debugger toolbar, choose View⇒Toolbars⇒Debugger to place a checkmark next to the Debugger entry. (Don’t click the Run button, the blue right-pointing triangle, on the Compiler toolbar because choosing this option simply runs the program without debugging it.) When you click Debug/Continue, the console window may pop in front, so just click the CodeBlocks window to bring it back to the front.
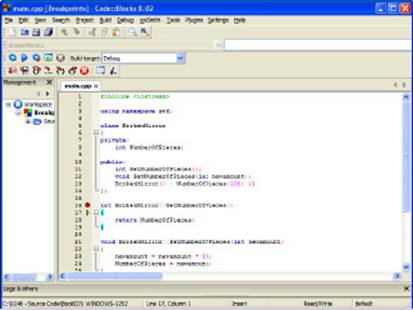
The program runs until it gets to the breakpoint you chose for the int BrokenMirror::GetNumberOfPieces line, as shown in Figure 3-2. Note that execution actually ends with the opening curly brace because this is the beginning of execution for this function. The yellow right-pointing triangle tells you the current instruction that the CodeBlocks debugger will execute. You can now click the Next Line button (it’s the button with two braces, {}, and an arrow pointing over it from the left to the right) to move to the next line, or you can click Debug/Continue to run the rest of the program.
Figure 3-2:Debug mode tells CodeBlocks to stop execution when it reaches the breakpoint.
Enabling and disabling breakpoints
You may have times when you have several breakpoints set, and you want to turn them off momentarily, but you don’t want to lose them because you may want to turn them back on later. You can do this by disabling the breakpoints. Disabling the breakpoint is faster than removing the breakpoints and then going back and finding them again to turn them back on. Use the following steps to disable a breakpoint:
1. Right-click the red circle and choose Edit Breakpoint from the context menu.
You see the Edit Breakpoint dialog box, as shown in Figure 3-3.
Figure 3-3: Use the Edit Breakpoint dialog box to enable and disable breakpoints.
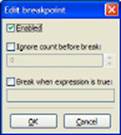
2. Clear the Enabled option and click OK.
CodeBlocks disables the breakpoint so that it no longer stops application execution.
Many debuggers show a disabled breakpoint using a hollow red circle. Unfortunately, CodeBlocks doesn’t provide this visual cue. To see that disabling the breakpoint actually does work, set a new breakpoint at the line that reads return NumberOfPieces;. Click Debug/Continue and you’ll see that the debugger bypasses the first breakpoint and stops at the second, as shown in Figure 3-4.
In some cases, you want to enable or disable a number of breakpoints. Use the following steps to perform this task:
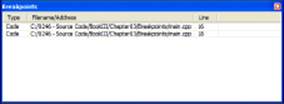
1. Choose Debug⇒Debugging Windows⇒Breakpoints.
You see the Breakpoints window shown in Figure 3-5. The window shows the kind of breakpoint, the breakpoint location, and the line in the code file where the breakpoint appears.
2. Right-click the breakpoint entry and choose Breakpoint Properties from the context menu.
You see the Edit Breakpoint dialog box (refer to Figure 3-3), where you can change the breakpoint status.
Figure 3-4:Disabled breakpoints don’t stop program execution.
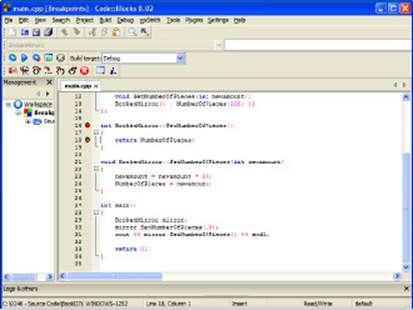
Figure 3-5: Use the Breakpoints window to access a number of breakpoints at once.
Watching, Inspecting, and Changing Variables
When you stop at a breakpoint in a program, you can do more than just look at the code. You can have fun with it! You can look at the current values of the variables, and you can change them.
Listing 3-2 is a sample program that you can use to try out these examples of inspecting, changing, and watching variables. Please note that this program is similar to Listing 3-1, earlier in this chapter, but you should see some differences. Specifically, we added a line to theSetNumberOfPieces member function
newamount = newamount * 20;
We added a new function called SpecialMath, and we added an i variable to main that is initialized to 10; then we doubled it, and we passed it into the SetNumberOfPieces function.
Listing 3-2: Using a Program for Breakpoints and Inspections
#include <iostream>
using namespace std;
class BrokenMirror
{
private:
int NumberOfPieces;
public:
int GetNumberOfPieces();
void SetNumberOfPieces(int newamount);
BrokenMirror() : NumberOfPieces(100) {}
};
int BrokenMirror::GetNumberOfPieces()
{
return NumberOfPieces;
}
void BrokenMirror::SetNumberOfPieces(int newamount)
{
newamount = newamount * 20;
NumberOfPieces = newamount;
}
int SpecialMath(int x)
{
return x * 10 - 5;
}
int main()
{
int i = 10;
BrokenMirror mirror;
i = i + SpecialMath(i);
mirror.SetNumberOfPieces(i);
cout << mirror.GetNumberOfPieces() << endl;
// Clear this comment if you want the application to stop to
// display the results.
// system(“PAUSE”);
return 0;
}
Watching the local variables
To watch the local variables in your program, follow these steps:
1. Compile this program with debug information on.
2. Set a breakpoint at the int i = 10; line in main.
3. Click Debug/Continue.
4. When the debugger stops at the breakpoint, click the Next Line button on the Debugger toolbar so that you are one line beyond the following line:
int i = 10;
5. Choose Debug⇒Debugging Windows⇒Watches.
You see the Watches window, as shown in Figure 3-6.
Figure 3-6: The Watches window shows the value of variables and objects.
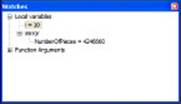
6. Open the Local Variables folder.
You see the current value of i, which is 10.
Figure 3-6 also shows the mirror variable because it’s a local variable. When we click the plus symbol next to the mirror variable, we see what’s inside the object. In this case, you see something like:
NumberOfPieces 4246660
(Your number may not precisely match the one shown in Figure 3-6.) Oops! That’s a strange value. Well, the reason is this: We haven’t run the following line yet:
BrokenMirror mirror;
The debugger is sitting on this line, waiting to perform it. It turns out that C++ allocates the space for all the local variables at the beginning of the function. And so the space for mirror is there, but the space is not set up yet. Meanwhile, there’s just garbage in the space. (Yes, that is really the term programmers use for whatever may be in something before it’s initialized: garbage. We’re not making this up!)
To run the next line and see the results, follow these steps:
1. Position your windows so that you can see both the Watches window (at least the line showing NumberOfPieces) and the source-code window.
At this point, you have several options:
• You can click Next Line and the debugger proceeds directly to the next line of main, skipping through all the code required to initialize NumberOfPieces.
• As an alternative, you can click Step Into on the Debugger toolbar to see how the application initializes NumberOfPieces.
2. In the source-code window, click Next Line so the BrokenMirror mirror; line runs.
The value in the NumberOfPieces member variable has changed. In the Watches window, the value for NumberOfPieces now says:
NumberOfPieces = 100
The line showing the value is now red. That color change gives you a visual indication that the value has changed.
When you look at an object in the Watches window, you are looking at a particular instance, not the class. Therefore, all the member variables have values stored in them. (But if the member variables are uninitialized, those values will be garbage.)
3. Click the Next Line button again to run this line:
i = i + SpecialMath(i);
The NumberOfPieces line in the Local Variables window changes back to black. The reason is that with the running of this single line of code, the NumberOfPieces value did not change. Only the values that changed under the most recent running of the code get red. The others get black. The yellow triangle will now point to this line:
mirror.SetNumberOfPieces(i);
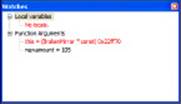
4. Click the Step Into button to go into the function.
The Watches window changes drastically. The Local Variables folder shows that there aren’t any local variables. Open the Function Arguments folder, however, and you see the variables for the current function, including the this pointer, which is the pointer to the current object. Figure 3-7 shows the new information (the precise numbers you see may vary from those shown in the figure).
Figure 3-7:Function arguments appear in a special folder.
5. Click the Next Line button so that the instruction pointer is on the line that reads
NumberOfPieces = newamount;
6. Take a look at the newamount value in the Watches window.
It now says 2100.
7. Right-click the newamount line in the Watches window and choose Change Value from the context menu.
Voilà! A Change Variable’s Value dialog box appears, and you can actually type a new value for newamount! Excellent!
8. Type 1000 and press Enter.
You just changed the value of newamount.
9. Go back to the main CodeBlocks window and click Next Line a few more times until you’re one line past the cout line.
10. Take a look at the console window, and you will see the output from this line:
cout << mirror.GetNumberOfPieces() << endl;
The output looks like this:
1000
Yes, that is the value you stuffed inside the newamount variable, not the value that it used to have, which was 2100.
Watching other variables
You can watch any variables you want by using the Watches window. To watch any variables, not necessarily the locals, follow these steps:
1. Go ahead and run the program in Listing 3-2 inside CodeBlocks from the beginning, stopping at the int i = 10; line.
2. Right-click i and choose Watch ‘i’ from the context menu.
CodeBlocks adds a watch for i to the Watches window.
3. Click the Next Line button.
The value of i in the Watches window shows 10. Now, as you step through the program, you can watch the value of i at any time. Further, you can change the value of i by double-clicking its line in the Watch Expressions window.
Adding a watch is useful for global variables that do not show up in the Local Variables folder of the Watches window. This feature is handy when you are stepping through the code, going from function to function, and you have a global variable that you want to monitor.
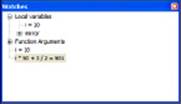
Now for something really great. Here’s how you can perform complex expressions inside the Watch Expression window: Right-click the Watches window and choose Add Watch from the context menu. In the Keyword field of the Edit Watch dialog box type: i * 50 + 3 / 2. Click OK. The result of this expression shows up in the Watches window, as shown in Figure 3-8. Very nice indeed!
Figure 3-8: The Watches window can contain complex expressions.
All materials on the site are licensed Creative Commons Attribution-Sharealike 3.0 Unported CC BY-SA 3.0 & GNU Free Documentation License (GFDL)
If you are the copyright holder of any material contained on our site and intend to remove it, please contact our site administrator for approval.
© 2016-2025 All site design rights belong to S.Y.A.