C++ All-in-One For Dummies (2009)
Book III
Fixing Problems
Chapter 4: Traveling About the Stack
In This Chapter
Moving about the stack
How local variables are stored
Viewing threads
Tracing through assembly code
Viewing memory
Debuggers can be powerful things. They can leap tall computer programs in a single bound and see through them to find all their flaws. The more you know about these little debuggers, the more you can put them to use. In this chapter, we show you how to move about the stack and to make use of advanced debugger features.
Stacking Your Data
A stack is a common thing in the computer world. We have stacks of bills, and stacks of paychecks, and stacks of data. The stacks of data are interesting because, unlike the bills and paychecks, they live inside the computer’s memory. But the stack metaphor is appropriate. When the operating system runs a program, it gives that program a stack, which is simply a big chunk of memory. But the data is stored just like a stack of cards: With a stack of real cards, you can put a card on the top, then another, and do that six times over; then you can take a card off and take another card off. You can put cards on the top and take them off the top. And if you follow these rules, you can’t insert them into the middle or bottom of the stack. You can only look at what’s on the top. A stack data structure works the same way: You can store data in it by pushing the data onto the stack, and you can take data off by popping it off the stack. And yes, because the stack is really just a bunch of computer memory, sneaking around and accessing memory in the middle of the stack is possible. But under normal circumstances, you don’t do that: You put data on and take data off.
But what’s interesting about the stack is that it works closely with the main CPU, such as the Intel Pentium, AMD Athlon 64, or whatever is inside your computer. The CPU has its own little storage bin right on the chip itself. (This isn’t in the system memory or RAM; it’s inside the CPU itself.) This storage bin holds what are called registers. One such register is the stack pointer, called the ESP. (That stands for Extended Stack Pointer, because the earlier Intel processors just had a Stack Pointer, or SP. Then, when the folks at Intel replaced that chip, they made the registers bigger and just stuck on the letter E for extended to denote the bigger registers.)
The stack is useful in many situations and is used extensively behind the scenes in the programs you write. The compiler generates code that uses the stack to store local variables, to function parameters, and the order that functions are called. It’s all stacked onto the stack and stuck in place, ready to be unstacked.
Moving about the stack
The CodeBlocks debugger, like most debuggers, lets you look at the stack. But really, you’re not looking directly at the stack. When a debugger shows you the stack, it is showing you the list of function calls that led up to the application’s current position in the program code. However, that information is stored in the stack, and the debugger uses the stack to get that information. So that’s why programmers always call the list of function calls the stack, even though you’re not actually looking at the stack.
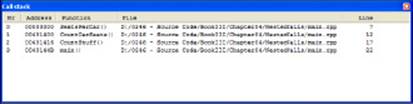
Figure 4-1 shows an example of the Call Stack window in CodeBlocks. To see the Call Stack window, simply choose Debug⇒Debugging Windows⇒Call Stack. You can see the Call Stack window in front of the main CodeBlocks window. No information appears in the Call Stack window until you start running a program.
Figure 4-1: The Call Stack window shows the function calls that led up to the current position.
You can try viewing the stack yourself. Take a look at Listing 4-1. This listing shows a simple program that makes several nested function calls.
Listing 4-1: Making Nested Function Calls
#include <iostream>
using namespace std;
int SeatsPerCar()
{
return 4;
}
int CountCarSeats()
{
return 10 * SeatsPerCar();
}
int CountStuff()
{
return CountCarSeats() + 25;
}
int main()
{
cout << CountStuff() << endl;
system(“PAUSE”);
return 0;
}
To try out the Call Stack window, follow these steps:
1. Compile this program (set the Build Target field to Debug).
2. Set a breakpoint at the int main() line.
3. Run the application in the CodeBlocks debugger by pressing F8.
4. Step into the CountStuff function, then into the CountCarSeats function, and then into the SeatsPerCar function.
(Or just put a breakpoint in the SeatsPerCar function and run the program until it stops at the breakpoint.)
5. Choose Debug⇒Debugging Windows⇒Call Stack.
A window like the one in Figure 4-1 appears. Note the order of function calls in the Call Stack window:
SeatsPerCall()
CountCarSeats()
CountStuff()
main()
This information in the Call Stack window means that your program started out with main(), which called CountStuff(). That function then called CountCarSeats(), which in turn called SeatsPerCall(). And that’s where you currently are.
 This window is handy if you want to know what path the program took to get to a particular routine. For example, you might see a routine that is called from many places in your program and you’re not sure which part is calling the routine when you perform a certain task. To find out which part calls the routine, set a breakpoint in the function. When you run the program and the debugger stops at that line, the Call Stack window shows you the path the computer took to get there, including the name of the function that called the function in question.
In the Call Stack window, you can double-click any function name, and the Debugger moves the cursor to the function’s body in the source code. This feature makes it easy for you to locate any function within the call stack and see why the code followed the path it did.
 Stack features are common to almost all debuggers. We won’t say all because we’re sure some really bad debuggers that don’t have stack features are out there. But the good debuggers, including those built into CodeBlocks and Microsoft Visual C++, include features for moving about the stack.
Debuggers use different terminology for the window that shows stack information. Borland C++ Builder and Borland Delphi (a Pascal tool) both use the term Call Stack, just like CodeBlocks. To get the Call Stack window in C++ Builder, choose View⇒Debug Windows⇒Call Stack. The Insight debugger uses the term Stack window; you access it by choosing View⇒Stack. No matter what a particular product calls the window that contains stack information, the essential functionality is the same — to show how you arrived at a particular point in the code.
Storing local variables
As you get heavily into debugging, it always helps to fully understand what goes on under the hood of your program. Now at this point, we’re going to be speaking on two levels — one level is your C++ code, and the other level is the resulting assembly code that the compiler generates based on your C++ code. (Assembly is the human-readable form of machine code that the processor on your machine understands.) So throughout this chapter, we make sure that we clearly state which level we’re referring to.
Suppose you write a function in C++, and you call the function in another part of your program. When the compiler generates the assembly code for the function, it inserts some special code at the beginning and at the end of the function. At the start of the function, this special code allocates space for the local variables. At the end of the function, the special code deallocates the space. This space for the variables is called the stack frame for the function.
Now this space for the local variables lives on the stack. The storage process works as follows: When you call your function, the computer pushes the return address onto the stack. After the computer is running inside the function, the special code the compiler inserted saves some more of the stack space — just enough for the variables. This extra space becomes the local storage for the variables; and just before the function returns, the special code removes this local space. Thus, the top of the stack is now the return address. The return then functions correctly.
 This process with the stack frame takes place with the help of the internal registers in the CPU. Before a function call, the assembly code pushes the arguments to the function onto the stack. Then it calls the function by using the CPU’s built-in call statement. (That’s an assembly-code statement.) This call statement pushes the return address onto the stack and then moves the instruction pointer to the function address. After the execution is inside the function, the stack contains the function arguments and then the return address. The special function startup code (called a prolog) saves the value in one of the CPU registers, called the Extended Base Pointer, or EBP register.
Where does the prolog save the value? On the stack! The prolog code first pushes the EBP value onto the stack. Then the prolog code takes the current stack pointer (which points to the top of the stack in memory) and saves that back in the EBP register for later use. Then the prolog code adjusts the stack pointer to make room for the local variable storage. The code inside the function then accesses the local variables as offsets above the position of EBP on the stack and the arguments as offsets below the position of EBP on the stack.
Finally at the end of the function, the special code (now called an epilog) undoes the work: The epilog copies the value in EBP back into the stack pointer; this deallocates the local variable storage. Then it pops the top of the stack off (as opposed to blow the top of the stack off) and restores this value back into EBP. (That was, after all, the original value in EBP when the function started.) Now the top of the stack contains the function return address, which is back to the way it was when the function began. The next assembly statement is a return, which pulls the top of the stack off and goes back to the address that the epilog code pulled off the stack. Now just think: Every single time a function call takes place in your computer, this process takes place. Kinda gives you new respect for this big pile of bits and bytes, doesn’t it!
Inside the computer, the stack actually runs upside down. When you push something on the stack, the stack pointer goes down in memory — it gets decremented. When you pop something off the stack, the stack pointer gets incremented. Therefore, in the stack frame, the local variables are actually below EBP in memory, and you access their addresses by subtracting from the value stored in the EBP register. The function arguments, in turn, are above the EBP in memory, and you get their addresses by adding to the value stored in EBP.
The one thing we didn’t discuss in the previous technical discussion is the return value of a function. In C++, the standard way to return a value from a function is for the function’s assembly code to move the value into the Extended Accumulator, or EAX, register. Then the calling code can simply inspect the EAX register after the function is finished. However, if you are returning something complex, such as a class instance, things get a more complex. Suppose you have a function that returns an object, but not as a pointer, as in the function headerMyClass MyFunction();. Different compilers handle this differently, but when the gcc compiler that’s part of CodeBlocks, Dev-C++, MinGW, and Cygwin encounters something such as MyClass inst = MyFunction();, it takes the address of inst and puts that in EAX. Then, in the function, it allocates space for a local variable, and in the return line it copies the object in the local variable into the object whose address is in EAX. So when you return a nonpointer object, you are, in a sense, passing your object into the function as a pointer!
Debugging with Advanced Features
Most debuggers, including CodeBlocks, have some advanced features that are handy when going through your program. These features include the capability to look at threads and assembly code.
Viewing threads
If you are writing a program that uses multiple threads and you stop at a breakpoint, you can get a list of all the current threads by using the Running Threads window. To open the Running Threads window, in the main CodeBlocks window choose Debug⇒Debugging Windows⇒Running Threads. A window showing the currently running threads opens. Each line looks something like this:
2 thread 2340.0x6cc test() at main.cpp:7
The first number indicates which thread this is in the program; for example, this is the second thread. The two numbers after the word thread are the process ID and the thread ID, separated by a dot. Then you see the name of the function where the thread is currently stopped along with the line number where the thread is currently stopped.
Interestingly enough, CodeBlocks shows only running threads, so if your application has just one thread (as the example in Listing 4-1), the Running Threads window is blank when you pause the application for debugging. Consequently, you can’t see the main (and only) thread of the application because the thread isn’t running.
Tracing through assembly code
If you really feel the urge, you can view the actual assembly code. The only time we ever do this is when we absolutely must get down to the hard-core nitty-gritty. CodeBlocks lets you do this. Choose Debug⇒Debugging Windows⇒Disassembly to see the Disassembly window shown in Figure 4-2.
Figure 4-2: The Disassembly window shows the assembly code that results from the C++ code you write.
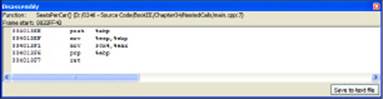
The window shown in Figure 4-2 is the disassembly of the SeatsPerCar() function shown in Listing 4-1. Here’s the function again so you can compare it to Figure 4-2.
int SeatsPerCar()
{
return 4;
}
The following lines create the stack frame:
004013EE push %ebp
004013EF mov %esp,%ebp
After the code creates a stack frame, it moves a value of 4 (the return 4; part of the code) into EAX as shown here:
004013F1 mov $0x4,%eax
The code then pops EBP and returns to the caller (the CountCarSeats() function) using this code:
004013F6 pop %ebp
004013F7 ret
Now, if you move into the CountCarSeats() function, you see assembly like that shown in Figure 4-3.
Figure 4-3: This Disassembly window shows theCountCarSeats()function code.
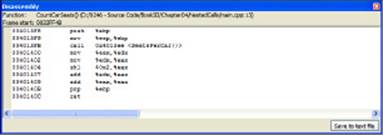
As before, the assembly begins by creating a stack frame. It then issues a call to the SeatsPerCar() function. When the function returns, the assembly performs the multiplication part of the task. Finally, the code performs the usual task of placing the return value in EAX, popping EBP, and returning to the caller. Notice that what appears to be simple multiplication to you may not be so simple in assembler. Let’s say you changed the code to read
int CountCarSeats()
{
return 4 * SeatsPerCar();
}
The math is simpler now because you’re using 4, which is easily converted into a binary value. Figure 4-4 shows the assembly that results from this simple change.
Figure 4-4:Small C++ code changes can result in large assembly-code changes.
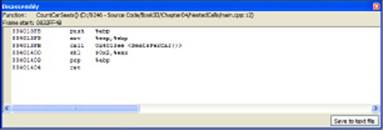
Now all the code does is perform a shift left (SHL) instruction. Shifting the value in EAX left by 2 is the same as multiplying it by 4. The reason the assembler uses the SHL instruction is that shifting takes far fewer clock cycles than multiplication, which makes the code run faster. The result is the same, even if the assembler code doesn’t quite match your C++ code.
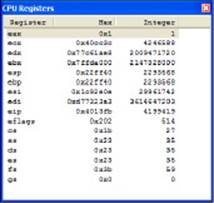
If you want to see the values in the registers so you can more easily follow the assembler code, choose Debug⇒Debugging Windows⇒CPU Registers. You see the CPU Registers window shown in Figure 4-5. This window reflects the state of the registers at the current stopping point in the code. Consequently, you can’t see each step of the assembler shown in the Disassembly window reflected in these registers.
Figure 4-5:Viewing the CPU registers can give you insights into how code interacts with the processor.
All materials on the site are licensed Creative Commons Attribution-Sharealike 3.0 Unported CC BY-SA 3.0 & GNU Free Documentation License (GFDL)
If you are the copyright holder of any material contained on our site and intend to remove it, please contact our site administrator for approval.
© 2016-2025 All site design rights belong to S.Y.A.