C++ All-in-One For Dummies (2009)
Book VII
Building Applications with Microsoft MFC
Chapter 5: Analyzing Your Visual C++ 2008 Code
In This Chapter
Working with Performance Wizard
Creating a code profile
How fast does it work? That’s the question many developers ask when the application is finally put together because it’s the question that the customer will ask when the application is delivered. No one wants to spend hours waiting for an application to perform its task. In fact, people want an application that produces results as close to instantaneously as possible.
Fortunately, Visual C++ makes it possible to check the speed of your application and locate areas that don’t work as quickly as they could. Of course, you must still make the changes required to produce optimal results — the tools can only point to potential sources of problems, not tell you how to correct them.
 You always have to consider the consequences of actions you take. An application doesn’t exist in a vacuum. When you make an application run faster, you can also cause it to perform unreliably or break security rules to get the last bit of speed. As the famous saying goes, “Speed kills.” An application that goes too fast and breaks the rules in the process can kill your data, which can ultimately kill your company. Consequently, you must always consider speed improvements in light of how they affect the application environment as a whole.
Using Performance Wizard
Performance Wizard helps you check your code for potential performance issues. It’s simple to use, as you see in the following steps that take you through a performance-checking session:
1. Choose Analyze⇒Launch Performance Wizard.
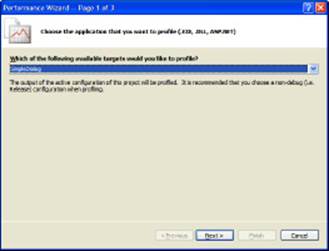
You see the dialog box shown in Figure 5-1. This first dialog box lets you choose any project in the current solution. It’s also possible to select an external EXE, DLL or ASP.NET application. When you choose an external application, the wizard adds an additional step where you describe the external location to test.
Figure 5-1:Launch Performance Wizard to see deficiencies in your application.
2. Choose a profiling option and click Next.
If you select a project that’s part of the current solution, go directly to Step 4.
3. Provide the external location information that the wizard requests and then click Next.
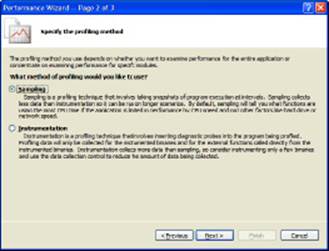
You see the Specify the Profiling Method dialog box shown in Figure 5-2. The profiling method you select determines the kind of statistics the wizard generates and how it generates them. The wizard offers two options as described here:
• Sampling: This approach takes snapshots of your application over time. The snapshots aren’t always completely accurate because you aren’t performing full-time monitoring of the application. However, the snapshots do generate less data, making them ideal for processes that have to run a long time to obtain trend data. In most cases, you use sampling when you want to obtain an overall view of your application performance.
• Instrumentation: This approach relies on diagnostic probes that you place in the code. The results are precise. However, instrumentation consumes considerable resources. Consequently, you normally use instrumentation to fine-tune your performance analysis after you obtain an overview using sampling.
Figure 5-2:Select a profiling method.
4. Choose a profiling method and click Next.
You see a summary dialog box that tells you the specifics of the performance monitoring session.
5. Click Finish.
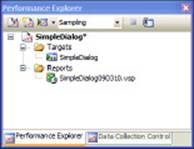
Visual Studio displays Performance Explorer, which contains folders for your application elements and also a folder for reports. The Reports folder is empty when you begin the sampling or instrumentation profiling process.
Profiling the Code
Visual Studio provides a number of ways to create a profile for your application. The easiest method is to use Performance Wizard as described in the preceding section. After you create a profile for your application, you can start it and use that profile to perform your analysis. Use the following steps to begin profiling your code:
1. Highlight the application entry in the Targets folder of Performance Explorer.
2. Click Launch with Profiling in the Performance Explorer toolbar.
Visual Studio starts your application.
3. Work with your application as you normally do.
Visual Studio collects data about your application. Make sure you exercise your application using the same approach as you would normally. Using a script can help improve profiling by ensuring that you exercise the application the same way every time you test it and guaranteeing that you exercise every feature.
4. Stop the application.
You see a new report added to the Reports folder of Performance Explorer similar to the one shown in Figure 5-3. Visual Studio creates a new report every time you run the profile, so you can compare reports to determine how changes in your code affect application speed.
Figure 5-3:Performance Explorer contains a list of reports of application speed.
The report contains a listing of applications that cause the most work (by making calls, for example) and those that do most of the work. Figure 5-4 shows a report for the simple test application in this chapter. Most applications will generate more results, but this report gives you an idea of how the report looks.
Instrumented reports look a bit different from sampled reports. Before you begin the profile, select Instrumentation in the Method drop-down list in Performance Explorer. When you click Launch with Profiling, the Output window shows something like this:
Set linker /PROFILE switch (required for instrumentation) on project
SimpleDialog.vcproj.Profiler started
Instrumenting SimpleDialog.exe in place
Info VSP3049: Small functions will be excluded from instrumentation.
Microsoft (R) VSInstr Post-Link Instrumentation 9.0.30729 x86
Copyright (C) Microsoft Corp. All rights reserved.
File to Process:
SimpleDialog.exe --> SimpleDialog.exe
Original file backed up to SimpleDialog.exe.orig
Successfully instrumented file SimpleDialog.exe.
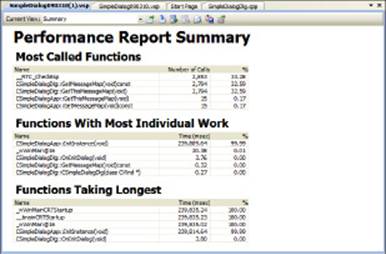
This is a normal part of the process. You test the application just as you normally do. However, the output report contains more detail, as shown in Figure 5-5.
Figure 5-4:Sampling reports give you a good overview of your application speed.
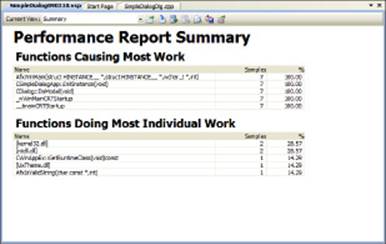
Figure 5-5:Instrumen-tation provides additional details.
All materials on the site are licensed Creative Commons Attribution-Sharealike 3.0 Unported CC BY-SA 3.0 & GNU Free Documentation License (GFDL)
If you are the copyright holder of any material contained on our site and intend to remove it, please contact our site administrator for approval.
© 2016-2025 All site design rights belong to S.Y.A.