C++ All-in-One For Dummies (2009)
Book VII
Building Applications with Microsoft MFC
Chapter 4: Using the Visual C++ 2008 Debugger
In This Chapter
Understanding the error application
Getting started with debugging
Using the debugging windows
As with any good programming environment, Visual C++ offers a debugger that helps you locate and squash bugs in your application. In fact, the Visual C++ debugger is one of the highlights of Visual Studio. You get a world-class debugger that can help you locate nearly any type of bug in your application and with a minimum of effort.
The Visual C++ debugger works the same as most other debuggers. You can single-step through the application or use breakpoints to stop at locations you think might contain errors. Visual C++ provides a number of debugging windows that show the application state and provide a means for watching variables as the application executes.
The thing that sets this debugger apart is that everything is well integrated so that you don’t have to work quite so hard to figure things out. In addition, Visual C++ provides a number of additional windows that you won’t find with other debuggers. For example, you can create more than one Watch window.
In this chapter, you discover the Visual C++ debugger. The sections split debugging into running the application and working with the debugging windows.
A debugger is a debugger
Minibook III spends considerable time discussing application debugging techniques. No matter what IDE you use, debuggers tend to work the same way and the techniques you use to debug an application are essentially the same. What differs is the number of debugger resources the IDE provides. The Visual Studio debugger works the same as the debugger for CodeBlocks but has additional functionality. For example, Visual Studio gives you four Watch windows to debug your code. It also has features such as visualizers. However, when all is said and done, the basic principles are the same, so the techniques you discover in Minibook III apply to Visual Studio as well.
Visual Studio includes many of the same windows as CodeBlocks (as do many other debuggers). For example, if you include Debug statements in your code, you still see the output in the Output window. This chapter doesn’t discuss windows that have the same functionality in both IDEs.
A Quick Look at the Error Application
The example application has two errors in it. The application is supposed to obtain the value from the user, add 1 to it, and then display the result. As you can see from Figure 4-1, the application doesn’t work quite right.
Figure 4-1: The error application is simply broken.
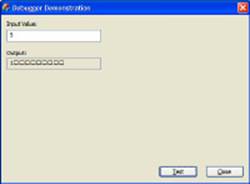
The purpose of this chapter isn’t to keep the problems a deep hidden secret — the purpose is to show how the debugger helps you locate these problems. This application has the following two errors:
♦ It relies on a variable, rather than a control, to provide access to the input value.
♦ It uses the wrong function to perform a conversion.
The example code shows both the errors and the fixes required to make the application work properly. Listing 4-1 shows the target function for this example.
Listing 4-1: Creating an Application That Contains Two Errors
void CErrorAppDlg::OnBnClickedTest()
{
// Obtain and convert the value.
int InputValue = atoi((const char *)m_Input.GetBuffer());
// Here’s the first fix.
//CString InputString = _T(“”);
//m_InputControl.GetWindowTextW(InputString);
//int InputValue = _wtoi(InputString.GetBuffer());
// Release the buffer.
m_Input.ReleaseBuffer();
// Add 1 to it.
int OutputValue = InputValue + 1;
// Convert the result to a string.
CString Output = _T(“0”);
_itoa_s(OutputValue, (char *)Output.GetBuffer(10), 10, 10);
// Here’s the second fix.
//_itow_s(OutputValue, Output.GetBuffer(10), 10, 10);
// Make sure you release the buffer.
Output.ReleaseBuffer();
// Output the results.
m_Output.SetWindowTextW(Output);
}
The application begins by using a CString variable instead of a CEdit control for IDC_INPUT. As a result, m_Input contains a blank string instead of the value the user typed. The example fixes this error by using a CEdit control instead and then obtaining the value from the window. At this point, the code places the value the user typed into a CString variable, InputString.
The second error is the use of the _itoa_s() function to convert the integer value into a string. The error is somewhat obvious because the code has to coerce the output of the Output.GetBuffer() method. The fix for this problem is to use the _itow_s() function instead.
Starting Your Application in Debugging Mode
Debugging an application in Visual Studio requires that you first perform the right setups. These setups ensure that the application starts in the right place, stops in the right place, and has the required debugging information in the executable file. Otherwise, the debugger simply won’t work. The following sections discuss all these steps.
Creating the proper build
Before you can use your application, you must ask the IDE to build it for you. Visual Studio provides two default builds for Visual C++ applications:
♦ Release
♦ Debug
You can create other builds as needed using Configuration Manager. To debug your application, you must select the Debug build from the Solution Configurations drop-down list located on the Standard toolbar. This same drop-down list also provides access to Configuration Manager. When you finish debugging your application, choose the Release build, and rebuild the application for distribution purposes.
Setting breakpoints
Breakpoints tell the debugger to stop in a certain location so that you can begin debugging the application. You set breakpoints wherever you think you might be able to gain information required to debug the application. For example, you might want to set a breakpoint at the location used to set an application value and again where the application uses the value to perform a task. Some global variables are initialized and used in two different methods, so setting two breakpoints isn’t unusual.
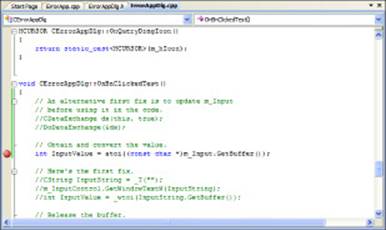
To set a breakpoint, click in the margin next to the line where you want the debugger to stop. Visual Studio displays a red circle to mark the breakpoint. For example, Figure 4-2 shows a breakpoint at this line of code:
int InputValue = atoi((const char *)m_Input.GetBuffer());
After you have a breakpoint set, the debugger will stop at that location. You can also perform a number of configuration changes to breakpoints. To see the list, right-click the breakpoint and select the option you want from the context menu. Here are the standard breakpoint options:
♦ Delete Breakpoint: Removes the breakpoint completely. You have to reset the breakpoint to stop at the location.
♦ Disable Breakpoint: Leaves the breakpoint intact so that you can still see it in the Breakpoints window (see the “Viewing your breakpoints” section of the chapter for details) but prevents the debugger from stopping.
Figure 4-2:Set breakpoints as needed in your application.
♦ Enable Breakpoint: Makes a breakpoint functional again after disabling it. To use this feature, you must right-click on the line of code or enable the breakpoint in the Breakpoints window.
♦ Location: Displays the File Breakpoint dialog box, where you see the path, filename, line number, and starting character of the breakpoint. This dialog box also contains an option that keeps the breakpoint functional even if the source code differs from the original.
♦ Condition: Displays the Breakpoint Condition dialog box, where you set a condition for the breakpoint. You may provide any expression, including variable names, and choose whether the breakpoint functions when the expression is true or has changed.
♦ Hit Count: Displays the Breakpoint Hit Count dialog box, where you select how often the debugger must hit a particular line of code before the breakpoint becomes functional. The default setting causes execution to stop every time. However, you can set various hit count conditions, such as when the hit count is greater than a particular number.
♦ Filter: Displays the Breakpoint Filter dialog box, where you define process and thread conditions for the breakpoint. For example, you can decide that the breakpoint should function for the main thread but not a child thread. You can set the following filter types:
• MachineName
• ProcessId
• ProcessName
• ThreadId
• ThreadName
♦ When Hit: Displays the When Breakpoint Is Hit dialog box, where you define an action to perform when the debugger encounters the breakpoint. You can Print a Message, Run a Macro, Continue Execution, or perform any combination of these tasks (you must Print a Message or Run a Macro to enable the Continue Execution option).
Viewing your breakpoints
Sometimes you want to see a list of the breakpoints you have set. Choose Debug⇒Windows⇒Breakpoints or press Ctrl+Alt+B to display the Breakpoints window. Figure 4-3 shows a typical example.
Figure 4-3: The Breakpoints window shows a complete list of the breakpoints you’ve set.
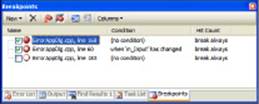
The default breakpoint appears like the first one in this list with a red circle. When you add a condition of some sort, the red circle has a plus sign added like the second breakpoint in the list. Disabled breakpoints appear with a hollow circle, as shown for the third entry.
You can interact with the breakpoints in a number of ways. Double-clicking a breakpoint takes you to that location in the file. As an alternative, you can click Go To Source Code or press Alt+F9, then press S to go to the breakpoint location in the file.
Click Disable All Breakpoints to keep breakpoints in place but prevent the debugger from stopping at them. You can also delete individual breakpoints or all of the breakpoints at once. Right-click a breakpoint and you see a context menu where you can set conditions.
Figure 4-3 shows the default columns. The Breakpoints window provides a considerable list of additional columns. Simply choose the columns you want to see from the Columns drop-down list. The example application relies on the three breakpoints shown in Figure 4-3 without any conditions attached — all three breakpoints are active.
Starting the debugger
You can start the debugger in a number of ways. For example, you can simply click Step Over in the Debug toolbar or press F10. However, the standard method to start debugging is to set a breakpoint and then use one of these techniques:
♦ Click Start Debugging in the Debug toolbar
♦ Press F5
♦ Choose Debug⇒Start Debugging
Working with the Debugging Windows
The debugging windows tell you things about your application. Precisely what the windows tell you depends on where you set breakpoints and the particular window. Most debugging windows provide some means of viewing variables and their content. Because some variables are complex, you can also drill down into the variables to see the content of objects and properties they contain. The following sections describe the debugging windows.
Viewing the focus variables using the Autos window
The most commonly used window is Autos. In fact, this window appears by default when you start the application in debugging mode. The Autos window is exceptionally useful because it helps you focus on the variables in use at a particular line of code. It shows all the variables in use, regardless of whether these variables are local or global.
The example application has a problem obtaining the value the user typed into the form. The first breakpoint takes you to the CErrorAppDlg::DoDataExchange() method, where the application obtains data from the form and places it in a variable at this line:
DDX_Text(pDX, IDC_INPUT, m_Input);
This line of code shows the data exchange between IDC_INPUT and m_Input. When you follow the code, you find that the CErrorAppDlg::DoDataExchange() method is called only when the program starts and again when you close the form. Consequently, the first problem with the application is that m_Input is always a blank as shown in Figure 4-4. As you discover if you look at the other debugging windows, the Autos window is the only one that provides this view and makes it possible to see the first error in this application.
Figure 4-4: The Autos window focuses attention on variables of interest for the current task.
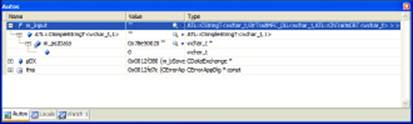
The Autos window provides three columns that tell you the variable name, contents, and type. Click the plus sign next to any variable name that has one and you drill down into the object to see the elements of that variable. Note that some of the entries in the Value column have a magnifying glass next to them. Visual Studio offers visualizers for certain kinds of data, including
♦ Text Visualizer
♦ XML Visualizer
♦ HTML Visualizer
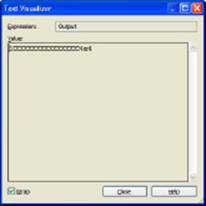
Select a visualizer from the drop-down list next to the magnifying glass. Click the magnifying glass to view the data using the visualizer. Figure 4-5 shows an example of the Text Visualizer for Output in the CErrorAppDlg::OnBnClickedTest() method. The Text Visualizer shows that Output is filled with garbage because it isn’t filled using the correct function.
Figure 4-5: Use visualizers to see data clearly.
Viewing all of the variables in a methodusing the Locals window
The Locals window focuses attention on the local method. You don’t see any global variables. However, in some cases, you really do want to see just the local variables. For example, the Locals window makes the first error in the example application painfully obvious, as shown in Figure 4-6.
Figure 4-6: The Locals window works precisely the same as Autos, only the focus differs.
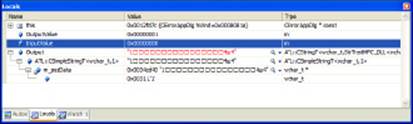
The InputValue variable in the CErrorAppDlg::OnBnClickedTest() method is 0 after the application calls int InputValue = atoi((const char *)m_Input.GetBuffer()); as shown in Listing 4-1. As a result, OutputValue contains 1 instead of the number you expect after the math calculation. The Locals window works just like the Autos window in every other way.
Screening specific variables usingthe Watch 1 window
In some cases, you don’t want either a current line of code or a local method focus. Visual Studio supports up to four watch windows — each of which can have a different focus. The default debug setup shows Watch 1, but you can display Watch 2 through Watch 4 by choosing the corresponding option on the Debug⇒Windows⇒Watch menu.
The easiest way to use a Watch window is to drag a variable of interest from the Code window to the Watch window. You can also type a variable into the Watch window. If you decide that you want to monitor just part of a variable, simply edit the value in the Name column.
Even through the Watch window provides you with significant flexibility in adding the variables you want to see, it works the same as the other variable windows. In short, you can still drill down into variables and use visualizers to see variable content.
Working with the Call Stack window
The Visual Studio Call Stack window is about the same as the Call Stack w
All materials on the site are licensed Creative Commons Attribution-Sharealike 3.0 Unported CC BY-SA 3.0 & GNU Free Documentation License (GFDL)
If you are the copyright holder of any material contained on our site and intend to remove it, please contact our site administrator for approval.
© 2016-2025 All site design rights belong to S.Y.A.