Introduction to Game Design, Prototyping, and Development (2015)
Part II: Digital Prototyping
Chapter 24. Debugging
To the uninitiated, debugging can seem somewhat like a black art. On the contrary, it’s actually one of the best skills you can have as a developer, though it’s rarely taught to novice coders, which I think is a tragic missed opportunity. All beginning coders make mistakes, and knowing about debugging will enable you to find and correct those mistakes much faster than just staring at the code and hoping the bug will reveal itself.
By the end of this chapter, you’ll understand the difference between a compile-time error and a runtime error, you’ll know how to set breakpoints in your code, and you’ll know how to step through the lines of your program one at a time to help you root out hard-to-find bugs.
Getting Started with Debugging
Before we can start finding bugs, we need to make some. For this chapter, we’ll start from the project you created for Chapter 18, “Hello World: Your First Program.” If you don’t have that project on hand, you can always download it from this book’s website:
http://book.prototools.net/
On the website, find this Chapter 24, “Debugging” and click to download the project for the beginning of the chapter.
Throughout this chapter, I instruct you to make a number of bugs on purpose. This might seem like a strange way to do things, but my goal in doing so is to give you some experience with tracking down and fixing several different kinds of bugs and other errors you will almost certainly encounter while working with Unity. Each of these example bugs will introduce you to a different kind of potential future problem and help you understand how to go about finding and fixing bugs when you encounter them.
Note
Throughout this chapter, I refer to errors occurring on specific line numbers. Sometimes this will be the exact same line number that you get for the error, and sometimes it may be shifted up or down by a couple of lines. Don’t worry if you don’t have exactly the same line numbers as I do, just look for the content that I’m discussing near the line numbers that I reference.
Compile-Time Bugs
A compile-time bug (or error) is a problem that can be discovered by Unity when it is compiling C# code (that is, attempting to interpret the C# code and turn it into the Common Intermediate Language that is then converted to machine language that can run on your computer). After you have opened the Hello World project in Unity, follow these instructions to intentionally cause a compile-time error and explore how they work:
1. Duplicate the existing _Scene_1. To do so, click _Scene_1 in the Project pane to select it and choose Edit > Duplicate from the menu bar. Unity is pretty good at counting things, so it will automatically increment the name of the scene and call this new scene _Scene_2.
2. Double-click _Scene_2 to open it in the Hierarchy and Scene panes. Once it’s open, the title of your Unity window should be _Scene_2.unity - Hello World - PC, Mac, & Linux Standalone. If you press Play, you should see everything behaving just as it did in _Scene_1.
3. Now we should make a second version of the CubeSpawner class so that we don’t end up damaging the one from _Scene_1. Click the CubeSpawner script in the Project pane to select it and then choose Edit > Duplicate from the menu bar. A script named CubeSpawner1 will be created and an error will immediately appear in the Console pane (see Figure 24.1). Click the error to get more information.
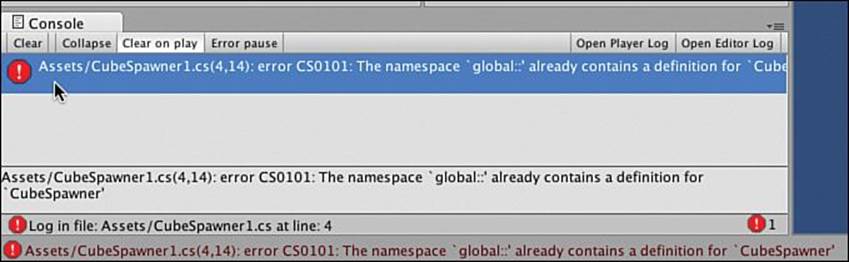
Figure 24.1 Your first bug: a compile-time error caught by Unity
There’s a ton of useful information in this error message, so let’s go through it bit by bit.
Assets/CubeSpawner1.cs(4,14):
Every error you encounter will include information about where Unity encountered it. This tells us that the error was in the CubeSpawner1.cs script inside the Assets folder of our project and that it happened on line 4, character 14.
error CS0101:
The second chunk of the message tells us what kind of error we’ve encountered. If you encounter an error that you don’t understand, you can do a web search for the words “Unity error” and the error code. (In this example, our web search would be for “Unity error CS0101.”) A search like this will almost always find a forum post or something similar that describes the problem you’re having. In my experience, you will generally get good results from http://forum.unity3d.com and http://answers.unity3d.com, and some of the best answers to issues come fromhttp://stackoverflow.com.
The namespace ’global::’ already contains a definition for ’CubeSpawner’
The final chunk of the error message attempts to put the error into plain English. In this case, it’s telling us that the term CubeSpawner is already defined somewhere else in our code, which it is. At this time, the scripts CubeSpawner and CubeSpawner1 are both attempting to define the class CubeSpawner.
Let’s get to work fixing this:
1. Double-click CubeSpawner1 to open MonoDevelop. (Alternatively, you can double-click the error message in the Console pane, which will open the script to the line that produced the error.)
2. Within the CubeSpawner1 script, change line 4 (the line that declares CubeSpawner) to read:
public class CubeSpawner2 : MonoBehaviour {
The CubeSpawner2 class name is intentionally different from the name of the script so that we can see another error in a moment.
3. Save your file and return to Unity, where you’ll see that the error message disappears from the Console pane.
Whenever you save a script, Unity detects the save and recompiles the script to make sure that there are no errors. If it does run into a bug, you’ll get a compile-time error message like the one we just fixed. These are the easiest bugs to fix because Unity knows exactly where the problem took place and passes this information on to you. Now that the CubeSpawner script is defining the class CubeSpawner and the CubeSpawner1 script is defining the class CubeSpawner2, the compile-time error is gone.
Compile-Time Errors Caused by a Missing Semicolon
Delete the semicolon (;) at the end of line 14, which is the line that reads:
14 Instantiate( cubePrefabVar );
This will cause another one of these compile-time error messages.
Assets/CubeSpawner1.cs(15,9): error CS1525: Unexpected symbol ’}’
You’ll notice that it doesn’t say “Hey, you forgot a semicolon,” but it does tell you where it ran into trouble compiling the script (character 9 of line 15). It also tells you that it encountered the closing brace ( } ) in an unexpected place. Given this information, you should be able to look around that area of the code and discover the missing semicolon.
Add the semicolon back on to the end of line 14 and save, and Unity should stop complaining. A compile-time error will almost always be detected either on the line that has the problem or on a later line. In this example, the missing semicolon was on line 14, but the problem was discovered on line 15.
Attaching and Removing Scripts
Switch back to Unity and try dragging the CubeSpawner1 script onto Main Camera in the hierarchy. This time, you’ll get the error shown in Figure 24.2.
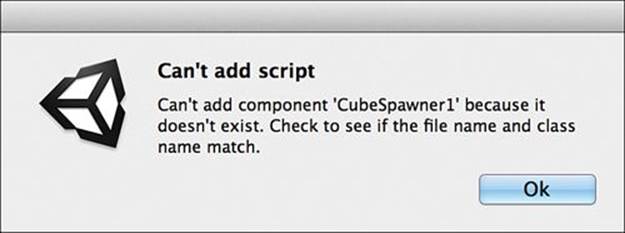
Figure 24.2 Some errors are only caught when you try to attach a script to a GameObject.
Unity is complaining because the name of our script, CubeSpawner1, doesn’t match the name of the class that we’re defining in the script: CubeSpawner2. In Unity, when you create a class that extends MonoBehavior (for example, CubeSpawner2 : Monobehaviour), the name of the class must match the name of the file in which it is defined.
To fix this, just make sure that the two names match. Click once on CubeSpawner1 in the Project pane to select it and then click a second time on the name to rename it. (You can also press the Return key on Mac or the F2 key on Windows to rename the script.) Change the name toCubeSpawner2 and try attaching it to the Main Camera again. This time, it should go with no problems.
Click Main Camera in the Hierarchy. In the Inspector, you should now see that Main Camera has both a CubeSpawner and a CubeSpawner2 script attached. Click the small gear icon to the right of the name Cube Spawner (Script) in the Inspector and choose Remove Component from the drop-down menu, as shown in Figure 24.3.
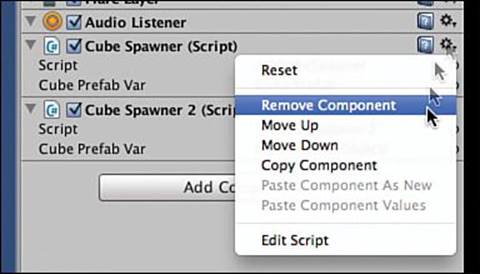
Figure 24.3 Removing the extra CubeSpawner Script component
This way, we won’t have two different scripts trying to spawn cubes at the same time. For the next several chapters, we’ll only attach a single script component to each GameObject.
Runtime Errors
Now, click Play, and you’ll encounter another kind of error (see Figure 24.4). Click the Pause button to pause playback (the button with two vertical bars next to the Play button), and we’ll take a look at this error.
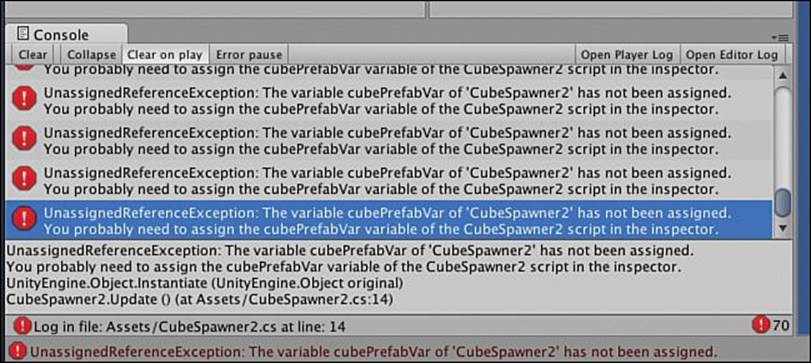
Figure 24.4 Many repetitions of the same runtime error
This is a runtime error, which means it’s an error that only occurs when Unity is actually trying to play the project. Runtime errors occur when you’ve typed everything correctly, as far as the compiler can determine, yet something is not right when the code actually runs.
You’ll see that this error looks a little different from the others you’ve seen so far. For one thing, the beginning of the error message doesn’t include information about where the error occurred, however if you click one of the error messages, you’ll see that additional information pops up in the bottom half of the Console. With runtime errors, the last line tells you the point at which Unity realized that an error had occurred. This sometimes happens on the line with the bug, and it sometimes happens on the next line. The error message here tells us to look at or near line 14 of CubeSpawner2.cs for the error.
CubeSpawner2.Update () (at Assets/CubeSpawner2.cs:14)
Looking at line 14 of CubeSpawner2, we see that it’s the line where we instantiate an instance of cubePrefabVar. (Note that your line number may be slightly different; if so, that’s okay.)
14 Instantiate( cubePrefabVar );
Just as the compiler thought, this line looks fine. Let’s delve into the error message further:
UnassignedReferenceException: The variable cubePrefabVar of ’CubeSpawner2’ has not been assigned. You probably need to assign the cubePrefabVar variable of the CubeSpawner2 script in the inspector. UnityEngine.Object.Instantiate (UnityEngine.Object original) CubeSpawner2.Update () (at Assets/CubeSpawner2.cs:14)
This tells us that the variable cubePrefabVar has not been assigned, and if you look at the CubeSpawner2 (Script) component of Main Camera in the Inspector (click Main Camera in the Hierarchy to do so), you’ll see that this is correct. So, just as we did in the previous chapter, click the circular target next to cubePrefabVar in the Inspector and choose Cube Prefab from the list of assets. You should now see it assigned to cubePrefabVar in the Inspector.
Click the Pause button again to resume simulation, and you’ll see that the cubes start spawning happily.
Click the Play button to stop the simulation. Now, click Play once more to start it up again.
What happened?!? We just got the same error again! Click the Play button once more to stop the simulation again.
Warning
Changes Made While Playing Don’t Stick! This is an issue that you will encounter many times. There are good reasons for making Unity work this way, but it’s sometimes confusing to new users. Any changes you make while Unity is playing or paused (like the change you just made to cubePrefabVar) are reset back to their previous values when playback is stopped. If you want a change to stick, make sure that Unity is not playing when you make the change.
Now that Unity is stopped again, use the Main Camera Inspector to assign Cube Prefab to the field cubePrefabVar again, and this time, it should stick. Press Play, and everything should work out fine.
Stepping Through Code with the Debugger
In addition to the automatic code checking tools that we’ve already explored in this chapter, Unity and MonoDevelop also enable you to step through code one line at a time, which can be very helpful for understanding what’s happening in your code. Add the bolded lines in the following code listing (that is, lines 13 and 16-26) to your CubeSpawner2 script. If you need to make room in the script, just press Return (Enter on Windows keyboards to add new lines). The code is also shown in Figure 24.5:
1 using UnityEngine;
2 using System.Collections;
3
4 public class CubeSpawner2 : MonoBehaviour {
5 public GameObject cubePrefabVar;
6
7 // Use this for initialization
8 void Start () {
9 }
10
11 // Update is called once per frame
12 void Update () {
13 SpellItOut(); // 1
14 Instantiate( cubePrefabVar );
15 }
16
17 public void SpellItOut () { // 2
18 string sA = "Hello World!";
19 string sB = "";
20
21 for (int i=0; i<sA.Length; i++) { // 3
22 sB += sA[i]; // 4
23 }
24
25 print(sB);
26 }
27 }
1. Line 13 calls the SpellItOut() function.
2. Lines 17-26 declare and define the function SpellItOut(). This function will copy the contents of string sA to string sB one character at a time.
3. This for loop iterates over the length of sA. Because "Hello World" consists of 11 chars, the loop will iterate 11 times.
4. Line 22 pulls the ith character from sA and concatenates it onto the end of sB.
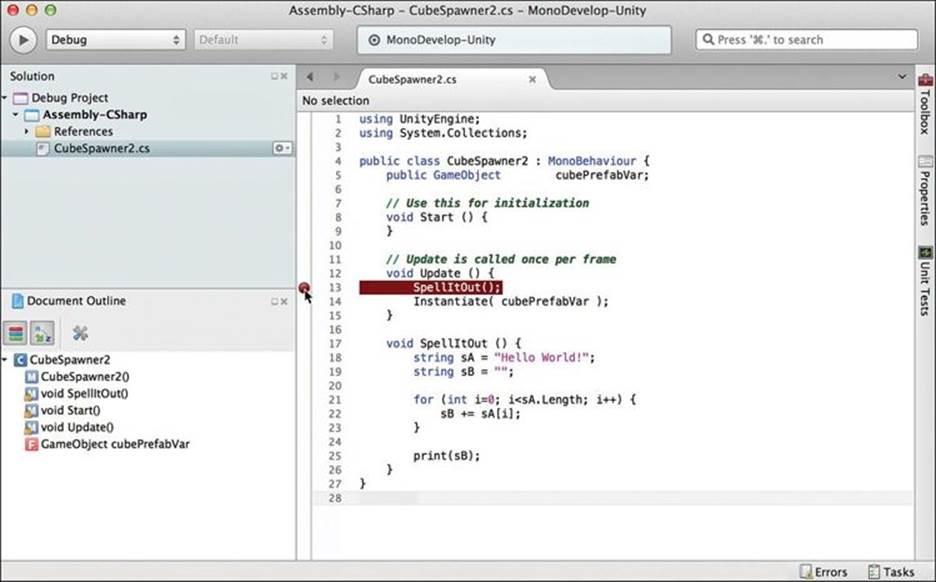
Figure 24.5 The SpellItOut() function showing a breakpoint on line 13.
Here, we’ve created a function called SpellItOut() that will copy the string sA to the string sB letter by letter. This is a horribly inefficient way to copy a string, but it will work very well to demonstrate how the debugger works.
Once you’ve typed in all the code and double-checked it, click in the gutter to the left of line 13 (as shown in Figure 24.5). This will create a breakpoint on line 13, which appears as a red circle. When a breakpoint is set and MonoDevelop is debugging Unity, Unity will pause execution every time it hits that breakpoint. Let’s check it out.
Attaching the Debugger to Unity
Warning
Attaching the Debugger Before Starting Your Unity Project Will Sometimes Crash Unity on OS X! As of the time of writing this book, Unity and MonoDevelop on OS X still have a sporadic issue with pressing Play in Unity with the MonoDevelop debugger already attached. Unity is aware of the issue, so hopefully it will be resolved by the time you read this book, but in case it is not, the instructions in this section about how to attach the debugger to Unity will direct you to attach it once Unity is already playing and to detach and reattach it any time you want to stop and restart playback. If you are on a PC (or if you’re on OS X and you’re feeling lucky), you can attach the debugger to Unity before pressing Play in Unity, and everything should work fine. This shouldn’t be a problem on OS X for the small projects in this section of the book, but it has happened to me sporadically on large projects.
If you encounter this bug, Unity will freeze when you start playback without MonoDevelop having any reaction. Both Unity and MonoDevelop will become unresponsive. To solve this, you will need to force quit Unity, as explained in the “How to Force Quit an Application” sidebar.
How to Force Quit an Application
On an OS X Computer
Implement a force quit by doing the following:
1. Press Command-Option-Esc on the keyboard. This will bring up the Force Quit window.
2. Find the application that is misbehaving. Its name will often be followed by “(not responding)” in the applications list.
3. Click that application, and then click Force Quit.
On a Windows Computer
Implement a force quit by doing the following:
1. Press Shift+Ctrl+Esc on the keyboard. This will bring up the Windows Task Manager.
2. Find the application that is misbehaving.
3. Click that application, and then click End Task.
If you have to force quit Unity while it’s running, you will lose any work that you’ve done since your last save. Because you must constantly save C# scripts, they shouldn’t be an issue, but you might have to redo unsaved changes made to your scene.
For MonoDevelop to be able to debug what’s happening in Unity when it plays, you need to attach it to the Unity process. Once the MonoDevelop debugger is attached to Unity, it will be able to peer into the depths of what’s happening in your C# code and can pause execution of the code at breakpoints (like the one you set on line 13).
Because of the potential Unity/MonoDevelop bug mentioned in the warning, it is best to first start Unity playing and then attach the debugger. To do so, follow these steps:
1. Click the Pause button in Unity (next to the Play button at the top of the Unity window).
2. Click the Play button. Pressing the Pause button before play ensures that Unity goes through the setup to play but only plays the first frame of your application before pausing. Now both the Play and Pause buttons should be colored blue.
3. Switch to the MonoDevelop application and either click the Play button in the top-left corner of the MonoDevelop window (as shown in Figure 24.6) or choose Run > Attach to Process from the MonoDevelop menu bar.
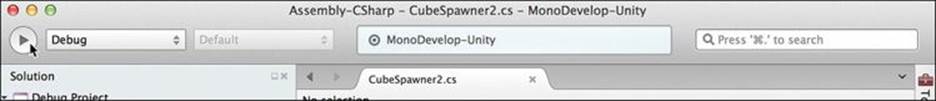
Figure 24.6 Click this button to attach the debugger to the Unity Editor process.
This will pop up a window (see Figure 24.7) that enables you to choose a process to debug (on Windows machines, the null (mono) process usually does not appear). The processes listed are applications running on your machine that MonoDevelop can connect to and debug. Unity and MonoDevelop are separate programs (that is, processes), and through this interface, Unity allows MonoDevelop to attach to it and control its execution.
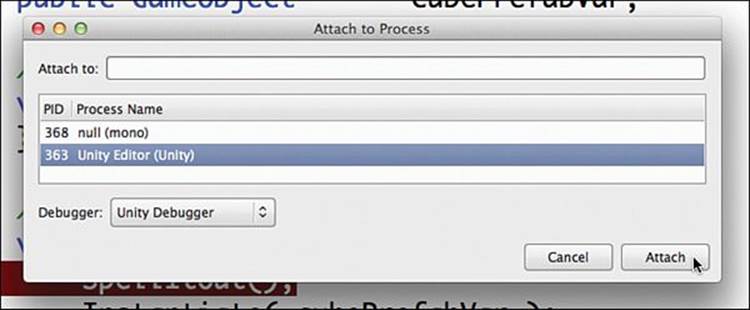
Figure 24.7 Selecting the Unity Editor process for debugging
4. Click the Unity Editor (Unity) process to select it, and then click the Attach button. This will cause MonoDevelop to switch into its debug mode and will set us up for debugging. It can take a few seconds for this to happen, so don’t worry if things seem to freeze for a bit. When the switch is complete, you’ll notice that the MonoDevelop window has changed (see Figure 24.8). The Play button in the top left has become a Stop button, a couple of panes have appeared at the bottom of the MonoDevelop window, and a number of buttons to control the debugger have appeared at the top of MonoDevelop window (see Figure 24.9).
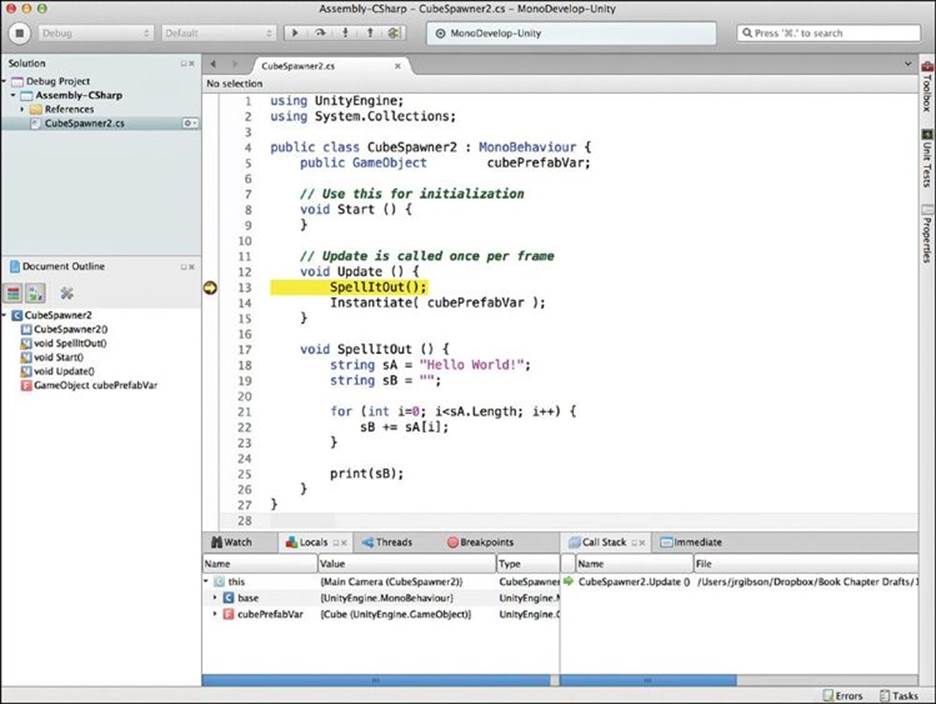
Figure 24.8 Execution stopped at line 13 in the debugger.
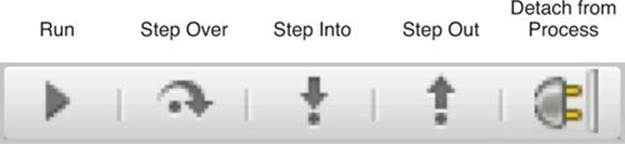
Figure 24.9 The debugger control buttons
Note
My MonoDevelop May Look a Bit Different In MonoDevelop, you can move window panes (or panels) around just as you can in Unity. I’ve moved mine to make it easier for you to see what I’m doing in these book examples, but that will probably mean that it looks a little different from what you’re seeing on your screen. You should have all the same panes, they will just be arranged slightly differently.
5. Now that we have the debugger ready and attached, switch to Unity and click the Pause button to unpause Unity. Almost immediately, Unity will freeze, and MonoDevelop should pop up. Sometimes, on Windows, MonoDevelop won’t automatically pop up, but Unity will look frozen. Just switch to the MonoDevelop task manually, and you should see what is shown in Figure 24.8.
Execution of the Update() function has paused on line 13 where we placed the breakpoint. The yellow arrow in the gutter shows the current line of execution. While execution is stopped in the debugger, the Unity process is completely frozen. That means that we can’t switch back to Unity through any normal means until it is running again.
In debug mode, some of the buttons at the top of the toolbar have changed (see Figure 24.9).
The following steps show you how the various debugger control buttons work. Before following these steps, I recommend reading the “Watching Variables in the Debugger” sidebar.
1. Click the debugger’s Run button in MonoDevelop (shown in Figure 24.9). This will cause Unity to continue the execution of the script. When Unity is stopped at a breakpoint like the one on line 13, everything about Unity is frozen until you tell it to continue.
When you click the Run button, Unity starts running again and does so until it hits another breakpoint. When you clicked Run, Unity passed through the game loop, started a new frame, and then stopped on line 13 again (when Update() was called).
Note
Depending on the type of computer you have, you may need to switch back to the Unity process (that is, application) for Unity to actually move on to the next frame. On some machines, Unity will continue on to the next frame while you are using MonoDevelop, and on some it won’t. If the yellow arrow doesn’t return to the breakpoint in the debugger after you’ve clicked run, switch to the Unity process, and it should start the next frame and then stop on the breakpoint again.
As mentioned previously, while the code is stopped in the debugger (that is, when you can see the yellow arrow shown in Figure 24.8), you cannot switch to the Unity process. This is normal and occurs because Unity is completely frozen while it is waiting for you to look at code in the debugger. Unity will resume normal function once you’re no longer debugging.
2. Once the yellow execution arrow has stopped on the line 13 breakpoint again, click the Step Over button. The yellow arrow will move on to line 14 without stepping into the function SpellItOut(). The SpellItOut() function is still called and still runs, but the debugger passes over it. Step Over is useful if you don’t want to see the inner working of a function that is called.
3. Click Run again. Unity will advance to the next frame, and the yellow execution arrow will again stop on the line 13 breakpoint.
4. This third time around, click Step Into. You’ll see that the yellow arrow jumps from line 13 into line 18 of the function SpellItOut(). Any time you click Step Into, the debugger will enter into any functions called, whereas Step Over will jump over them.
5. Now that you are inside the SpellItOut() function, click Step Over several times to walk through the execution of the SpellItOut() function.
6. As you continue to click Step Over, you can watch sA and sB change through the course of this function (see the sidebar “Watching Variables in the Debugger”). Each pass through the for loop on lines 21-23 adds a character from sA to the string sB. You can see the values of the variables change in the Locals debugger panel.
Watching Variables in the Debugger
One of the great strengths of any debugger is the ability to look at the value of an individual variable at almost any time. There are three possible ways to do so in MonoDevelop’s debugger. Before trying any of these, be sure that you’ve followed the directions in this chapter to start the debugging process and that the yellow execution arrow is currently paused on a line of code in the debugger.
The first and simplest method is to just hover your mouse pointer over any variable in the MonoDevelop code pane. If you position the mouse pointer over a variable name and keep it still for about 1 second, a tool tip will appear telling you the value of that variable. However, it is very important to note that the value shown is the current value of the variable based on the position of the yellow arrow, not the position of that variable in the code. For example, the variable sB of the function SpellItOut() is repeated several times throughout the code, and holding the mouse over any of them will show the current value of sB regardless of which sB you hover over.
The second method is to find the variable in the Locals pane of the debugger. To view this pane, choose View > Debug Windows > Locals from the MonoDevelop menu bar. This will bring the Locals variable watching pane to the front. Here, you will see a list of all local variables that are available to the debugger at the current time. If you step into the SpellItOut() function as instructed in this chapter, you will see three local variables listed: this, sA, and sB. The variables sA and sB are initially set to null, but their value appears in the Locals pane once it has been defined on lines 18 and 19, respectively. When you have used Step Over a few times and reached line 21 in the debugger, you will see that the integer i is both declared and defined on that line. The variable this refers to the current instance of the CubeSpawner2 script. Click the disclosure triangle next to this to reveal the public field cubePrefabVar inside this as well as a variable named base. Opening the disclosure triangle next to base reveals all of the variables associated with the base class of CubeSpawner2, which is MonoBehaviour. Base classes like MonoBehaviour (a.k.a. superclasses or parent classes) are covered in Chapter 25, “Classes.”
The third way that you can watch a variable is to enter it explicitly into the Watch pane. To bring the pane to the front, choose View > Debug Windows > Watch from the menu bar. In the Watch pane, click a blank line to add a watched variable. (Click in the field with the text “Click here to add a new watch.”) In this field, type the name of a variable, and MonoDevelop will try to show you its value. For example, enter the variable this.gameObject.name and press Return, and it will show you “Main Camera,” the name of the GameObject to which this script is attached. If the value is ever too large to fit in the Watch pane, you can click the magnifying glass next to the value to read the whole thing; this sometimes happens when you’re working with large strings of text.
7. If the yellow execution arrow is still within SpellItOut() continue to Step 8, but if you clicked Step Over enough times to exit the function SpellItOut(), click Run, and then click Step Into to return execution to the inside of SpellItOut().
8. While still inside the SpellItOut() function, click Step Out. This will cause the debugger to exit the SpellItOut() function and then continue to line 14 (the line immediately after SpellItOut() was called). This is different from a return statement because the rest of theSpellItOut() function is still executed, you just don’t witness it in the debugger. This is useful when you want to exit the current function yet don’t want to completely return to full-speed execution by clicking Run.
Finally, the Detach from Process button shown in Figure 24.9 will detach the MonoDevelop debugger from the Unity process, stop debugging, and return Unity to normal execution.1 You can also press the large Stop button in the top-left corner of the MonoDevelop window to detach from the Unity process and stop debugging.
1 If you do encounter the crash on debug start issue mentioned in the warning at the beginning of this section, you need to detach and reattach the MonoDevelop debugger after each time you stop your game in Unity. Otherwise, if the debugger is still attached, you may get the crash the next time you press Play in Unity.
I highly recommend using the debugger to examine the execution of the recursive Fac() function that is featured at the end of Chapter 23, “Functions and Parameters.” That function is an excellent example of how the debugger can help you better understand code.
Summary
That’s it for your introduction to debugging. Although in this case we did not use the debugger to discover a bug, you can see how it can help you better understand code. Remember this: Whenever something is confusing in your code, you can always step through it using the debugger.
Though it may have seemed a bit frustrating for me to instruct you to generate so many bugs, my sincere hope is that helping you to experience and understand these bugs and how to investigate and fix them will give you a leg up later when you encounter real bugs on your own. Remember that you can always search the Internet for the text of the bug (or at least the error number) to find clues for fixing it. As I wrote at the beginning of the chapter, good debugging skills are one of the major things that can help you to become both a competent and confident programmer.