Administering ArcGIS for Server (2014)
Chapter 4. Planning and Designing GIS Services
If you are in a production environment, there are factors that should be considered before publishing GIS services. While your entire library of data could be published as GIS services, it does not mean that you should do this. Publishing services is an expensive process, it tends to consume a lot of resources and server power and has to be maintained regularly. Therefore, it is recommended that you plan the services you are going to author. This chapter will cover two main topics: planning and designing.
The planning stage consists of two steps: The first step is acquiring and analyzing the requirements. This answers questions such as what is it that you want to accomplish? Why do you chose to publish services as your solution? Can your problem be solved more efficiently with a direct connection to the geodatabase? The second step involves the decision of what parts of your geodatabase should be exposed as GIS services. This should be based on the analysis carried out in the first step.
In the designing stage, you will learn how to design services you select and explicitly revise more concrete details in the process. You will answer questions such as what standards will the GIS services support? Which clients will consume your services? Will you publish each layer as a service, or multiple layers in a service? Each has its pros and cons and we will discuss these in this chapter. I believe it is better to kick-start this chapter with a case study. This way, you will be able to link the planning stage to your problem and act accordingly.
Case study of Bestaurants – the restaurants locator in Belize
Belize is thriving in tourism. Lots of tourists go there on holiday to enjoy its beautiful beaches and wide range of restaurants. The Government of Belize is trying to enrich tourists' experience in finding their favorite restaurants in the country more effectively. To accomplish that, a new project titled Bestaurants has been proposed, with which tourists can find restaurants on their mobile phone or through kiosks that the government will provide at different locations in the country. The Belize government keeps records of all its landmarks, including beaches, entertainment venues, bars, restaurants, cafes, saloons, and so on, in an Excel document that is updated regularly, along with a collection of images and promotional videos of the landmarks available for free to the tourists. You are required to design a solution using ArcGIS for Server that will allow tourists to find restaurants near their locations and filter them by category and rating. The solution should also provide an option of finding the most popular restaurants in Belize. You can find the Excel sheet in the chapter files package 7364EN_04_Files\AGSA\Data, which can be downloaded from www.packtpub.com.
Planning GIS services
From what you have read in the case study, you may have realized that the solution cannot be implemented directly. There is some infrastructure that needs to be built. There is no database and there are no explicit networking requirements, so we have some freedom when it comes to planning. Therefore, we can start analyzing the requirements and come up with an optimal solution, which is the sole purpose of the planning stage. You are instructed to specifically use a server, which means that the Belize government might have already done its research and selected the server as its underlining infrastructure for this and future implementations.
Analyzing requirements
Let's start with the main goal of this study. Our solution needs to visualize the restaurants in the country, so I'm thinking there must be a map—a basemap—that contains basic geographic land cover of the country. There is no mention of such data in the case study. This map requires the restaurants' data source, hence we must have these records in a database, which is not the case here either. We only have an Excel document of all Belize landmarks that happens to include the restaurants. We need to find a way to filter this information out of the file. To visualize the restaurants on the map, the map requires the coordinates of each place.
We also need tourists to differentiate between restaurants, cafes, and bars. There must be some sort of categorization that we can later create symbology for. Finally, it is required that tourists can find restaurants located near them and can find the most popular restaurants. Therefore, we should enable the query capability on this data so that users can search based on the current GPS location or by specifying an explicit query. Finally, there is a media repository for these restaurants that we should link and take into consideration while designing our database.
Nominating GIS services
Now, we will decide what GIS services we might need to plan based on the requirements that we have analyzed before. To give you a better idea of the planning process, I propose two options, and will assess the feasibility of each in the design phase. This means we will need to come up with two designs later and implement them accordingly.
Option 1 – single service
The first option is to propose a single GIS service that will hold all of this information. Regardless of how we will design this service, we should be able to visualize restaurants, cafes, and bars in Belize, and differentiate between them with proper symbology based on the category. Users can also query this service to find restaurants based on a location or a particular filter.
Option 2 – multiple services
The second option is to plan multiple services instead of a single one. Why you would do this, however, is something that I will answer in the design stage, in which you will choose your preferences. In this case, we propose three GIS services: Restaurants, Cafes, and Bars, each isolated in a separate service. All three services should be included along with the base map in the platform that will be used.
Designing GIS services
Now that we have planned which services should be authored, we need to create the blueprint of the services and their design. Also, we have to decide what the underlying database design is, how the services will be authored, and what standards they will support. We will get to these technical questions in the coming pages. Note that we proposed two options in the planning stage, so we need to produce two designs. I usually use the Unified Modelling Language (UML) as a tool for designing GIS services, specifically the deployment diagram as it provides a good blueprint of the GIS services design. There are plenty of UML books out there if you want to get into it: my favorite is UML Distilled by Martin Fowler. As for the database design, we will use the entity-relationship diagram.
Database design
There is no database mentioned in the case study, and no database means no geodatabase. This means we cannot create GIS services without a geodatabase. So, we need to come up with a design for this database. This design should cater to the requirements analyzed in the planning stage. A weak design could cause your solution to collapse, and could be very expensive to repair. Let's take a look at the Belize landmarks Excel sheet provided with the case study. Go ahead and open the Belize_Landmarks.xls file in files package 7364EN_04_Files\AGSA\Data. I have copied a few records here. Take a look, and you will find there are some useful fields: Category and SubCategory, Longitude and Latitude information (which is very important to georeference the restaurants), and finally, the Rating of a landmark.
|
ID |
Name |
Category |
SubCategory |
Longitude |
Latitude |
Rating |
|
1 |
Raggamuffin Tours |
Activities |
Activities |
-88.02370166 |
17.74716893 |
7 |
|
3 |
Habaneros |
Food and Drink |
Restaurants |
-88.0243206 |
17.74274661 |
10 |
|
4 |
Amor Y Café |
Food and Drink |
Cafes |
-88.02455832 |
17.74232287 |
8 |
|
5 |
I&I Reggae Bar |
Food and Drink |
Bars |
-88.02535194 |
17.74058384 |
7 |
|
6 |
Bamboo Grill |
Food and Drink |
Restaurants |
-88.02352708 |
17.74389439 |
10 |
|
7 |
The Split |
Sights |
Sights |
-88.02352708 |
17.74389439 |
4 |
Note
You can convert this Excel sheet into a shape file and use it to publish the map service. However, a proper geodatabase is recommended, such as a personal, file, or enterprise.
The Entity-relationship diagram
There are many tools to create the entity-relationship (ER) diagram. Microsoft Visio is one of them, however, since I'm between Mac and Windows I like to use Gliffy. This is an HTML5 online sketching tool that is very useful for creating various design diagrams including UML and ER. You can save up to five diagrams with the free version and export it into various formats. You can access Gliffy from www.gliffy.com.
Note
Entity Relationship (ER, sometimes ERD or ERM) is a data model for describing the elements and relations between the database elements.
If you look into the requirements, you will find that there are three main categories: Restaurants, Cafes, and Bars. So, one might think that we can create three tables. While denormalizing tables can be good for optimization, it is a high-maintenance and inefficient design for three main reasons that I can think of. First, new categories might be introduced later, thus a new table needs to be created for each category. The second reason is that some information might be repeated among the three tables. Another reason is for any future maintenance, for example, joins and indexing you would carry out on all these tables is not very efficient.
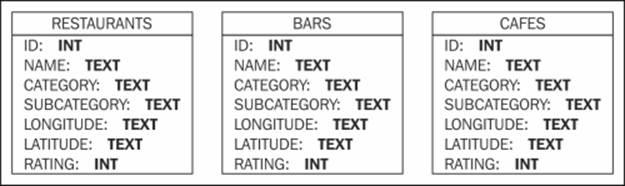
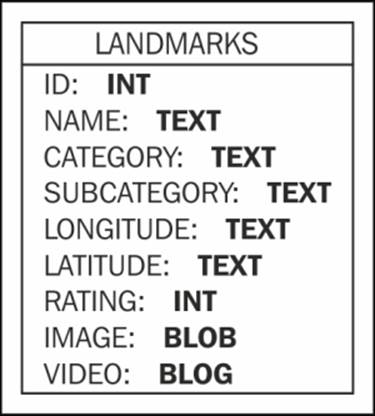
We will stick with one table containing all the categories and will import whatever fields the Excel document has into this table The second thing is that there are pictures and videos linked to each landmark, so we can consider adding two new Binary Large Object(BLOB) columns to our table.
Note
BLOB is an array of binary data stored in a single database field. Any file type can fit into a BLOB field.
The BLOB data type is good for storing raw pictures and video formats. In this case, we use one for the picture of the landmark and one for the video promotion.
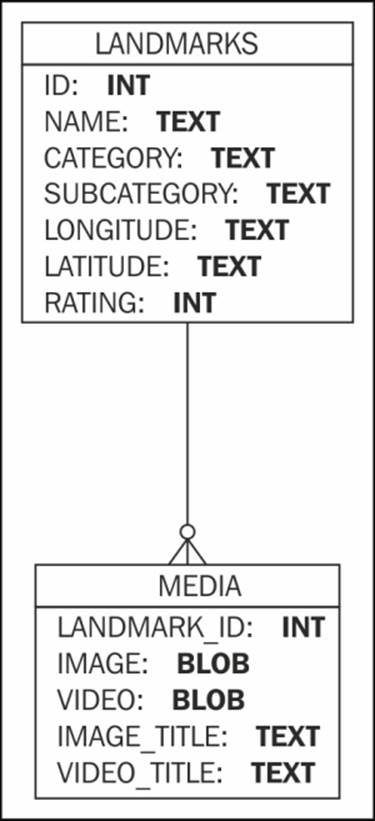
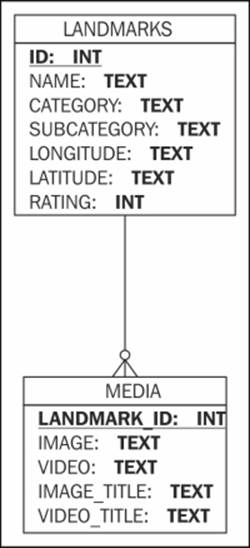
There is a limitation to this design. There might be multiple pictures for the same landmark, however, this design permits one picture and one video for each landmark. I don't think Belize tourists will be so thrilled with this, so we need to fix it. To solve this limitation, we can add a new table that will hold the media of all landmarks and then add a one-to-many relationship between these two tables. This way, a landmark can have multiple pictures and videos. We can also add two more text columns for a picture and video description.
This looks much better. I think this will be enough to satisfy the study requirements. However, I am skeptical about whether the database could hold all these large media files, and it could eventually slow the performance of our queries. Moreover, what happens when you want to assign a new video or a picture to a landmark? There must be a custom interface. What about editing an existing picture? Can the administrator retrieve and change a BLOB field? Although the design is correct, it is not an efficient one. To fix this, we can move all pictures and videos into a dedicated Web server separated from the database; we basically link the images and videos there. What is even better is that we could upload the videos to YouTube and provide the URL, thus saving lots of space. Plus, tourists can share the YouTube link with their friends, which means more exposure for Belize! So, we can now change the BLOB fields into texts.
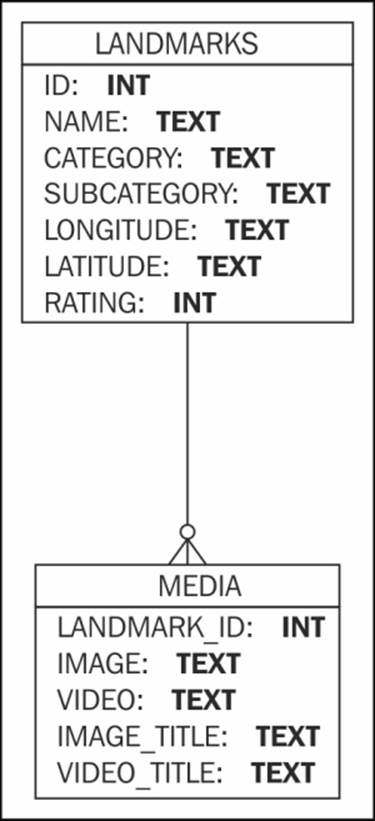
We just relieved the database with our design; this should be our final ERD. Let's add the final touches, the primary and foreign keys.
Optimizing using the database indexing
Indexing is a database technique that helps optimizing queries carried out frequently in a particular column. It basically analyzes the column data and organizes it in a way so that the search can be done much more efficiently. From the planning stage, we learned that users of the system will need to query the GIS service to find restaurants nearby. Therefore, it is good to enable indexing on the columns that will be used. Note that not all of the categories in the database will be visualized. For instance, it is not required for us to show activities, so we need to filter those out as we can't delete these records; the latter would mean tampering with the database. We can't hide them either, so we need a query to display only those landmarks that fall under the Food and Drink category. TheStructured Query Language (SQL) query will be something like the following:
SELECT * FROM LANDMARKS WHERE CATEGORY = 'Food and Drink';
Unfortunately, we cannot model indexes in the ER diagram, but we can implement it using our favorite DBMS.
Note
SQL is a special programming language designed for data retrieval and manipulation on a relational database.
GIS services design
Designing GIS services is an essential process when you are building an infrastructure for an organization. You have to properly study your requirements, like we did in the previous section, and propose the goals from these requirements. Then you can stir your solution toward that goal using the design techniques. Therefore, any service we propose should be necessary and should serve that goal. It should be designed to fit the requirements. We have proposed two options in the planning stage, so we need to make two UML designs.
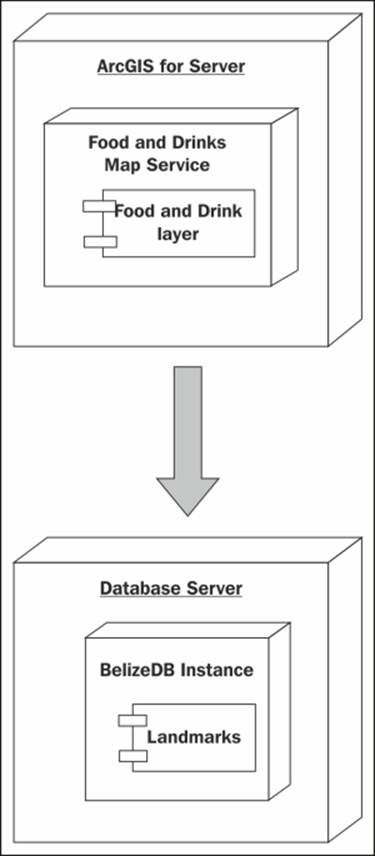
Option 1 – single map service
As the name suggests, the single service design consists of one service that holds all the restaurants. The way we model this, however, is entirely up to us. A service is basically a map document published on Server and contains layers pointing to the database. Now that we have designed the database, we need to apply the design for the GIS service data. I could start with a very simple design, the Food and Drink layer. This layer includes the three categories: Restaurants, Bars, and Cafes. Since the Landmarks table contains all landmarks, we create a definition query in the layer to filter out only those objects that belong to the Food and Drink category. In a deployment diagram, we usually model the servers and their components and how they are communicating. In this case, we have two servers. First, the database server with one database instance, BelizeDB, that has our database design implemented.
Second is a server to hold ArcGIS for Server, in which we should include our food and drink service. In that service, there is one layer that points to the database server, specifically the landmarks table.
Let's think about this. If we went ahead and published that service, what would our tourists see? They will see all food and drinks in a layer. They don't actually know what a layer is, but I suppose we can make a little legend on the side to tell them what is what.
Let's assume that it is a tourist's bachelor party and he is planning to drop by all the bars in Belize tonight. He uses this system to locate nearby bars, but what he sees is simply everything. He asked if he could hide the Restaurants and Cafes and show only the bars. Guess what? You can't help! Anyone familiar with GIS will know that you cannot just turn off a symbology, you can either turn off an entire layer or nothing. So, we found a little problem with our design. To fix that, we need to separate each category in a layer.
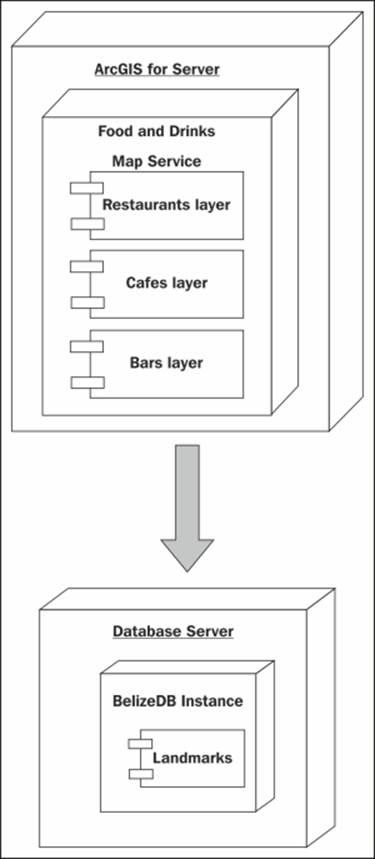
Option 2 – multiple map services
The other option is to publish the layers we authored as separate services. In other words, the Restaurants, Bars, and Cafes each go into a separate dedicated service. We will get to know why we would want to do that in this section. There are many incidents where you want your services detached from one another: better resource management, tightened security, or sometimes even optimization. The UML deployment diagram of a multiservice version of our solution looks like the following:
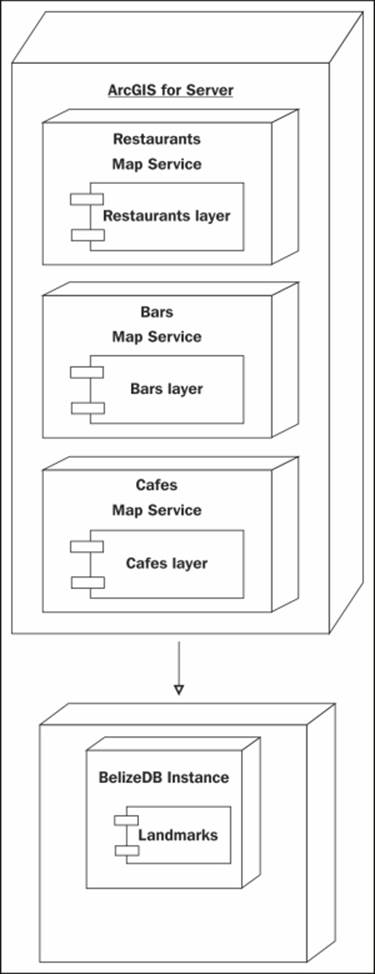
Single or multiple service designs
Comparing the two options really depends on the requirements. The two proposed designs will hold up in the implementation stage. You can run further analysis to test the robustness of your designs and finally select one. There are pros and cons to each option here. If you took the first option, a single service design is a good solution, particularly if you want to consume less resources. One service will hold all your data, thus ensuring data integrity. You can easily update your data and republish the service conveniently. Moreover, if something went wrong with your data, you have a single point of management, instead of managing multiple services. However, the downside with single service design is that you will have limited security control, because ArcGIS for Server maintain logs on the services level rather than the data level. So, whatever design you pick eventually should be made based on a trade-off. If you don't care much about security and control, you can slam all your data into a single service. However, if you have large data and you need to set privileges on who can access what, a multiservice design will probably work better for you.
Deploying GIS services
In the deployment stage, we go from abstract design, where we have everything, such as documents, diagrams, and flow charts, to concrete implementation, where we need to explicitly select what systems we need to interact with. The selection depends on what DBMS will manage our database and the other steps required for the implementation. I mentioned a very important stage that I cannot model in the design, which is how to convert our database into a geodatabase and then use it to publish our services.
Enabling geodatabase
The database we have designed is not geo-enabled, thus we cannot publish GIS services before we enable geodatabase on that database. To do that, we need a DBMS and an enterprise geodatabase, but we can also make it with a personal geodatabase.
Note
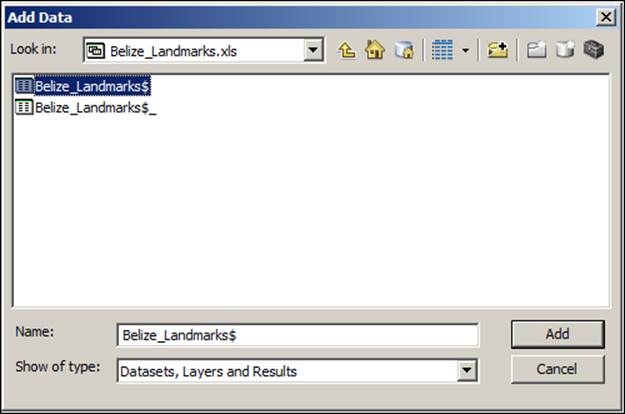
You must have Microsoft Office installed for ArcMap to connect to the Excel sheet.
Open ArcMap. From the main menu, click on Add Data and browse to the file Belize_landmarks.xls, double-click on the file, and select the Belize_Landmarks$ sheet to add it to the map as shown in the following screenshot:
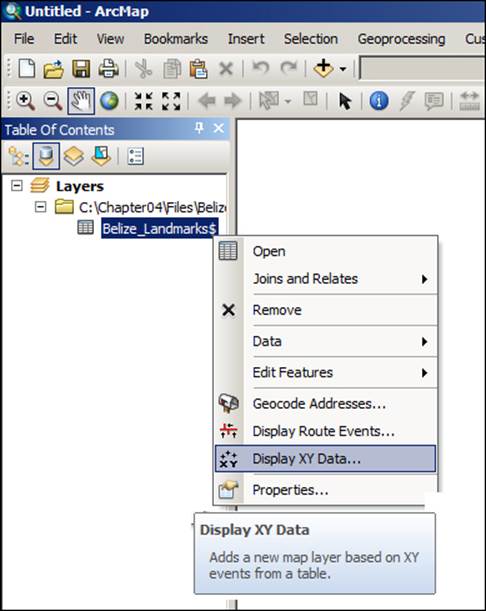
You can't exactly see anything yet on the map because this Excel sheet is just a table, but fortunately, ArcMap can fix this. It can turn this mere table into a geo-enabled feature class. To do that, right-click on the Belize_Landmarks$ table in the Table of Contentsand click on Display XY Data.
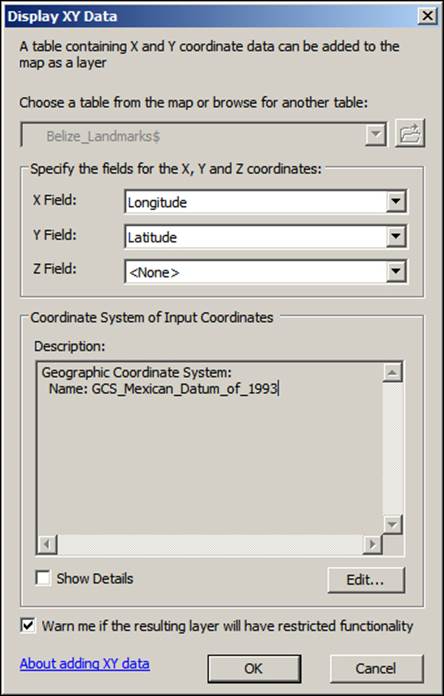
Although what we have are not, in fact, the X and Y coordinates, they are longitude and latitude data. ArcMap already figured that out and selected them for you as you can see in the Display XY Data form. Just in case you didn't get that, from the X Field drop-down list, select the Longitude column and from the Y Field drop-down list, select the Latitude column. Now, we have to set the coordinate system. We will set it to Mexican Datum of 1993. Click on the Edit button and then expand Geographic Coordinate System. Then expand the North America node and select Mexican Datum of 1993. Click on OK to close the Spatial Reference Properties window and click on OK to accept the change. You might be prompted with a warning message saying that there is no ObjectID for the table. ArcMap needs it to keep track of each record so that it can simply generate its own field.
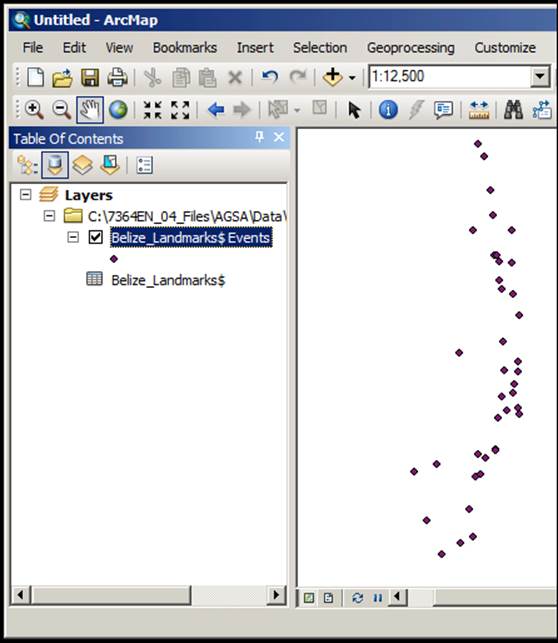
ArcMap will begin working on your table to display the longitude and latitude information on the map. Once this is done, you will see the map with the default symbology.
This is a good step, but it is still a table. It is not a geo-enabled object yet, so we need to export it with whatever changes we have made to the personal or file geodatabase. To do that, you can follow the given steps:
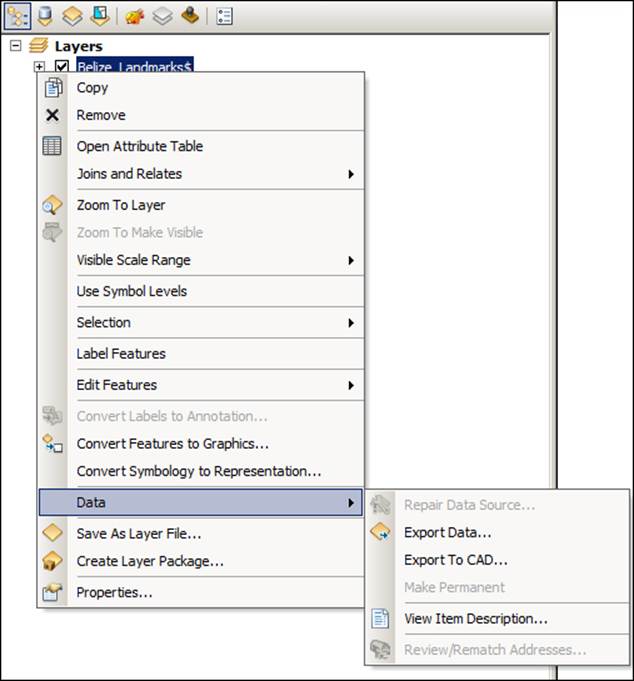
1. Right-click on the Belize_Landmarks layer from the Table of Contents, point to Data, and click on Export Data as shown in the following screenshot:
2. From the Export drop-down list, select All Features and in the output feature class field, click on the browse icon. This will ask you to select an existing geodatabase. Because we don't have one, we will create a temporary one.
3. First, browse to the file package 7364EN_04_Files\AGSA\Data and from the Saving Data dialog, click on the New File Geodatabase icon on the left to create a new file geodatabase.
4. Name it Belize and then select it.
5. Name your feature class Landmarks and then click on Save. The new geodatabase won't appear unless the Save as type is set to File and Personal Geodatabase feature classes.
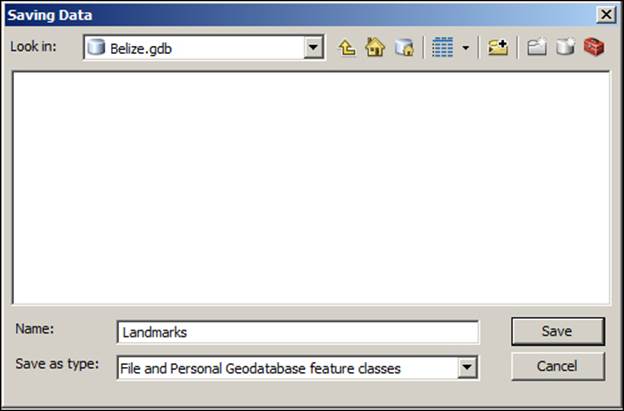
6. Click on OK to start exporting.
7. After the process is finished, ArcMap will ask if you want to add the new feature class to the map, click on Yes.
8. Uncheck the old table and leave the new layer checked.
You have successfully created a geodatabase out of Belize tabular format.
Tip
Best practice
It is recommended to move this feature class to an enterprise geodatabase of your choice, as we have designed in the UML deployment diagram.
Adding a world basemap
You will need some land cover information in order to visualize the landmarks and since the case study did not specify any, we will use ESRI world public service. To add the base map for the world data, you can use the REST URLhttp://server.arcgisonline.com/ArcGIS/rest/services/World_Topo_Map/MapServer and add it to your map. You can refer to the previous chapter for more details on this subject.
Authoring GIS services
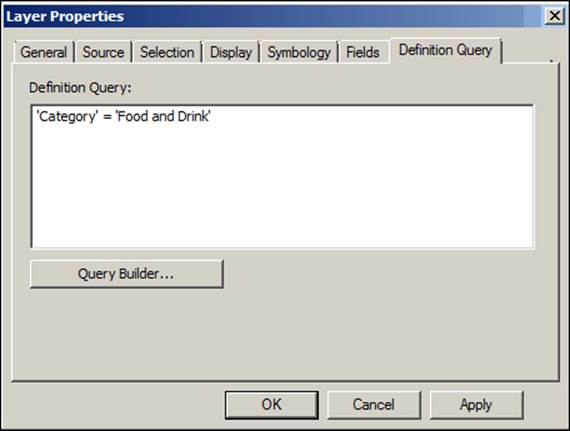
Now that we have a geodatabase, you can use the skills you acquired in the previous chapters to implement this design. You can see how we drove through the case study, from the planning, analyzing, designing, and now to implementing the solution. You can practically apply these steps to all your projects. There are, however, a few things we need to do before you implement the design. The map document needs to be prepared and there is some work to do on that. Open a fresh ArcMap document and add your newLandmarks feature class from the Belize geodatabase. As you may have noted, this feature class contains all categories. We need to filter them and display only the Food and Drinks data. So, the first thing to do is rename the Landmarks layer to Foods and Drinks so that we don't get confused. Then, we need to apply a definition query, double-click on the Foods and Drinks layer to receive a pop up with its Layer Properties and activate the Definition Query tab. Type in the following query:
"Category" = 'Food and Drink'
To prevent errors, you may use the query builder, a tool in ArcMap that helps you build and verify SQL statements. This will only show those features that fall into the Food and Drinks category.
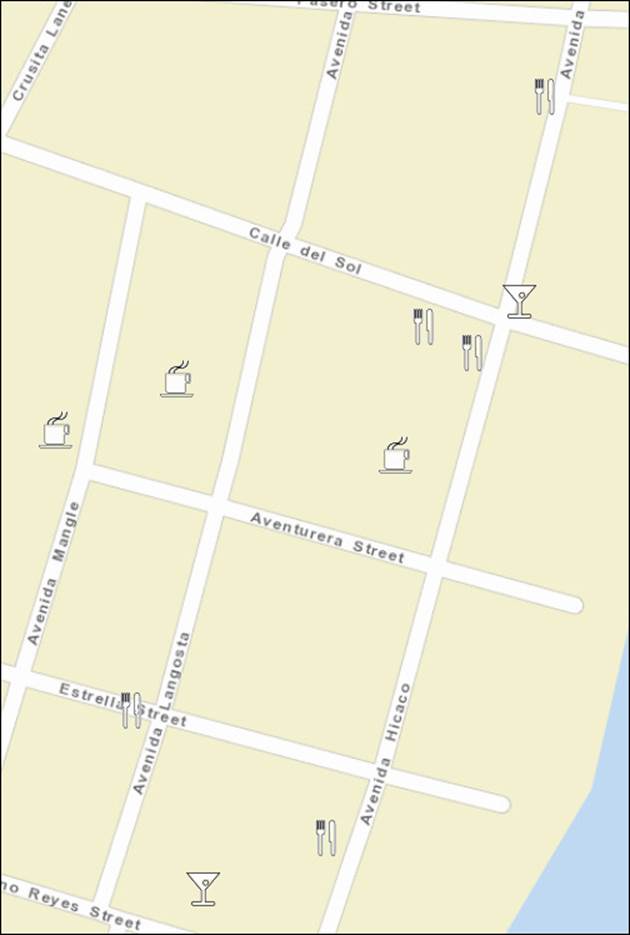
Use the Symbology tab to categorize by the SubCategory field and give each a related symbology icon. Make sure you use simple and straightforward symbologies for your layers; complex and 3D symbologies are not supported in Server yet. So, you should end up with something like the following:
You should now remove the Esri world map because it cannot be published with your data. Now, publish this service and name it Food_and_Drinks. Remember, users should be able to query this service so they can search for their favorite dining place. So, we need to enable the query capability. From the Service Editor form, activate the Mapping tab and make sure the Query option is checked. Using the same technique used in option 1, you can implement the multiservice option. Similarly, in option 2, you just have to create three map documents.
Tip
TO-DO
Deploy option 2 using the same technique you learned in the previous chapters by authoring three services for each Restaurants, Bars, and Cafes. Then, draw the symbology for each service based on the Rating field instead.
Summary
Planning is of the essence, thinking ahead to what you want to accomplish with the GIS services can put you on the right track and save you time and resources. In this chapter, you learned how to analyze requirements and plan your GIS services. You then designed the nominated GIS services with UML tools. You also used an ER diagram to design the geodatabase that feeds the services. You eventually implemented your GIS services using the techniques you learned in the previous chapters. The skills you have acquired in this chapter will help you effectively plan a new ArcGIS for Server implementation. In the next chapter, you will learn new approaches for optimizing your ArcGIS to help the server run more efficiently.
All materials on the site are licensed Creative Commons Attribution-Sharealike 3.0 Unported CC BY-SA 3.0 & GNU Free Documentation License (GFDL)
If you are the copyright holder of any material contained on our site and intend to remove it, please contact our site administrator for approval.
© 2016-2026 All site design rights belong to S.Y.A.