Emerging Trends in Image Processing, Computer Vision, and Pattern Recognition, 1st Edition (2015)
Part II. Computer Vision and Recognition Systems
Chapter 23. Automatic estimation of a resected liver region using a tumor domination ratio
M. Hariyama1; M. Shimoda2 1 Graduate School of Information Sciences, Tohoku University, Sendai, Miyagi, Japan
2 Second Department of Surgery, Dokkyo Medical University, Tochigi, Japan
Abstract
This chapter presents an automatic approach to estimate optimal resected liver regions for oncologic surgery planning. Usually, resected liver regions are determined by selecting cut-points on the portal vessels on 3D simulation software. Since the liver has complex vessel structure, it is difficult for human to find optimal resected liver regions. To solve this problem, a tumor domination ratio (TDR) is proposed to find all portal vessels related to tumors. The TDR allows us to compute the ideal resected region, that is, all the perfusion territories related to the tumor. Moreover, some types of conditions such as the radius of vessels are considered for practical surgical use. The experimental results demonstrate that the resected liver regions of the proposed approach are much smaller than those of the conventional approach in most cases.
Keywords
Medical imaging
3D simulation analysis
Anatomical hepatectomy
1 Introduction
3D simulation, recently, plays an important role in surgical planning for hepatectomy since the liver has a complex structure, that is, some different vessels exist complexly as shown in Figure 1. The estimation of regions perfused by the portal vein is especially one important task in anatomical hepatectomy, since the hepatocellular carcinoma (HCC), cancerous liver tumor, tends to metastasize via the portal vein [1–3]. Figure 2 explains how HCC metastasizes through the portal vein and what a perfused region is. The tumor is fed by the nearest parts of the portal vein, and HCC metastasizes in the downstream direction through the portal vein. Therefore, the cancer-related regions can be estimated based on the perfused region.
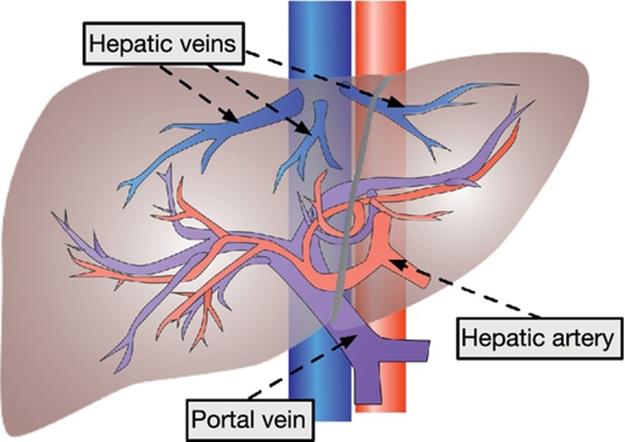
FIGURE 1 Vascular system of the liver.
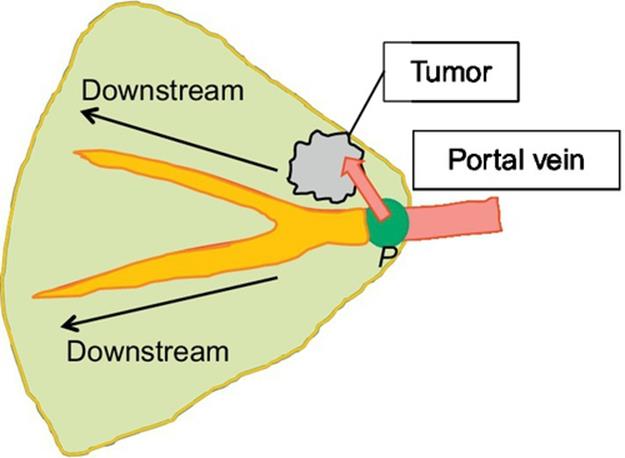
FIGURE 2 HCC (cancer) metastasizing model.
Overestimating the perfused region tends to prevent metastasizing and reduce recurrence of HCC since a large region including the tumor is resected. However, it increases the possibility of the postoperative liver failure. Therefore, the volume of the perfused region should be minimized while including all the perfused regions of the portal vein feeding the tumor.
Some practical software programs for 3D simulation and preoperative planning have been developed like Hepavision (MeVis Medical Solutions AG, Bremen, Germany) [4], OVA (Hitachi, Tokyo, Japan) [5], and Synapse VINCENT (Fujifilm Medical, Tokyo, Japan) [6]. In preoperative planning, surgeons search for the combination of the cut-points on the portal vein in a trial-and-error way until the tumor is covered by the perfused regions of the portal-vein cut-points. However, it is difficult and time-consuming for surgeons to find optimal or near-optimal combination since the portals vein has complex structure, that is, it has many branches. As a result, surgeons tend to select simple combinations, and this leads to overestimation of the perfused region.
To solve this problem, the method to compute the optimal perfused regions has been developed, where the volume is minimized while including all the perfused region of the tumor-related portal vein [7]. In order to find the tumor-related part of the portal vein accurately, the tumor domination ratio (TDR) is defined which reflects how much volume of the tumor a portal-vein point feeds. The TDR allows to pick up all the tumor-related points of the portal vein, and the total of the regions perfused by them is determined to be the resected region. This chapter extends the work [7] by adding explanations, evaluations, and a method considering a more practical condition.
The rest of this chapter is organized as follows. In Section 2, the basic method to find the ideal resected region is explained where practical conditions used in the real surgeries are not considered. In Section 3, its extension is explained where practical conditions such as the branch points and the radiuses of the vessels are considered. Section 4 describes more practical estimation considering hepatic veins as well as portal veins. Section 5 is conclusion.
2 Estimating an ideal resected region using the TDR
Perfused regions are typically estimated by using a Voronoi diagram [3]. Figure 3 shows how to compute perfused regions using Voronoi diagram. A Voronoi diagram is a way of dividing space into a number of regions as shown in Figure 3(a). A set of points (called seeds) is specified beforehand and for each seed there will be a corresponding region consisting of all points closer to that seed than to any other. The corresponding regions are called Voronoi cells. In estimating perfused regions, a seed and Voronoi cell in a Voronoi diagram correspond to a point on a portal vein and a region perfumed by the portal point, respectively, as shown in Figure 3(b). Note that, in Figure 3(b), portal-vein points (seeds) exist continuously, whereas seeds in the original Voronoi diagram are located apart from each other. As a result, the liver region is divided into small regions of the same number as the portal-vein points.
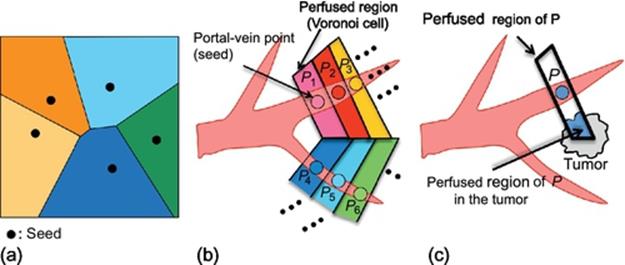
FIGURE 3 Computing perfused regions using Voronoi diagram.
The TDR of a portal-vein point P is defined as
![]() (1)
(1)
where the denominator and enumerator are illustrated in Figure 3(c). The TDR reflects how much the portal-vein point feed the tumor and is also affected by the tumor.
Given a tumor location, let us compute an ideal resected region by using the TDR, where the ideal resected region means a minimum region including all subregions perfused by tumor-related portal points. The ideal resected region is estimated by following steps (Figure 4).
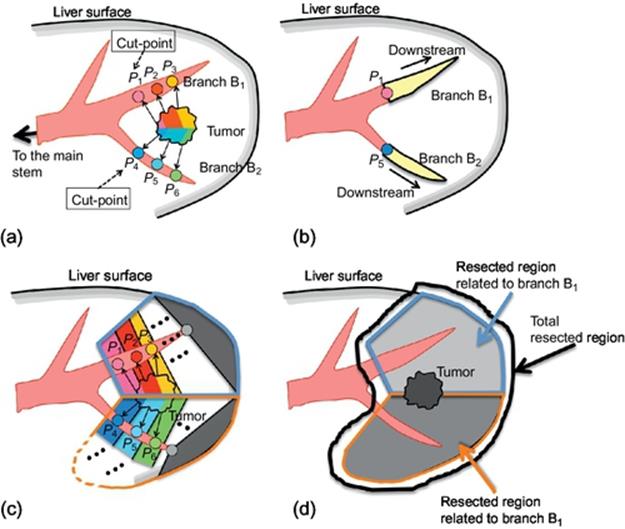
FIGURE 4 Computing ideal resected region.
Step 1: Among the portal-vein points with TDR larger than 0 on a branch, select the point closest to the main stem as a cut-point of the branch. For example, in Figure 4(a), Pi (i = 1, 2,![]() , 6) are the portal-vein points with TDR larger than 0; P1 and P4 are selected as cut-points on branches B1 and B2, respectively.
, 6) are the portal-vein points with TDR larger than 0; P1 and P4 are selected as cut-points on branches B1 and B2, respectively.
Step 2: For each branch, the downstream part of the cut-point is computed by region growing (Figure 4(b)). For all the portal-vein points of these downstream parts, the perfused regions are computed as shown in Figure 4(c).
Step 3: The ideal resected region is given by a union of all the perfused regions of all the points on downstream parts as shown in Figure 4(d).
Let us compare the proposed method with the manual approach on the conventional 3D simulation software program (Synapse VINCENT ver.2). Figure 5 shows the sample date used for evaluation. The samples 1 and 2 are the cases where the small tumor exists near the liver surface; the sample 3 is the case where the large tumor exists near the main stem of the portal vein. The liver, vessels, and a tumor are extracted in advance by the other software programs. Tables 1–3 summarize the results for samples 1–3, respectively. From Tables 1 and 2, the proposed optimization method is very useful compared to the manual approach, that is, the volume of the estimated resected region by the proposed method is much smaller than that of the manual approach. This is because the degree of freedom of cut-point selection is high and the effect of optimization is large for the case where the small tumor exists near the liver surface. On the other hand, from Table 3, the optimization is not very effective when the tumor exists near the main stem of the portal vein since the degree of freedom of cut-point selection is low.
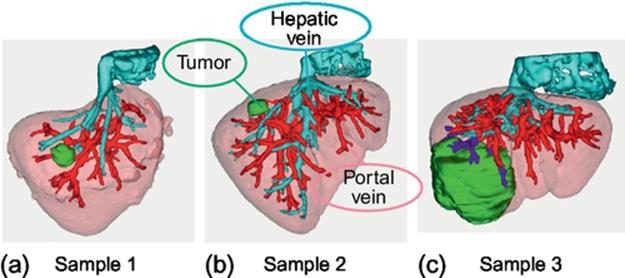
FIGURE 5 Samples for evaluation.
Table 1
Comparison Results for Sample 1
|
Sample 1 |
Manual Approach by a Surgeon |
Proposed |
|
Resected volume (cc) |
192 |
66 |
|
The number of cut-points |
1 |
2 |
|
Results |
Resected region |
Resected region |
Table 2
Comparison Results for Sample 2
|
Sample 2 |
Manual Approach by a Surgeon |
Proposed |
|
Resected volume(cc) |
325 |
42 |
|
The number of cut-points |
2 |
4 |
|
Results |
Resected region |
Resected region |
Table 3
Comparison Results for Sample 3
|
Sample 3 |
Manual Approach by a Surgeon |
Proposed |
|
Resected volume (cc) |
550 |
476 |
|
The number of cut-points |
5 |
10 |
|
Results |
Resected region |
Resected region |
Let us evaluate the computation time. The computing platform that we use is a PC with a Core-i7 CPU and a 24 GB memory. The operating system and programming language are Windows 7 and Java 1.6, respectively. The program simply designed for single-thread execution. The main reason why we use Java as a programming language is that the Java-based image-processing platform called ImageJ [8] is easy to use for medical image processing. ImageJ has a lot of plugins like a DICOM reader, basic 2D/3D image processing and visualization, and can be extended easily by adding user-defined plugins. Moreover, ImageJ runs on multiplatforms like Microsoft Windows, Linux, and MacOS since it is based on Java.
Table 4 shows the computation times for samples 1, 2, and 3 and their details. Note that vessel extraction, liver extraction, and tumor extraction are done in advance as explained above, and that their computation times are not included. The time for “computing perfused regions” is the one for Step 1 and Step 2; the time for “computing resected regions” is the one for Step 3. The computation times vary depending on the volumes of the perfused regions and the cut region. The larger the volumes are, the longer the computation time is. The computation time for any sample is < 3 min. This computation time is acceptable in real preoperative planning since the conventional preoperative planning by surgeons takes about 30–60 min for estimating a resected region. The computation time can be much speeded up by multithreading since estimating the perfused regions and cut regions has the high degree of pixel-level parallelism.
Table 4
Computation Time for Estimating an Ideal Resected Region
3 Estimating an Optimal Resected Region Under the Practical Conditions in Surgery
Although the method described in the previous section greatly reduces the volume of the estimated resected region, it is difficult for surgeons to use the results directly in the real surgery since the number of cut-points may be much larger than that of the manual approach, and since cut-points may be sometimes set on such tiny vessels that surgeons cannot identify in the real surgery. In order to solve this problem, the method described in the previous section is extended considering the practical conditions: branch points and the radius of the vessels. The optimization procedure starts with obtaining the ideal cut-points by the method described in the previous section (Figure 6(a)). These ideal cut-points are refined considering the practical conditions as shown in Figure 6(b). Each cut-point is moved toward the upstream direction in such a way that the cut-point is set on a branch point and the radius of the vessel is larger than the predetermined value.
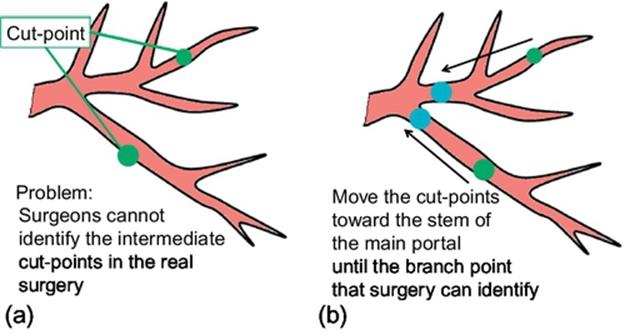
FIGURE 6 Refining the cut-points considering the practical conditions.
Tables 5 and 6 summarize the results of the optimization considering the practical conditions for samples 1 and 2, respectively. The radius of the vessel is set to 6 or 8 mm. These results show that the estimated resected region is minimized keeping the number of cut-points small appropriately for real surgery.
Table 5
Results of the Optimization Considering the Practical Conditions for Sample 1
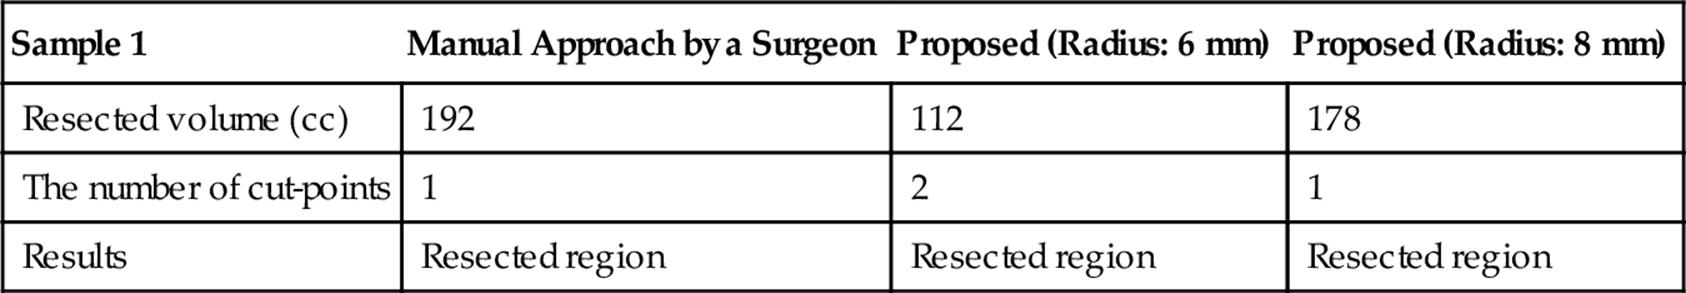
Table 6
Results of the Optimization Considering the Practical Conditions for Sample 2
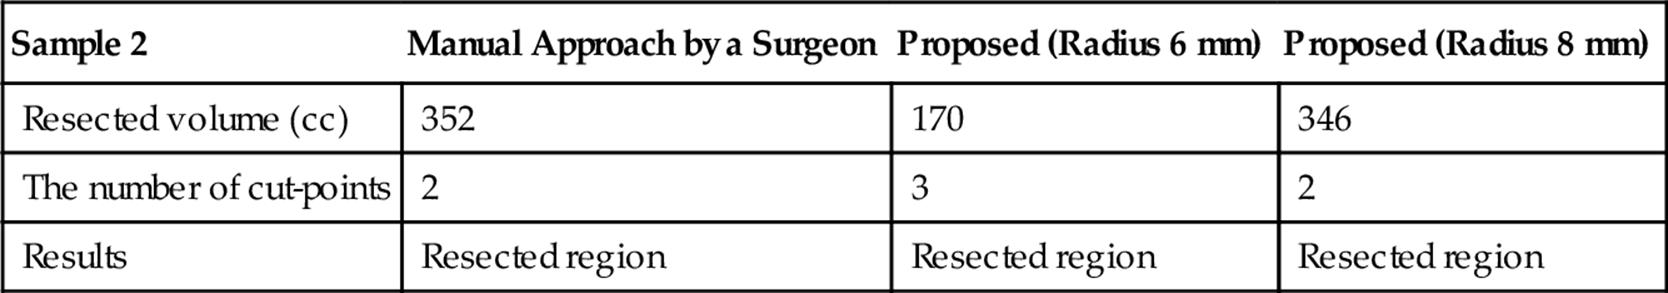
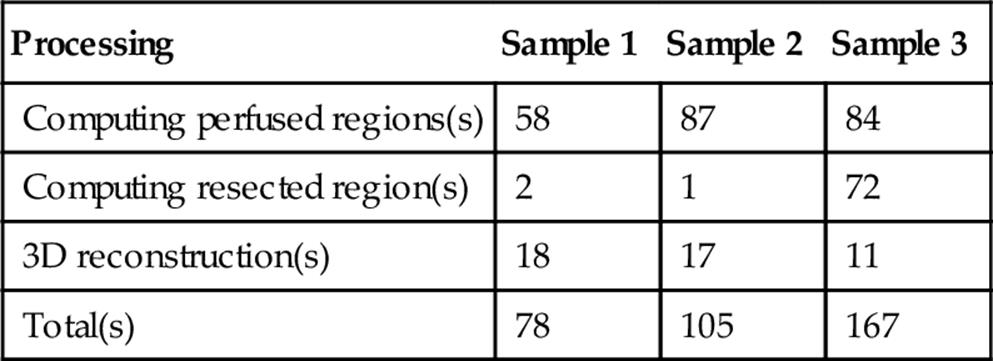
Table 7 shows the computation times for samples 1 and 2 and their details. Note that the optimization considering a vessel radius and a branch point is included in “computing resected region.” Although this optimization requires additional computation time, the computation time is still acceptable since it is much smaller than the time for planning by surgeons.
Table 7
Computation Time for Estimating the Resected Regions Considering a Vessel Radius and Branch-Point
|
Processing |
Sample 1 |
Sample2 |
|
Computing perfused regions(s) |
58 |
87 |
|
Computing resected region(s) |
30 |
82 |
|
3D reconstruction(s) |
18 |
16 |
|
Total(s) |
106 |
185 |
4 Modifying a Resected Region Considering Hepatic Veins
For preoperative planning, not only portal veins but also hepatic veins should be considered due to a blood congestion problem by cutting hepatic veins. Figure 7 explains the blood congestion problem. There are three large hepatic veins in the liver: right, middle, and left hepatic veins, and their major function is to carry blood from the tissue back to the heart. Similar to the tumor metastasizing model described in Section 1, each hepatic vein is thought to absorb blood from its closest tissue as shown in Figure 7. If a hepatic vein is cut at a point as shown in Figure 7(b), blood congestion occurs in the region related to the end part from the cut-point since the end part cannot absorb the blood; this blood-congestion region is damaged, and its liver function reduces significantly. Hence, the congestion region is thought to be equivalently a loss of the liver as well as a resected region. Therefore, if the total volume of the congestion region and the resected region is large for the liver function of the patient, it would cause liver failure. If the hepatic veins overlap with a portal-vein-based resected region, the resected region is limited so as not to overlap with any major hepatic vein.
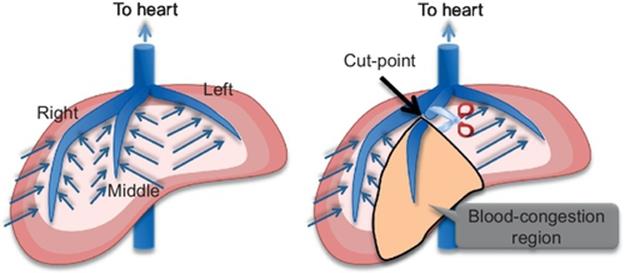
FIGURE 7 Blood congestion problem.
In conventional software, surgeons must draw complex cutting surfaces manually considering hepatic veins, and it is very time-consuming since 3D surface is difficult to draw and not accurate.
To solve this problem, we extend the portal-vein-based estimation so as to consider hepatic veins easily as shown in Figure 8. At first, the resected region is obtained from portal-based estimation (Figure 8(a)). The yellow region denotes the portal-based cut region. Next, it is checked whether the resected region overlap with hepatic veins or not. If overlapping (Figure 8(b)), the original resected region is limited so as not to overlap with the hepatic vein (Figure 8(c)). This modified resected region is denoted by the blue region.
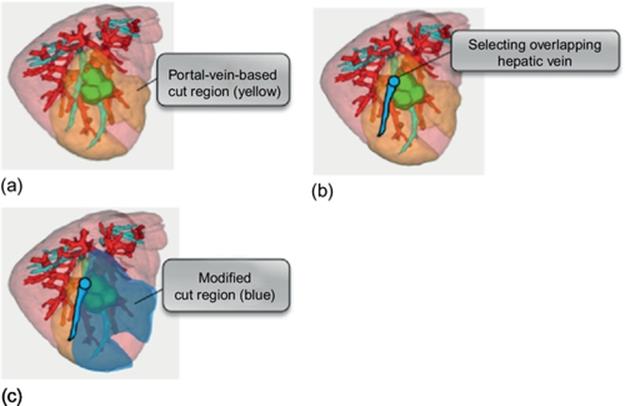
FIGURE 8 Modifying the portal-vein-based resected region considering hepatic veins.
5 Conclusion
In order to minimize the resected volume while preventing metastases, the automatic method that finds the optimal combination of cut-points is proposed. The domination ratio is a key to success to find such optimal combination in a systematic way. Recently, the integration of 3D simulation and ultrasonography is progressing to support the surgical operations in the real surgery. Such navigation technology makes it easier that surgeons resect the liver according to the optimal resected regions computed from our method.
References
[1] Makuuchi M, Hasegawa H, Yamazaki S. Ultrasonically guided subsegmentectomy. Surg Gynecol Obstet. 1985;161:346–350.
[2] Kishi Y, Hasegawa K, Kaneko J, Aoki T, Beck Y, Sugawara Y, et al. Resection of segment VIII for hepatocellular carcinoma. Br J Sur. 2012;99(8):1105–1112.
[3] Takamoto T, Hashimoto T, Ogata S, Inoue K, Maruyama Y, Miyazaki A, et al. Planning of anatomical liver segmentectomy and subsegmentectomy with 3-dimensional simulation software. Am J Surg. 2003;206(4):530–538.
[4] Selle D, Preim B, Schenk A, Peitgen HO, et al. Analysis of vasculature for liver surgical planning. IEEE Trans Med Imaging. 2002;21:1344–1357.
[5] Saito S, Yamanaka J, Miura K, Nakao N, Nagao T, Sugimoto T, et al. A novel 3D hepatectomy simulation based on liver circulation: application to liver resection and transplantation. Hepatology. 2005;41:1297–1304.
[6] Ohshima S. Volume analyzer SYNAPSE VINCENT for liver analysis. J Hepatobiliary-Pancreat Sci. 2014;21(4):235–238.
[7] Hariyama M, Okada M, Shimoda M, Kubota K. Estimation of resected liver regions using a tumor domination ratio. In: Proc. international conference on image processing, computer vision, and pattern recognition (IPCV); 2014:52–56.
[8] Rasband WS. ImageJ, U. S. National Institutes of Health, Bethesda, Maryland, USA, http://imagej.nih.gov/ij/, (1997–2014).
All materials on the site are licensed Creative Commons Attribution-Sharealike 3.0 Unported CC BY-SA 3.0 & GNU Free Documentation License (GFDL)
If you are the copyright holder of any material contained on our site and intend to remove it, please contact our site administrator for approval.
© 2016-2026 All site design rights belong to S.Y.A.