Emerging Trends in Image Processing, Computer Vision, and Pattern Recognition, 1st Edition (2015)
Part I. Image and Signal Processing
Chapter 4. Fringe noise removal of retinal fundus images using trimming regions
Arezoo Ektesabi; Ajay Kapoor Swinburne University of Technology, Melbourne, Victoria, Australia
Abstract
Recent advancements in ophthalmology have been significantly influenced by enhancements in image-processing procedures. Automatic detection of main regions of the eye has been of interest for years, resulting in multiple studies, methodologies for accurate and fast detection of retinal features. Despite the improvements in procedures, majority of the reported techniques cannot perform as accurately in response to the change of the image resolution and size. Therefore, the automated process needs to have the capability of recognizing the input image and irrespective of its resolution detect the required feature with high accuracy. To achieve this, it is essential to remove all possible noises such as the effect of the illuminated light at the edges of the retinal images which in particular affect the results to be inadequate for localization of the optic disk. This study proposes the use of circular and elliptical trimming regions for the removal of these bright noises. Significant improvements have been reported in the outcomes for optic disk localization.
Keywords
Fundus image
Image processing
Noise removal
Ophthalmology
Trimming region
1 Introduction
For centuries with the rapidly growing population, the need for improvements in medical and health care systems has been felt. As one of the main sensory organs, eye has always played an important role in any individuals’ life. Therefore, ophthalmological research has been of interest and closely monitored areas, especially since the 1999, with the introduction of the vision 2020 campaign [1]. The campaign has aimed to improve the prognosis, diagnosis, treatment, and posttreatment procedures.
The ophthalmological practices have always been greatly influenced as the result of the improvements in health system and biomedical approaches, leading to better understanding of the underlying causes of different diseases. The design and use of the image-capturing and -processing algorithms have also aided in early disease detection and progression, assisting the treatment and monitoring the posttreatment results. Overall in the past two decades, the procedures have become faster, more reliable, repeatable, and accurate.
The statistics provided by World Health Organization (WHO) in 2010 suggests that there are about 285 million people in the world who are currently visually impaired, consisting of 39 million who are blind and 246 million people who have low vision, including both moderate and severe visual impairment cases. It has also been indicated that the leading causes of blindness have been diseases such as cataract, glaucoma, and age-related macular degeneration [1–4].
The above findings suggest that there is still need for further improvement. The study also indicates that the majority of the observed complications occur in developing regions of the world, while 80% of these visual impairments could have been avoided if detected early [1,5]. Despite recent advancements in technology and improvements in biomedical research and ophthalmological findings, there is still the need for fast, affordable, and reliable diagnosis and treatment procedures in developing regions.
Current interest in telemedicine and the need for developing new techniques and methodologies for retinal image processing as well as a better, highly accurate, reliable, accessible, repeatable, and inexpensive system for disease diagnosis has been the key motivation of this study.
1.1 Image Processing
For decades image processing has been used in industrial application. However, in the past few years there has been a sudden trend and increase in use due to recognition of image-processing capabilities biomedical applications.
Usually, image processing consists of a few main steps including, detection of the object with a camera and then processing the obtained images using segmentation, normalization, feature extraction, and matching. The outcome of this can then be interpreted or displayed [6,7].
For this study, the above steps have been slightly modified and the associated flow chart is illustrated in Figure 1.

FIGURE 1 Flow chart of the image-processing steps.
The initial step in any image-processing procedure is image acquisition. This is a very crucial step as the obtained images directly affect the precision and accuracy of the final outcome. A few points are usually considered while collecting images; some of which are the general understanding problem, the required image and possible storage capability and capacity, capturing time, resolution, lighting, camera, available resources, and available options.
The next stage would be the image preprocessing step, where the usual colored image is manipulated and prepared for the next stages. Since in majority of cases, the overall reduction in processing time is of great interest, this stage mainly concentrates on manipulation of images so that the overall complexity of the process is reduced. However, the implemented processes have to ensure that the essential information needed for the following stages are not destroyed or affected as the result. To achieve this, the RGB images are usually decomposed to the primary colors and gray scaled. With the reduction in amount of data processed, the overall processing time is also reduced. Similarly, other processes may also be implemented at this stage including the implementation of different filters and adjustment of image contrast.
Once the images have been prepared, the feature localization step would be conducted in order to localize the key features of interest. Accurate detection of the optic disk has been the key feature of interest in this study. The noiseless solution for early prognosis of diseases such as Glaucoma is presented further in this chapter.
This is then followed by feature extraction stage, where the information is extracted from the regions of interest. At this stage, the overall objective of the study is fulfilled.
Lastly, the detailed information obtained in the feature extraction step is studied in depth and interpreted accordingly. The overall outcome and the key findings can also be displayed.
1.2 Retinal Image Processing
In this study, image-processing implementation on retinal images is considered. Majority of the studies performed previously only consider or concentrate on the localizing, extracting stages, and detecting features such as retinal blood vessels [8–12] or optic disk [13–17]. The studies tend to ignore the preliminary stages of image processing, which could affect the overall accuracy and precision of the process.
Moreover, in automated systems, the input data may vary depending on the capturing instrumentation, their effect, response of the individual patients, image resolution, size and contrast which in turn could alter the final results if the setting is chosen properly for localizing and extracting stage.
In order to enhance the processing results and have a complete automated process, it is essential to prepare the input images to the best possible format in the preprocessing stage. There might also be times where a secondary image preprocessing stage is needed. This stage could be implemented if the preliminary results do not produce the desired outcome.
These points highlight the fact that preprocessing stage is the basis and a crucial step in image processing. As a result, for achieving the best possible outcomes a thorough and exact procedure should be suggested and conducted at this stage.
1.2.1 Ophthalmological Data
In order to start the image processing in ophthalmology, retinal images are needed. These images are captured using specialized instruments. However, for the purpose of this research the open-source databases have been used. There are several different open-source databases available online, including the digital retinal images for vessel extraction (DRIVE) [18], structured analysis of the retina (STARE) [19,20], retinal vessel image set for estimation of width [21], retinopathy online challenge [22], collection of multispectral images of the fundus [23], and MESSIDOR database [24].
For the purpose of this study, the DRIVE and STARE database has been chosen for further analysis. The collection of DRIVE database was initiated by Staal et al. It contains 20 colored retinal images, captured by Canon CR5 nonmydriatic 3CCD camera with a 45° field of view. The images are digitized to 768 × 584 pixels, 8 bits per color channel [18]. STARE database consists of about 400 retinal images and was initiated in 1975 by Michael Goldbaum. The images are 8 bits per color plane at 605 × 700 pixels and were captured by TopCon TRV-50 fundus camera with 35° field of view [19,20].
2 Methodology
An important yet overlooked stage in majority of the literature on image processing is the image preprocessing step. Depending on the requirements of the study, and the main objectives of the project, certain necessary steps and procedures should be performed in the image preprocessing step so that the image is well prepared to fit the objective of further stages.
One of the procedures that should be implemented at this stage is the noise minimization. A common problem in such cases is the noise which appears as illuminated bright spots on the edges of the retinal images [25]. The bright fringes may have been formed due to the refraction of the light within the eye, ambient light which might have affected the image if eye is not placed properly in front of the device and also the eye response itself. An example of such retinal responses can be viewed in Figure 2.
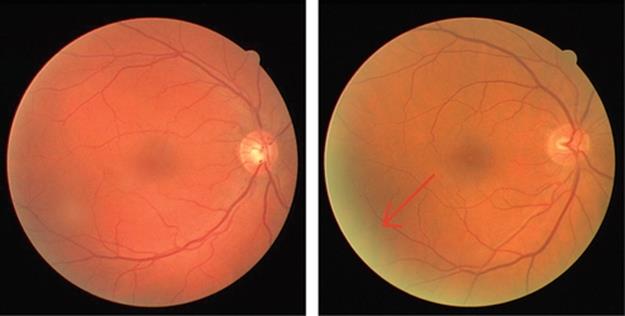
FIGURE 2 Comparison of two retinal images, no fringe noise is present in left-hand image while in the right-hand image the bright spot is completely visible.
The removal of fringe noise plays an important role in the accuracy of detection in particular when the optic disk is the area of interest. This is due to the fact that the bright illuminated fringe may inaccurately be located instead of the optic disk which is commonly known to be as the brightest region in the retinal image.
There have been several approaches in order to enhance the detection precision in such instances. Majority of the previous literature suggest the use of filters or adjust the contrast of the image. Although the outcomes have been promising, many of the other crucial information may have also been lost as the result.
In this study, the trimming regions have been used as the common approach. The trimming region may be used to remove the unwanted noise and enhance the overall accuracy of detection. In order to remove all the noise, it should be noted that the radius of the proposed region should be smaller than those of the actual region of interest so that all the fringe noises are removed.
This approach was initially suggested by Zhang et al. [25]. They introduced a trimming boundary represented by the following equations:
![]() (1)
(1)
![]()
![]()
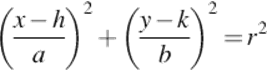
However, the accuracy of detection of the proposed method was not 100% and there has been a need for manual observation and modification. In order to improve the success rate and create a complete automated process, the use of circular trimming circle centred (a,b) [26] has previously been suggested and implemented by the authors. The proposal is represented by the following equation:
![]() (2)
(2)
Equating Equation (2) with Equation (1), we can conclude that:
![]()
![]()

The above procedure improved the precision of detection greatly and if the chosen radius was accurately selected, the crucial information would have still been intact. Despite the great success rate of this method, it can only be implemented on retinal images where the region of interest is approximately circular. Observing multiple retinal fundus images suggest that different instrumentations and settings may also result in an oval-shaped retinal images. Examples of which are shown in Figure 3.
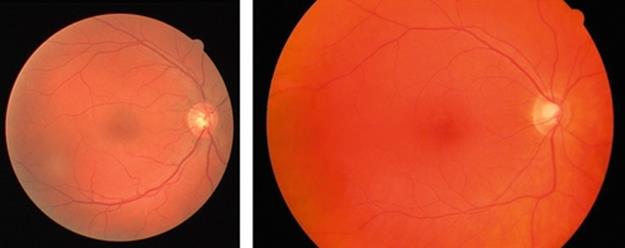
FIGURE 3 Circular- [18] and oval-shaped retinal fundus images [19,20].
In these cases implementing the circular trimming region may result in an inaccurate detection of the feature of interest as well as great loss of crucial information, as illustrated in Figure 4.
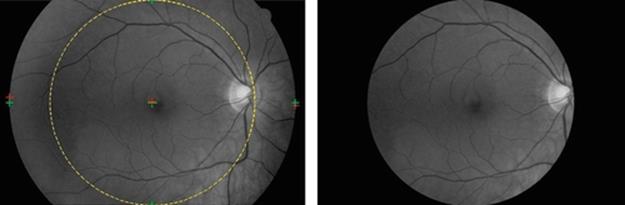
FIGURE 4 Implementation of circular trimming region to the oval-shaped retinal image.
To overcome this problem and preserve as much information as possible, authors propose another trimming region. The suggested elliptical trimming region is characterized by the following equations:
 (3)
(3)
![]()
![]()
![]()
![]()
Based on the retinal images and their characteristics, either the circular or elliptical trimming region may be used and implemented.
2.1 Implementation
The implementation of the proposed methodology is similar to what has been previously suggested by the authors [26] with minor modifications. The needed information for both the circular and elliptical trimming region is the estimated location for the center and the radius in both horizontal and vertical directions.
Initial step would be creating a mask to define the region of interest [27]. Once the region of interest is defined, the radius can then be estimated. To estimate the radius, it is important to locate the first and last nonzero pixel (white pixel) across the columns of the image. The middle value between these two estimated points can then be used as a preliminary location for the center.
This is then followed by finding the first and last nonzero pixel across the rows using the estimated center location. Recalculating the middle value of these newly found points can lead to readjustment of the center location as well as the location of the first and last nonzero pixels across the columns of the image.
In order to find the radius, the distance between the radius and the corner pixel values is calculated. For the circular trimming region, both the vertical and horizontal calculated radius would approximately be the same and so either can be used to define the trimming region. However, in the case of an elliptical trimming region, the radius in horizontal (short axis) and vertical axis (long axis) is different and so both have to be calculated and taken under consideration for defining the elliptical region of interest.
The outcome of the above procedure for both elliptical and circular trimming region can be viewed in Figure 5.
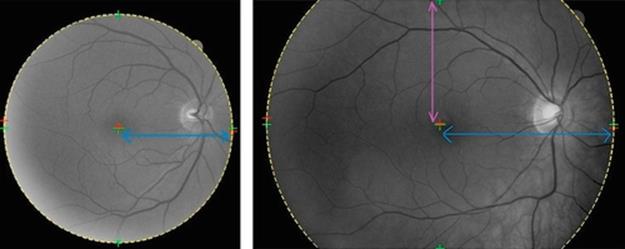
FIGURE 5 Suggested trimming regions: circular trimming region (left) and elliptical trimming region. The centers are marked as “+” and the estimated trimming region is drawn by discontinued lines. The radii are also shown as arrows.
It should also be noted that for all the fringe noises to be removed, the implemented radius has to be smaller than the estimated radius. The variation in size maybe selected based on an observation for a single image in the database; this value may then be used for the remaining images.
From Figure 6, it can be seen that in case of circular trimming region, the chosen radius has to be slightly smaller than those of the actual estimated radius. However, in case of the elliptical trimming region, the modified radius, shown in dotted line, can simply be chosen using the estimated radius short and long axes.
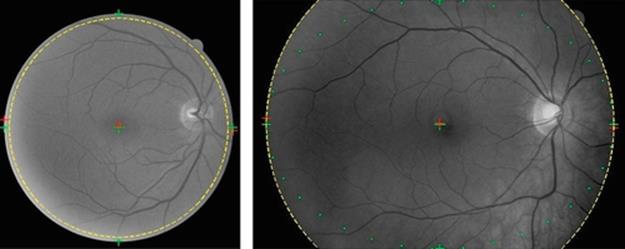
FIGURE 6 Modified radius, circular trimming region (left), and elliptical trimming region (right).
3 Results and Discussion
Implementing the above procedures and observing the obtained results suggest that depending on the input image, the chosen methodology may vary. If the region of interest in the retinal image is circular in shape, the circular trimming region may be used. However, if it is more oval shaped, the elliptical trimming region may be used instead.
Automatic detection of the center and radius ensures that the best trimming region is chosen, with a simple comparison between the measured radius in horizontal and vertical direction.
The proposed methodology has been implemented on the images from the databases [17–19] and results obtained are shown in Figure 7.
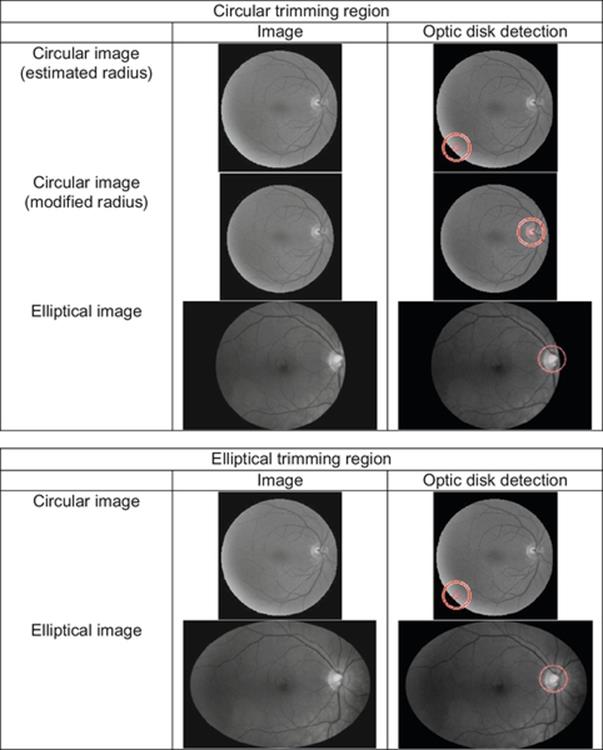
FIGURE 7 Optic disk detection under different circumstances for circular- and oval-shaped images, using the proposed circular and elliptical trimming region.
From the sample outcomes depicted in Figure 7, it can be suggested that for the oval-shaped image the elliptical trimming region would provide better results in comparison to the original data and the circular trimming region. Although the circular trimming circle may also be used in this case, there seems to be loss of critical information which is highly undesirable.
On the other hand for circular image, the circular trimming region with modified radius would results in an ideal solution and feature of interest detection.
4 Conclusion
In conclusion, it can be said that the fringe noise present at the edges of retinal images as the result of instrumentation error or patient’s response can be removed successfully using the proposed methodology. The use of automatic adaptive circular or elliptical trimming region ensures that all the illuminated bright regions are removed and features of interests such as optic disk which previously would have been inaccurately localized are now detected with a very high precision using this robust localization procedure. The highly accurate detection can then be used by ophthalmologists in characterizing and early prognosis of diseases. For example in this case, extracting the variations in size of the optic disk would help in diagnosing diseases such as Glaucoma.
References
[1] World Health Organisation. Global data on visual impairments 2010. viewed March 2014, http://www.who.int/blindness/GLOBALDATAFINALforweb.pdf?ua=1> 2010.
[2] Khanna R, Pujari S, Sangwan V. Cataract surgery in developing countries. Curr Opin Ophthalmol. 2011;22:10–14.
[3] Lamoureux EL, et al. The impact of cataract surgery on quality of life. Curr Opin Ophthalmol. 2011;22:19–27.
[4] Tan CSH. Cost effectiveness of phacoemulsification in developing countries. Eye. 2010;24:1827–1828.
[5] World Health Organisation. Global pattern of blindness changes with success in tackling infectious disease and as population ages, viewed June 2011, http://www.who.int/mediacentre/news/notes/2004/np27/en/; 2004.
[6] Mehrabian H, Hashemi-Tari P. Pupil boundary detection for iris recognition using graph cuts. In: Proceedings of image and vision computing, New Zealand, 2007, Hamilton, New Zealand; 2007:77–82.
[7] Ektesabi A, Kapoor A. Complication prevention of posterior capsular rupture using image processing techniques. Proceedings of the world congress on engineering 2012 (WCE 2012), July 4-6, London, U.K. 2012;vol. I.
[8] Jamal I, Akram M, Tariq A. Retinal image preprocessing: background and noise segmentation. Telkomnika. 2012;10(3):537–544.
[9] Xu X, Abramoff MD, Bertelsen G, Reinhardt JM. Retinal vessel width measurement at branching points using an improved electric field theory-based graph approach. Med Imag. 2012. ;7(11). http://www.ncbi.nlm.nih.gov/pmc/articles/PMC3507841/.
[10] Fraz MM, Barman SA, Remagnino P, Hoppe A, Basit A, Uyyanonvara B, Rudnicka AR, Owen CG. An approach to localize the retinal blood vessels using bit planes and centerline detection. Comput Methods Prog Biomed. 2012. ;108(2):600–616.http://www.cmpbjournal.com/article/S0169-2607(11)00227-6/pdf.
[11] Yamamoto Y, Yamamoto Y, Marugame A, Ogura M, Saito A, Ohta K, Fukumoto M, Murata T. Age-related decrease of retinal vasculature are identified with a novel computer-aided analysis system. Tohoku J Exp Med. 2012;228:229–237.
[12] Cheng SC, Huang YM. A novel approach to diagnose diabetes based on the fractal characteristics of retinal images. IEEE Trans Inf Technol Biomed. 2003;7:163–170.
[13] Youssif A, Ghalwash A, Ghoneim A. Optic disc detection from normalized digital fundus images by means of a vessels direction matched filter. IEEE Trans Med Imaging. 2008;27:1118.
[14] Rangayyan R, Zhu X, Ayres F, Ells A. Detection of the optic nerve head in fundus images of the retina with Gabor filters and phase portrait analysis. J Digit Imaging. 2010;23:438–453.
[15] Zhu X, Rangayyan R, Ells A. Detection of the optic nerve head in fundus images of the retina using the hough transform for circles. J Digit Imaging. 2010;23:332–341.
[16] Sekhar S, Al-Nuaimy W, Nandi A. Automatic localization of optic disc and fovea in retinal fundus. In: 16th European signal processing conference; 2008.
[17] Welfer D, Scharcanski J, Kitamura C, Dal Pizzol M, Ludwig L, Marinho D. Segmentation of the optic disk in color eye fundus images using an adaptive morphological approach. Comput Biol Med. 2010;40:124–137.
[18] Staal JJ, Abramoff MD, Niemeijer M, Viergever MA, van Ginneken B. Ridge based vessel segmentation in color images of the retina. IEEE Trans Med Imaging. 2004;23:501–509.
[19] Hoover A, Kouznetsova V, Goldbaum M. Locating blood vessels in retinal images by piece-wise threhsold probing of a matched filter response. IEEE Trans Med Imaging. 2000;19(3):203–210.
[20] Hoover A, Goldbaum M. Locating the optic nerve in a retinal image using the fuzzy convergence of the blood vessels. IEEE Trans Med Imaging. 2003;22(8):951–958.
[21] University of Lincoln. Review: retinal vessel image set for estimation of widths, viewed Feb 2014, http://reviewdb.lincoln.ac.uk/> 2010.
[22] The University of Iowa and the ROC organizers (Michael D. Abramoff, Bram van Ginneken and Meindert Niemeijer). Retinopathy Online Challenge, viewed Feb. 2014, http://webeye.ophth.uiowa.edu/ROC/var.1/www/; 2007.
[23] School of Computer Science, The University of Birmingham. Collection of multispectral images of the fundus, viewed Feb. 2014, http://www.cs.bham.ac.uk/research/projects/fundus-multispectral/> 2014.
[24] TECHNO-VISION Project. Methods to evaluate segmentation and indexing techniques in the field of retinal ophthalmology, viewed Feb. 2014, http://messidor.crihan.fr/index-en.php; 2014.
[25] Zhang Z, Yin FS, Liu J, Wong WK, Tan NM, Lee BH, Cheng J, Wong TY. ORIGA-light: an online retinal fundus image database for glaucoma analysis and research. In: 32nd annual international conference of the IEEE EMBS, Argentina; 2010:3065–3068.
[26] Ektesabi A, Kapoor A. Removal of circular edge noise of retinal fundus images. In: International conference on image processing, computer vision and pattern recognition (IPCV’14), Las Vegas; 2014.
[27] Ektesabi A, Kapoor A. Exact pupil and iris boundary detection. 1217–1221. International conference on control, instrumentation, and automation (ICCIA), Shiraz. 2011;vol. 2.
All materials on the site are licensed Creative Commons Attribution-Sharealike 3.0 Unported CC BY-SA 3.0 & GNU Free Documentation License (GFDL)
If you are the copyright holder of any material contained on our site and intend to remove it, please contact our site administrator for approval.
© 2016-2026 All site design rights belong to S.Y.A.