Emerging Trends in Image Processing, Computer Vision, and Pattern Recognition, 1st Edition (2015)
Part I. Image and Signal Processing
Chapter 5. pSQ
Image quantizer based on contrast band-pass filtering
Jaime Moreno1,2; Oswaldo Morales1; Ricardo Tejeida1 1 Superior School of Mechanical and Electrical Engineers, National Polytechnic Institute of Mexico, IPN Avenue, Lindavista, Mexico City, Mexico
2 Signal, Image and Communications Department, University of Poitiers, Poitiers, France
Abstract
This work describes pSQ an image quantizer, which employs contrast band-pass filtering and it is based on Moreno et al. (2014) [1]. In addition, the aim of this work is to explain how to apply perceptual criteria in order to define a perceptual forward and inverse quantizer. We present its application to the Hi-SET coder (Moreno and Otazu, 2011) [2]. Our approach consists of quantizing wavelet transform coefficients using some of the human visual system behavior properties. Taking into account that noise is fatal to image compression performance, because it can be both annoying for the observer and consumes excessive bandwidth when the imagery is transmitted. Perceptual quantization reduces unperceivable details and thus improves both visual impression and transmission properties. The comparison between JPEG2000 coder and the combination of Hi-SET with the proposed perceptual quantizer shows that Hi-SET + pSQ is not favorable in PSNR than JPEG2000, but the recovered image is more compressed (less bitrate) at the same or even better visual quality measured with well-know image quality metrics, such as MSSIM, UQI, or VIF, for instance.
Keywords
Contrast sensitivity function
Human visual system
JPEG2000
Wavelet transform
Acknowledgment
This work is supported by National Polytechnic Institute of Mexico by means of Project No. 20140096, the Academic Secretary and the Committee of Operation and Promotion of Academic Activities (COFAA), National Council of Science and Technology of Mexico by means of Project No. 204151/2013, and LABEX Σ-LIM France, Coimbra Group Scholarship Programme granted by University of Poitiers and Region of Poitou-Charentes, France.
1 Introduction
Digital image compression has been a research topic for many years and a number of image compression standards have been created for different applications [1, 2]. The JPEG2000 is intended to provide rate-distortion and subjective image quality performance superior to existing standards, as well as to supply functionality [3]. However, JPEG2000 does not provide the most relevant characteristics of the human visual system, since for removing information in order to compress the image mainly information theory criteria are applied. This information removal introduces artifacts to the image that are visible at high compression rates, because of many pixels with high perceptual significance have been discarded. Hence, an advanced model is necessary that removes information according to perceptual criteria, preserving the pixels with high perceptual relevance regardless of the numerical information. The Chromatic Induction Wavelet Model presents some perceptual concepts that can be suitable for it. Both contrast band-pass filtering (CBPF) and JPEG2000 use wavelet transform. CBPF uses it in order to generate an approximation to how every pixel is perceived from a certain distance taking into account the value of its neighboring pixels. By contrast, JPEG2000 applies a perceptual criterion for all coefficients in a certain spatial frequency independently of the values of its surrounding ones. In other words, JPEG2000 performs a global transformation of wavelet coefficients, while CBPF performs a local one. CBPF attenuates the details that the human visual system is not able to perceive, enhances those that are perceptually relevant, and produces an approximation of the image that the brain visual cortex perceives. At long distances, the lack of information does not produce the well-known compression artifacts; rather it is presented as a softened version, where the details with high perceptual value remain (e.g., some edges).
2 Related Work: JPEG 2000 Global Visual Frequency Weighting
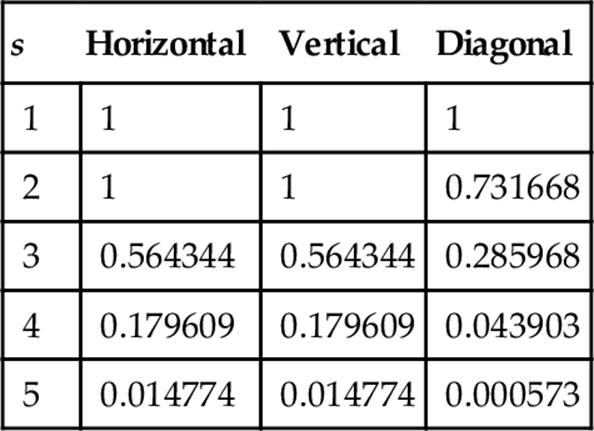
In JPEG2000, only one set of weights is chosen and applied to wavelet coefficients according to a particular viewing condition (100, 200, or 400 dpi’s) with fixed visual weighting [3, Annex J.8]. This viewing condition may be truncated depending on the stages of embedding, in other words at low bit rates, the quality of the compressed image is poor and the detailed features of the image are not available since at a relatively large distance the low frequencies are perceptually more important. Table 1 specifies a set of weights which was designed for the luminance component based on the contrast sensitivity function (CSF) value at the mid-frequency of each spatial frequency. The viewing distance is supposed to be 4000 pixels, corresponding to 10 in. for 400 dpi print or display. The weight for LL is not included in the table, because it is always 1. Levels 1, 2, …, 5 denote the spatial frequency levels in low- to high-frequency order with three spatial orientations, horizontal, vertical, and diagonal.
Table 1
Recommended JPEG 2000 Frequency (s) Weighting for 400 dpi (s = 1 is the Lowest Frequency Wavelet Plane)
3 Perceptual quantization
3.1 Contrast Band-Pass Filtering
The CBPF [4] is a low-level perceptual model of the HVS. It estimates the image perceived by an observer at a distance d just by modeling the perceptual chromatic induction processes of the HVS. That is, given an image I and an observation distance d, CBPF obtains an estimation of the perceptual image Iρ that the observer perceives when observing I at distance d. CBPF is based on just three important stimulus properties: spatial frequency, spatial orientation, and surround contrast. This three properties allow to unify the chromatic assimilation and contrast phenomena, as well as some other perceptual processes such as saliency perceptual processes.
The perceptual image Iρ is recovered by weighting these ωs,o wavelet coefficients using the extended contrast sensitivity function (e-CSF). The e-CSF is an extension of the psychophysical CSF [5] considering spatial surround information (denoted by r), visual frequency (denoted by v, which is related to spatial frequency by observation distance), and observation distance (d). Perceptual image Iρ can be obtained by
 (1)
(1)
where α(ν, r) is the e-CSF weighting function that tries to reproduce some perceptual properties of the HVS. The term α(ν, r)ωs,o is considered the perceptual wavelet coefficients of image I when observed at distance d.
3.2 Forward Inverse Quantization
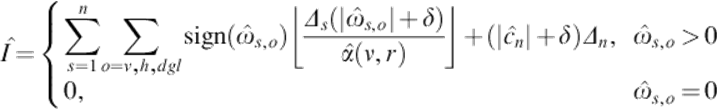
Quantization is the only cause that introduces distortion into a compression process. Since each transform sample at the perceptual image Iρ (1) is mapped independently to a corresponding step size either Δs or Δn; thus, Iρ is associated with a specific interval on the real line. Then, the perceptually quantized coefficients Q, from a known viewing distance d, are calculated as follows:
 (2)
(2)
Unlike the classical techniques of visual frequency weighting (VFW) on JPEG2000, which apply one CSF weight per sub-band [1, Annex J.8], perceptual quantization using CBPF(pSQ) applies one CSF weight per coefficient over all wavelet planes ωs,o. In this section, we only explain forward perceptual quantization using CBPF (F-pSQ). Thus, Equation (2) introduces perceptual criteria of the perceptual images (1) to each quantized coefficient of the dead-zone scalar quantizer [1, Annex J.8]. A normalized quantization step size Δ = 1/128 is used, namely, the range between the minimal and maximal values at Iρ is divided into 128 intervals. Finally, the perceptually quantized coefficients are entropy coded, before forming the output code stream or bitstream.
The perceptual quantizer F-pSQ in JPEG2000 is tested on all the color images of the Miscellaneous volume of the University of Southern California Image Data Base [6]. The data sets are eight 256 × 256 pixel images and eight 512 × 512 pixel images, but only visual results of the well-known images Lena, F-16, and Baboon are depicted, which are 24-bit color images and 512 × 512 of resolution. The CBPF model is performed for a 19 in. monitor with 1280 pixels of horizontal resolution at 50 cm of viewing distance. The software used to obtain a JPEG2000 compression for the experiment is JJ2000 [7].
Figure 1(a) shows the assessment results of the average performance of color image compression for each bit-plane using a dead-zone uniform scalar quantizer (SQ, function with heavy dots), and it also depicts the results obtained when applying F-pSQ (function with heavy stars).
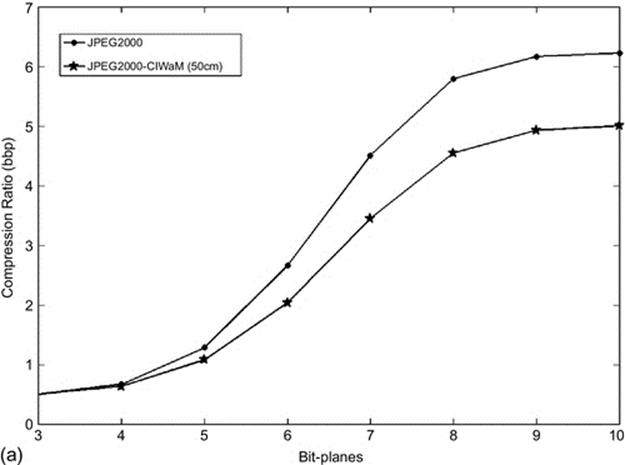
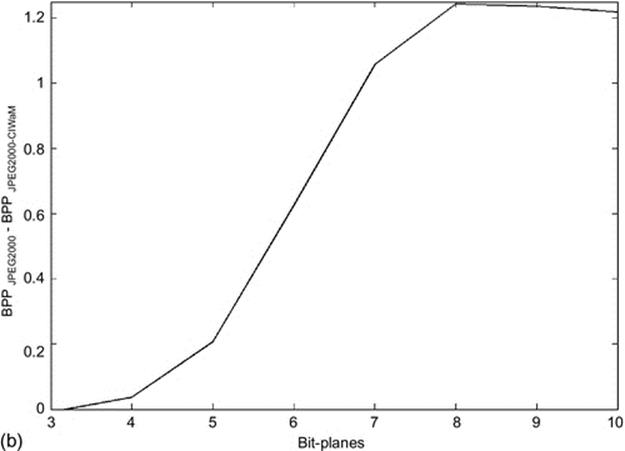
FIGURE 1 (a) JPEG2000 Compression ratio (bpp) as a function of Bit-plane. Function with heavy dots shows JPEG2000 only quantized by the dead-zone uniform scalar manner. While function with heavy stars shows JPEG2000 perceptually prequantized by F-pSQ. (b) The bit-rate decrease by each Bit-plane after applying F-pSQ on the JPEG2000 compression.
Using CBPF as a method of forward quantization, achieves better compression ratios than SQ with the same threshold, obtaining better results at the highest bit-planes, since CBPF reduces unperceivable features. Figure 1(b) shows the contribution of F-pSQ in the JPEG2000 compression ratio, for example, at the eighth bit-plane, CBPF reduces 1.2423 bits per pixel than the bit rate obtained by SQ, namely, in a 512 × 512 pixel color image, CBPF estimates that 39.75 kB of information is perceptually irrelevant at 50 cm.
Both Figures 2 and 3 depict examples of recovered images compressed at 0.9 and 0.4 bits per pixel, respectively, by means of JPEG2000 (a) without and (b) with F-pSQ. Also these figures show that the perceptual quality of images forward quantized by pSQ is better than the objective one.
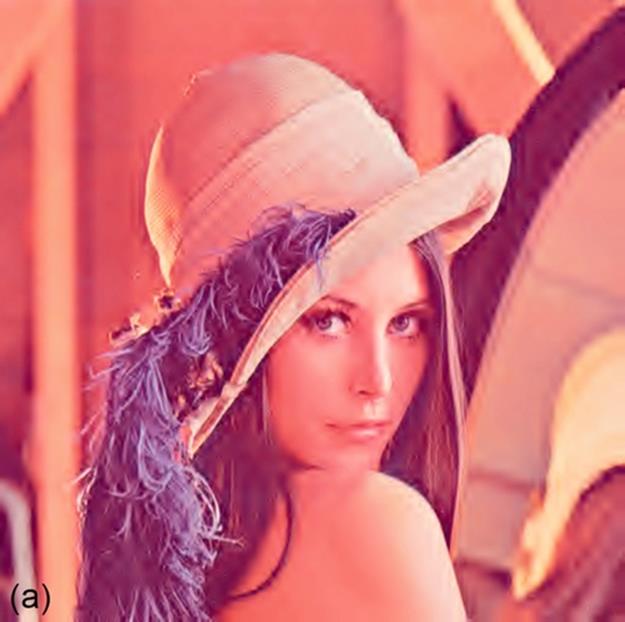


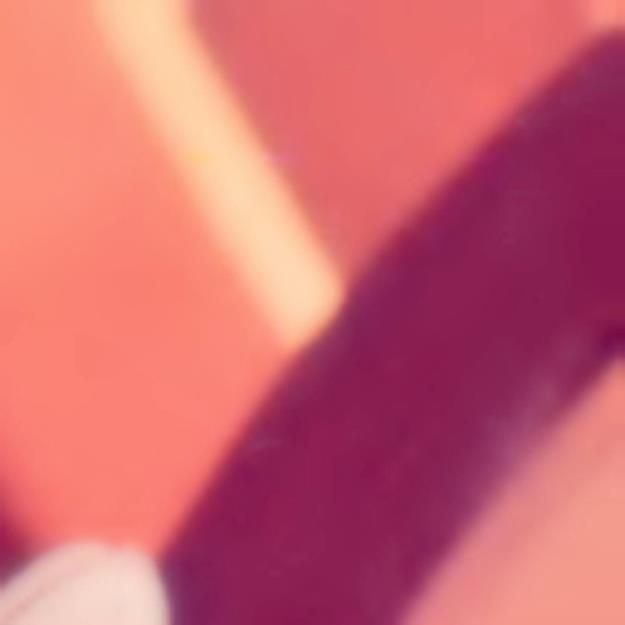
FIGURE 2 Examples of recovered images of Lenna compressed at 0.9 bpp. (a) JPEG2000 PSNR = 31.19 dB and (b) JPEG2000-F-pSQ PSNR = 27.57 dB.
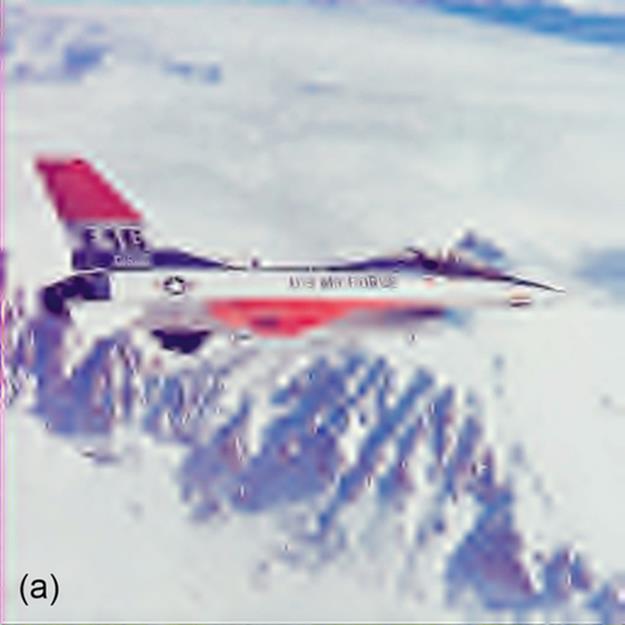

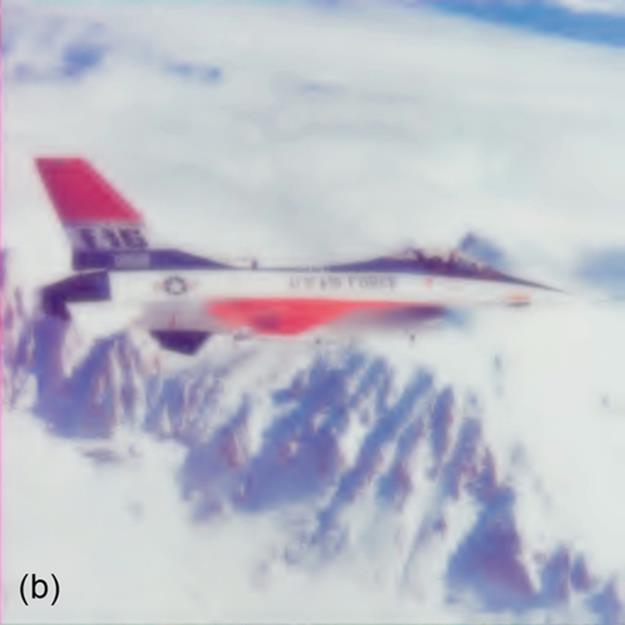

FIGURE 3 Examples of recovered images of F-16 compressed at 0.4 bpp. (a) JPEG2000 PSNR = 25.12 dB. (b) JPEG2000-F-pSQ PSNR = 24.57 dB.
Figure 4 shows examples of recovered images of Baboon compressed at 0.59, and 0.45 bits per pixel by means of JPEG2000 (a) without and (b) with F-pSQ. In Figure 4(a) PSNR = 26.18 dB and in Figure 4(b) PSNR = 26.15 dB but a perceptual metrics like WSNR [8], for example, assesses that it is equal to 34.08 dB. Therefore, the recovered image forward quantized by pSQ is perceptually better than the one only quantized by an SQ. Since the latter produces more compression artifacts, the pSQ result at 0.45 bpp (Figure 4(b)) contains less artifacts than SQ at 0.59 bpp. For example, the Baboon’s eye is softer and better defined using F-pSQ and it additionally saves 4.48 kB of information.
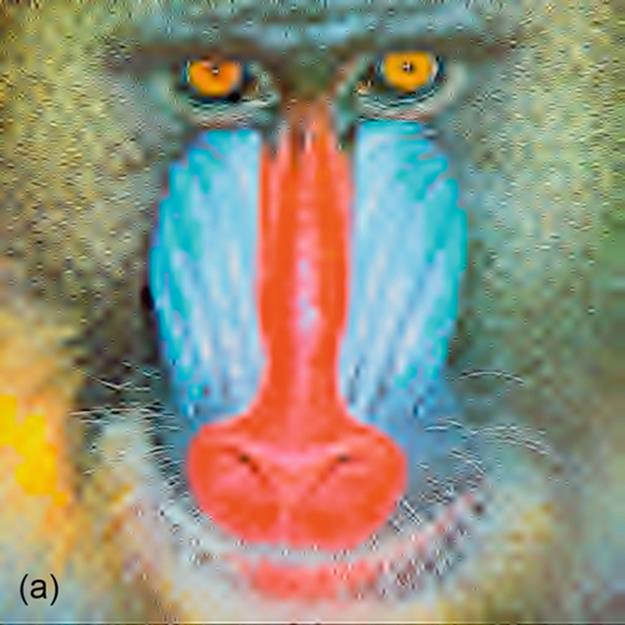


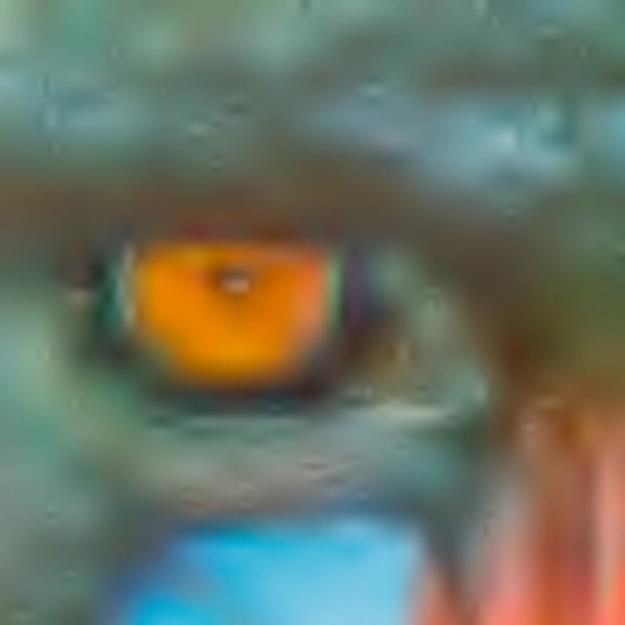
FIGURE 4 Examples of recovered images of Baboon. (a) JPEG2000 compressed at 0.59 bpp. (b) JPEG2000-F-pSQ compressed at 0.45 bpp.
3.3 Perceptual Inverse Quantization
The proposed perceptual quantization is a generalized method, which can be applied to wavelet transform-based image compression algorithms such as EZW, SPIHT, SPECK, JPEG2000, or Hi-SET.
The main challenge underlies in to recover not only a good approximation of coefficients Q but also the visual weight α(ν, r) (Equation 2) that weighted them. A recovered approximation ![]() with a certain distortion Λ is decoded from the bitstream by the entropy decoding process. The VFWs were not encoded during the entropy encoding process, since it would increase the amount of stored data. A possible solution is to embed these weights α(ν, r) into
with a certain distortion Λ is decoded from the bitstream by the entropy decoding process. The VFWs were not encoded during the entropy encoding process, since it would increase the amount of stored data. A possible solution is to embed these weights α(ν, r) into ![]() . Thus, our goal is to recover the α(ν, r) weights only using the information from the bitstream, namely, from the forward quantized coefficients
. Thus, our goal is to recover the α(ν, r) weights only using the information from the bitstream, namely, from the forward quantized coefficients ![]() .
.
The reduction of the dynamic range is uniformly made by the perceptual quantizer; thus, the statistical properties of I are maintained in ![]() . Therefore, our hypothesis is that an approximation
. Therefore, our hypothesis is that an approximation ![]() of α(ν, r) can be recovered applying CBPF to
of α(ν, r) can be recovered applying CBPF to ![]() , with the same viewing conditions used in I. That is,
, with the same viewing conditions used in I. That is, ![]() is the recovered e-CSF. Thus, the perceptual inverse quantizer or the recovered
is the recovered e-CSF. Thus, the perceptual inverse quantizer or the recovered ![]() introduces perceptual criteria to inverse scalar quantizer and is given by
introduces perceptual criteria to inverse scalar quantizer and is given by
 (3)
(3)
4 Experimental results
For the sake of showing that the encoded VFWs are approximately equal to the decoded ones, that is, ![]() , we perform two experiments.
, we perform two experiments.
4.1 Based on Histogram
Histogram of α(ν, r) and ![]() . The process of this short experiment is shown in Figure 5. Figure 5(a) depicts the process for obtaining losslessy both encoded and decoded visual weights for the 512 × 512 Lena image, Channel Y at 10 m. While Figure 5(b) and (c)shows the frequency histograms of α(ν, r) and
. The process of this short experiment is shown in Figure 5. Figure 5(a) depicts the process for obtaining losslessy both encoded and decoded visual weights for the 512 × 512 Lena image, Channel Y at 10 m. While Figure 5(b) and (c)shows the frequency histograms of α(ν, r) and ![]() , respectively. In both graphs, the horizontal axis represents the sort of VFW variations, whereas the vertical axis represents the number of repetitions in that particular VFW. The distribution in both histograms is similar and they have the same shape.
, respectively. In both graphs, the horizontal axis represents the sort of VFW variations, whereas the vertical axis represents the number of repetitions in that particular VFW. The distribution in both histograms is similar and they have the same shape.
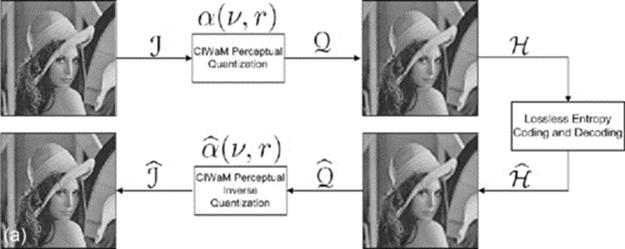
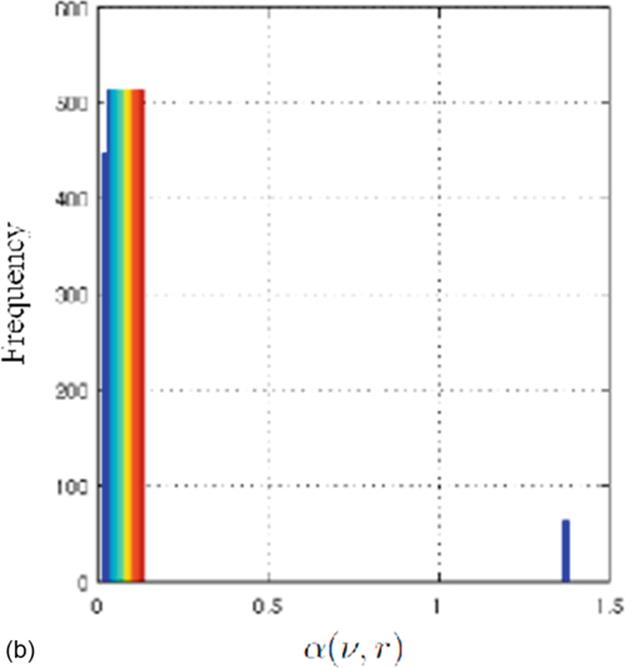
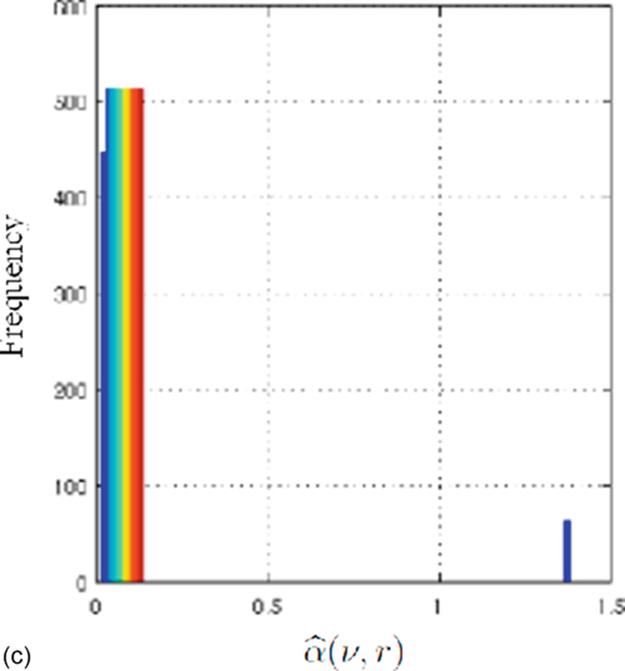
FIGURE 5 (a) Graphical representation of a whole process of compression and decompression. histograms of (b) α(ν, r) and (c) ![]() visual frequency weights for the 512 × 512 image Lenna, channel Y at 10 m.
visual frequency weights for the 512 × 512 image Lenna, channel Y at 10 m.
4.2 Correlation Analysis
Correlation analysis between α(ν, r) and ![]() . We employ the process shown in Figure 5(a) for all the images of the CMU, CSIQ, and IVC image databases. In order to obtain
. We employ the process shown in Figure 5(a) for all the images of the CMU, CSIQ, and IVC image databases. In order to obtain ![]() , we measure the lineal correlation between the original α(ν, r) applied during the F-pSQ process and the recovered
, we measure the lineal correlation between the original α(ν, r) applied during the F-pSQ process and the recovered ![]() . Table 2 shows that there is a high similarity between the applied VFW and the recovered one, since their correlation is 0.9849, for gray-scale images, and 0.9840, for color images.
. Table 2 shows that there is a high similarity between the applied VFW and the recovered one, since their correlation is 0.9849, for gray-scale images, and 0.9840, for color images.
Table 2
Correlation Between α(ν, r) and ![]() Across CMU, CSIQ, and IVCIMAGE Databases
Across CMU, CSIQ, and IVCIMAGE Databases
|
Image Database |
8 bpp Gray-Scale |
24 bpp Color |
|
CMU |
0.9840 |
0.9857 |
|
CSIQ |
0.9857 |
0.9851 |
|
IVC |
0.9840 |
0.9840 |
|
Overall |
0.9849 |
0.9844 |
Figure 6 depicts the PSNR difference (dB) of each color image of the CMU database, that is, the gain in dB of image quality after applying ![]() at d = 2000 cm to the
at d = 2000 cm to the ![]() images. On average, this gain is about 15 dB. Visual examples of these results are shown inFigure 7, where the right images are the original images, central images are perceptual quantized images after applying α(ν, r), and left images are recovered images after applying
images. On average, this gain is about 15 dB. Visual examples of these results are shown inFigure 7, where the right images are the original images, central images are perceptual quantized images after applying α(ν, r), and left images are recovered images after applying ![]() .
.
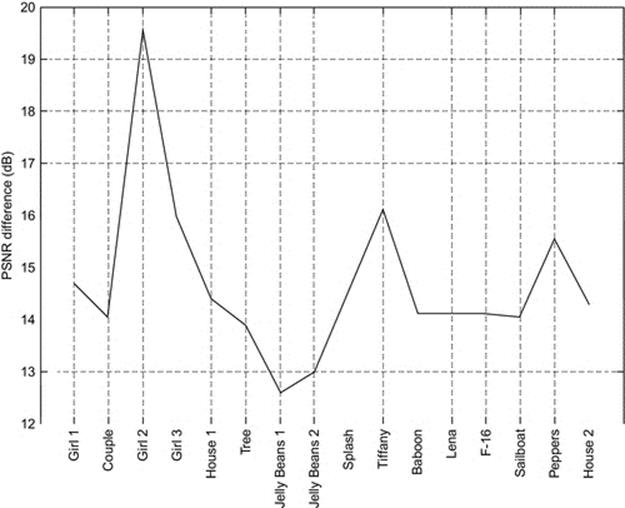
FIGURE 6 PSNR difference between Q image after applying α(ν, r) and recovered ![]() after applying
after applying ![]() for every color image of the CMU database.
for every color image of the CMU database.
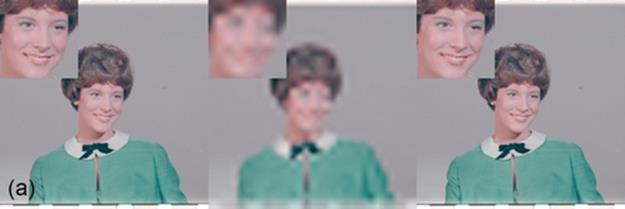
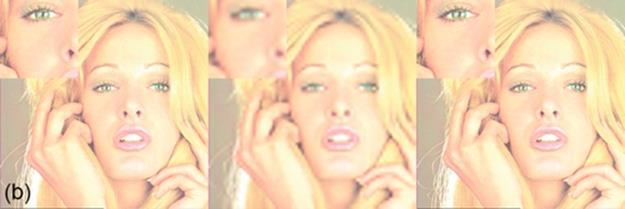

FIGURE 7 Visual examples of perceptual quantization. Left images are the original images, central images are forward perceptual quantized images (F-pSQ) after applying ![]() at d = 2000 cm, and right images are recovered I-pSQ images after applying
at d = 2000 cm, and right images are recovered I-pSQ images after applying ![]() . (a) Girl 2. (b) Tiffany. (c) Peppers.
. (a) Girl 2. (b) Tiffany. (c) Peppers.
After applying ![]() , a visual inspection of these 16 recovered images shows a perceptually lossless quality. We perform the same experiment for gray-scale and color images with d = 20, 40, 60, 80, 100, 200, 400, 800, 1000, and 2000 cm, in addition to test their objective and subjective image quality by means of the PSNR and MSSIM metrics, respectively.
, a visual inspection of these 16 recovered images shows a perceptually lossless quality. We perform the same experiment for gray-scale and color images with d = 20, 40, 60, 80, 100, 200, 400, 800, 1000, and 2000 cm, in addition to test their objective and subjective image quality by means of the PSNR and MSSIM metrics, respectively.
In Figures 8 and 9, green functions denoted as F-pSQ are the quality metrics of perceptual quantized images after applying α(ν, r), while blue functions denoted as I-pSQ are the quality metrics of recovered images after applying ![]() in CMU image data base. Thus, for either gray-scale or color images, both PSNR and MSSIM estimations of the quantized image
in CMU image data base. Thus, for either gray-scale or color images, both PSNR and MSSIM estimations of the quantized image ![]() decrease regarding d, the longer the d the greater the image quality decline. When the image decoder recovers Q and it is perceptually inverse quantized, the quality barely varies and is close to perceptually lossless, no matter the distance
decrease regarding d, the longer the d the greater the image quality decline. When the image decoder recovers Q and it is perceptually inverse quantized, the quality barely varies and is close to perceptually lossless, no matter the distance
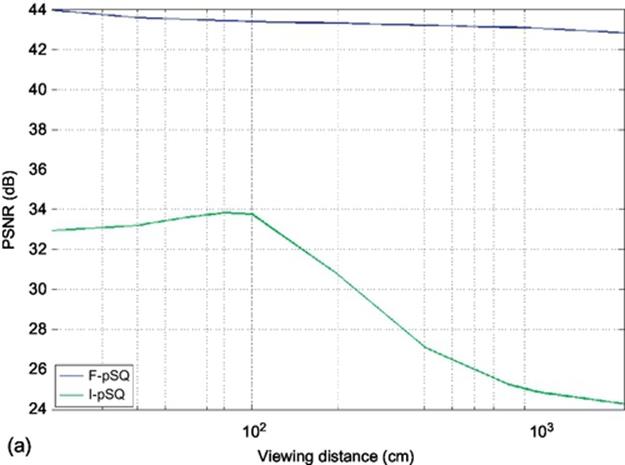
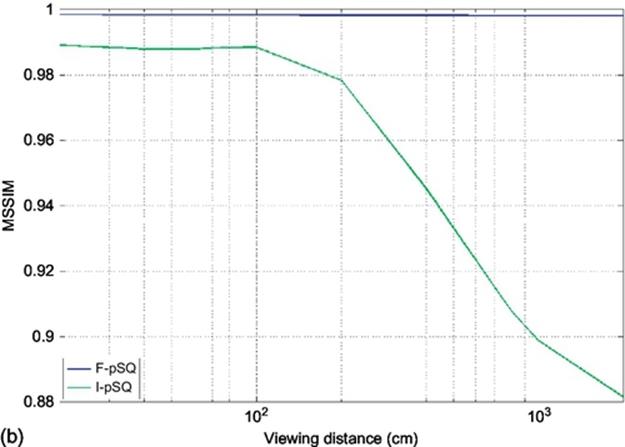
FIGURE 8 PSNR and MSSIM assessments of compression of gray-scale images (Y Channel) of the CMU image database. Green functions denoted as F-pSQ are the quality metrics of forward perceptual quantized images after applying α(ν, r), while blue functions denoted as I-pSQ are the quality metrics of recovered images after applying ![]() . (a) PSNR. (b) MSSIM.
. (a) PSNR. (b) MSSIM.
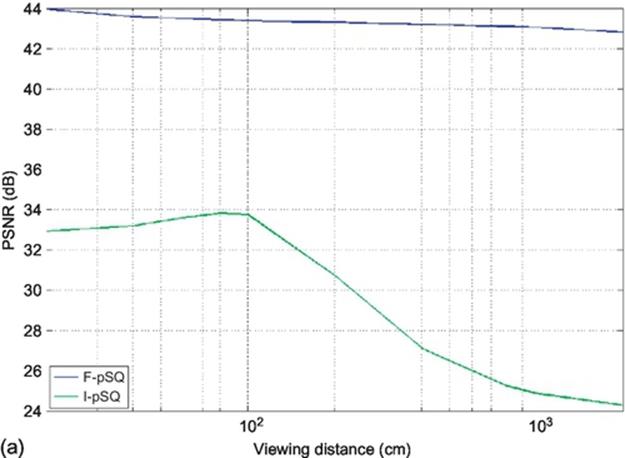
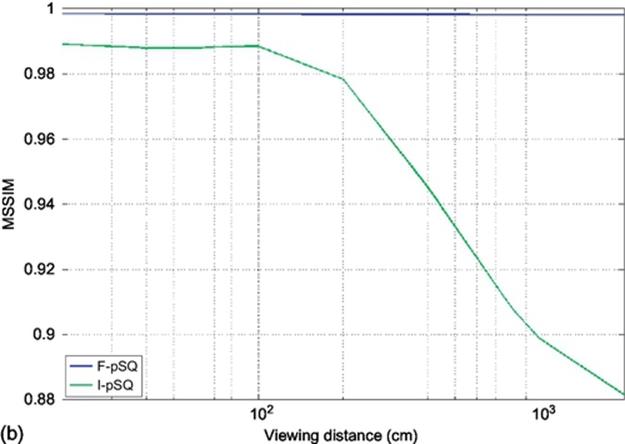
FIGURE 9 PSNR and MSSIM assessments of compression of Color Images of the CMU image database. Green functions denoted as F-pSQ are the quality metrics of forward perceptual quantized images after applying α(ν, r), while blue functions denoted as I-pSQ are the quality metrics of recovered images after applying ![]() . (a) PSNR. (b) MSSIM
. (a) PSNR. (b) MSSIM
Results obtained both in the categorical subjective image quality image database [9] (Figures 10 and 11) and image and video-communication image database [10] (Figures 12 and 13) show that for either gray-scale or color images, both PSNR and MSSIM estimations of the quantized image Q decrease regarding d, the longer the d the greater the image quality decline. When the image decoder recovers ![]() and it is perceptually inverse quantized, the quality barely varies and is close to perceptually lossless, no matter the distance.
and it is perceptually inverse quantized, the quality barely varies and is close to perceptually lossless, no matter the distance.
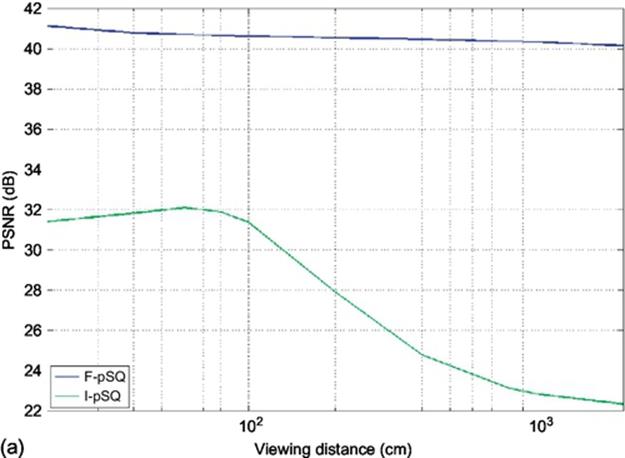
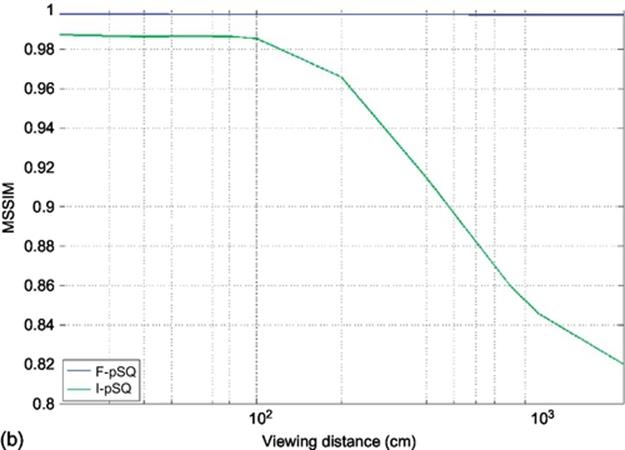
FIGURE 10 Compression of gray-scale images (Y Channel) of the CSIQ image database. (a) PSNR. (b) MSSIM.
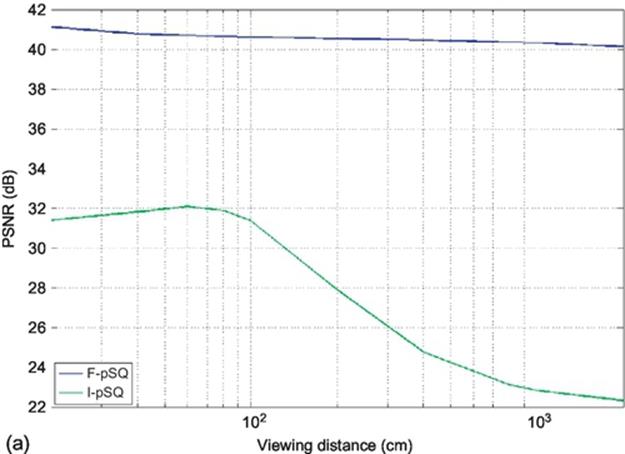
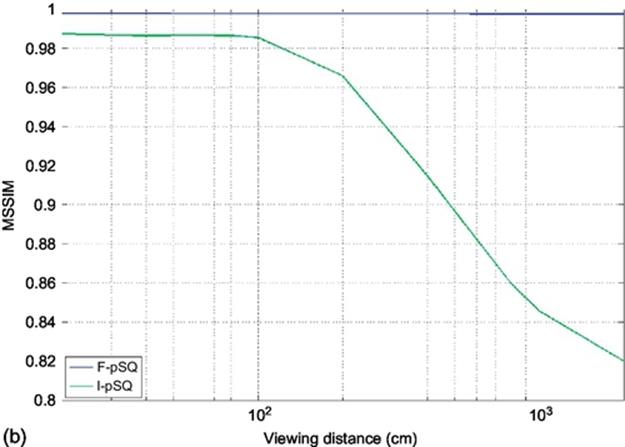
FIGURE 11 Perceptual quantization of color images of the CSIQ image database. (a) PSNR. (b) MSSIM.
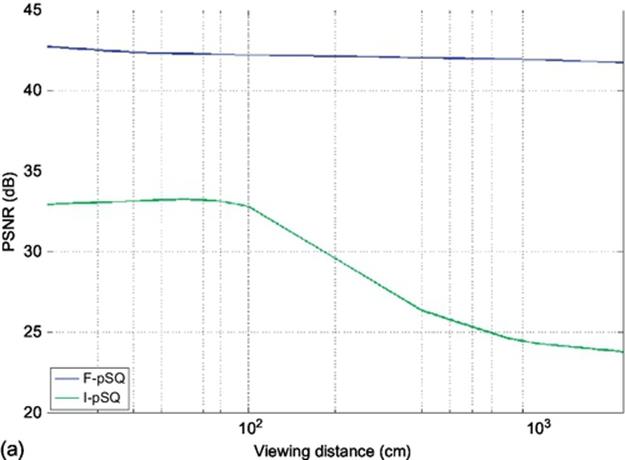
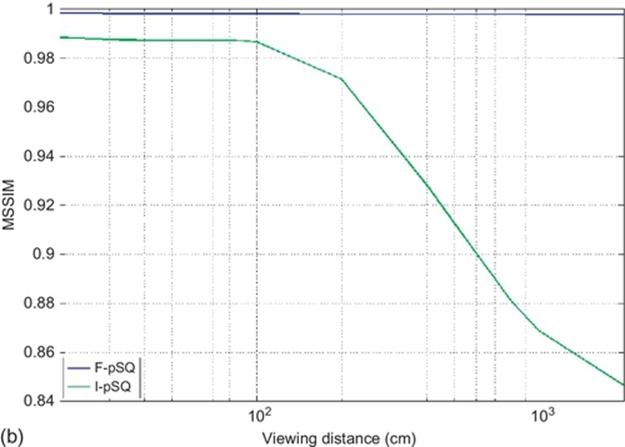
FIGURE 12 Perceptual quantization of gray-scale images (Y Channel) of the IVC image database. (a) PSNR. (b) MSSIM.
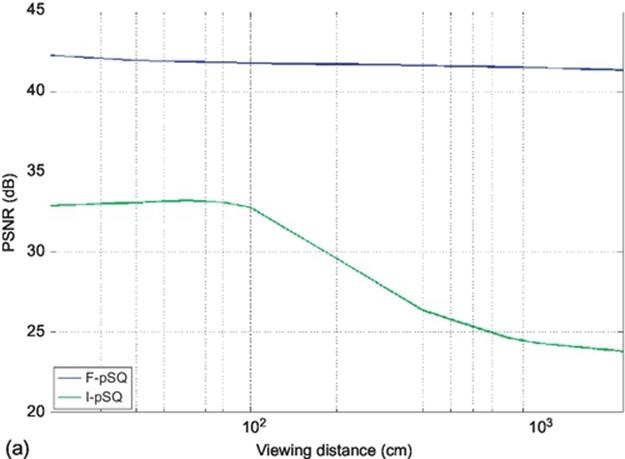
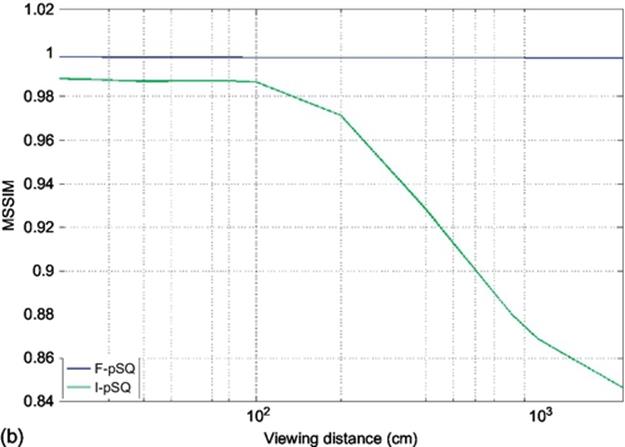
FIGURE 13 Perceptual quantization of color images of the IVC image database. (a) PSNR. (b) MSSIM.
5 Conclusions
In this work, we defined both forward (F-pSQ) and inverse (I-pSQ) perceptual quantizer using CBPF. We incorporated it to Hi-SET, testing a perceptual image compression system Hi-SET + pSQ. In order to measure the effectiveness of the perceptual quantization, a performance analysis is done using 13 assessments such as PSNR or MSSIM, for instance, which measured the image quality between reconstructed and original images. The experimental results show that the solely usage of the forward perceptual quantization improves the JPEG2000 compression and image perceptual quality.
References
[1] Moreno J, Morales O, Tejeida R. pSQ: image quantizer based on contrast band-pass filtering. In: International conference on image processing, computer vision, and pattern recognition of the world congress in computer science, computer engineering, and applied, computing; 2014:256–261.
[2] Moreno J, Otazu X. Image coder based on Hilbert scanning of embedded quadTrees: an introduction of Hi-SET coder. In: IEEE international conference on multimedia and expo; 2011.
[3] Boliek M, Christopoulos C, Majani E. Information technology: JPEG2000 image coding system, JPEG 2000 Part I final committee draft version 1.0 ed., ISO/IEC JTC1/SC29 WG1, JPEG 2000; April 2000.
[4] Otazu X, Parraga C, Vanrell M. Towarda unified chromatic induction model”. J Vis. 2010;10(12):6.
[5] Mullen K. The contrast sensitivity of human color vision to red-green and blue-yellow chromatic gratings. J Physiol. 1985;359:381–400.
[6] S. I.P. I. of the University of Southern California. (1997) The USC-SIPI image database. Signal and Image Processing Institute of the University of Southern California. [Online]. Available: http://sipi.usc.edu/database/.
[7] C. Research, École Polytechnique Fédérale de Lausanne, and Ericsson. JJ2000 implementation in Java. Cannon Research, École Polytechnique Fédérale de Lausanne and Ericsson. [Online]. Available: http://jj2000.epfl.ch/; 2001.
[8] Mitsa T, Varkur K. Evaluation of contrast sensitivity functions for formulation of quality measures incorporated in halftoning algorithms. 301–304. IEEE international conference on acoustics, speech and signal processing. 1993;vol. 5.
[9] Larson EC, Chandler DM. Most apparent distortion: a dual strategy for full-reference image quality assessment. Proc SPIE. 2009;742:1–17.
[10] le Callet P, Autrusseau, F. Subjective quality assessment IRCCyN/IVC database, http://www.irccyn.ec-nantes.fr/ivcdb/; 2005.
All materials on the site are licensed Creative Commons Attribution-Sharealike 3.0 Unported CC BY-SA 3.0 & GNU Free Documentation License (GFDL)
If you are the copyright holder of any material contained on our site and intend to remove it, please contact our site administrator for approval.
© 2016-2026 All site design rights belong to S.Y.A.