Emerging Trends in Image Processing, Computer Vision, and Pattern Recognition, 1st Edition (2015)
Part I. Image and Signal Processing
Chapter 6. Rebuilding IVUS images from raw data of the RF signal exported by IVUS equipment
Marco Aurélio Granero1,2; Marco Antônio Gutierrez3; Eduardo Tavares Costa1 1 Department of Biomedical Engineering, DEB/FEEC/UNICAMP, Campinas, Brazil
2 Federal Institute of Education, Science and Technology São Paulo—IFSP, Sao Paulo, Brazil
3 Division of Informatics/Heart Institute, HCFMUSP, Sao Paulo, Brazil
Abstract
The study of composition and classification of atherosclerotic plaque has been a very active research field, both in cardiology and image processing. Intravascular ultrasound (IVUS) is an effective tool, which can insight on the cross-section of blood vessels, with sufficient accuracy to allow an accurate assessment of computed tomography slices. This enables information about blood vessel structures to be determined. During an IVUS medical examination, physicians subjectively adjust a set of parameters to improve the visualization of a region of interest and produce corresponding images in Digital Imaging and Communications format (DICOM Images), for later analysis and study. DICOM is appropriate for storage, transportation, and access, but limits subsequent changes to image parameters, such as contrast or brightness. This makes comparison across patient populations difficult and restricts image-processing operations. This article details an alternative to using DICOM, which is to rebuild IVUS images from raw radiofrequency (RF) signal data. The main advantage of this process is the independence of the acquisition parameters adjusted during the exam. This advantage makes possible the comparison between exams and can be used to monitor the evolution of cardiovascular disease. Beyond this, once the reconstructed images and the RF signal are stored, operations relating to texture and spectral analysis can be carried out and automatic classifiers employed. From a clinical point of view these reconstructed images share the same characteristics as DICOM images with an advantage that the former have a higher contrast than the latter, allowing deeper regions to be seen.
Keywords
RF signal
IVUS image
Rebuilding process
Ultrasound image
RF raw data
Acknowledgments
The authors want to thank the Department of Hemodynamic of Heart Institute to provide the RF dada set. Beyond this, this work would not be possible without the help of Mariana, Paulo, and John, great friends of my life, and the financial support of the Brazilian National Institute of Science and Technology in Medicine Assisted by Scientific Computing (INCT—MAAC) and National Council for Scientific and Technological Development (CNPq).
1 Introduction
Among the different modalities of medical images, ultrasound is arguably the most difficult in which to perform segmentation. This is evident from a study of the first papers on segmentation, in which it was only possible to apply a threshold to the image in order to separate the background from foreground due to the poor quality of the acquired data [1].
At the same time, subsequent technological development has greatly increased the quality of ultrasound images, especially in terms of signal-to-noise ratio and contrast-to-noise ratio (CNR), resulting in improvements to image quality. Several studies have been highlighted that aim to develop algorithms for the design of edges on objects contained in ultrasound images [1].
Ultrasonic tissue characterization (UTC) has become a well-established research field since its first publication [2]. Thijssen [3] defines UTC as the assessment by ultrasound of quantitative information about the characteristics of biological tissue and their pathology. This quantitative information is extracted from echographic data from radiofrequency (RF) data.
UTC applications abound in the literature and include classification of breast tissue [4,5], liver [5], heart [6,7], eyes [8], skin [9], kidney [10], and prostate [11].
Szabo [12] defines two general goals for UTC which can be applied to the above areas:
(i) reveal the properties of tissues by analyzing the RF signal backscattered by ultrasound transducer and
(ii) use information about the properties of the tissue to distinguish between the state of tissue (healthy or diseased) or to detect changes in these properties when subjected to stimuli or long periods of time in response to natural processes or medication.
Reaching these goals can be challenging since the interaction between biological tissue and sound waves is extremely difficult to model and the process evolved in image segmentation is strongly influenced by the quality of data and by the different parameters used during the acquisition process of an image.
Parameters like contrast, brightness, and gain are adjusted by physicians to improve the visualization of regions during the examination. These changes determine the digital imaging and communications (DICOM) images that are recorded and the result cannot be changed after the image has been acquired. This greatly complicates the comparison between patients and the use of images in studies of groups of patients.
Thus, to avoid these complications and make image reconstructed independent of the parameters set by the physician, a reconstruction method from Intravascular ultrasound (IVUS) images is proposed. This method is based on the RF signal stored by the equipment during medical imaging examinations of IVUS.
The process of rebuilding starts with applying a band-pass filter to the RF signal to eliminate signals that do not come from the transducer. In the next step, a time gain compensation (TGC) function is applied to compensate for attenuation loss. After this, the envelope of the signal is computed and the result is log-compressed and normalized in a grayscale image.
After the process of rebuilding, the grayscale image, in polar coordinators, is submitted to a digital development process (DDP) responsible for enhancing the contrast and edge emphasis. So, the image is interpolated to cartesian coordinators. The cartesian image is further processed with an intensity transformation function to improve the contrast of the final cartesian grayscale IVUS image.
The above processes are described in more detail in Section 2 and the results obtained are shown in Section 3. In Section 4 a comparison is made between reconstructed images and DICOM images from an examination. Section 4 also presents the conclusions and possibilities for future work. This article is an extended version of the paper presented in the 2014 International Conference on Image Processing, Computer Vision, and Pattern Recognition [13].
2 Method for IVUS image reconstruction
An IVUS examination is carried out by inserting a catheter into coronary arteries via femoral or brachial vessels. At the tip of this catheter there is an ultrasound emitter and a piezoelectric transducer that collect the echoes reflected by internal structures of the vessel as RF signal.
A schematic representation of the execution of an IVUS examination is shown in Figure 1(a), where the IVUS equipment collects data from patient and stores it in the workstation. Figure 1(b) shows an IVUS rotational catheter.
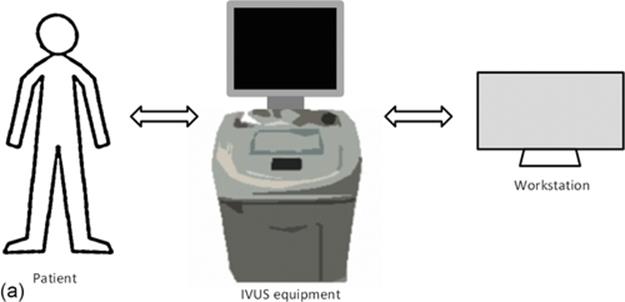
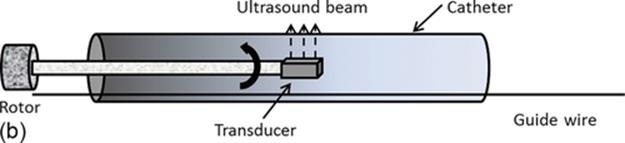
FIGURE 1 (a) IVUS in vivo analysis typical scenario and (b) rotational IVUS catheter.
During an IVUS exam, the acquired images are stored in DICOM format and exported to the databank of the clinical centre to be used for clinical diagnosis.
To improve the quality of the images, in terms of CNR, physicians frequently need to adjust parameters like contrast and brightness to improve the visualization of the region of interest (ROI).
In addition to the images in DICOM format, the equipment allows the RF signal to be recorded, which are used in the manufacture of images in a proprietary format.
The proposal of this article is to process the RF signal data according to the steps shown in Figure 2 and detailed below, to rebuild the IVUS images with an independent and fixed set of parameters.
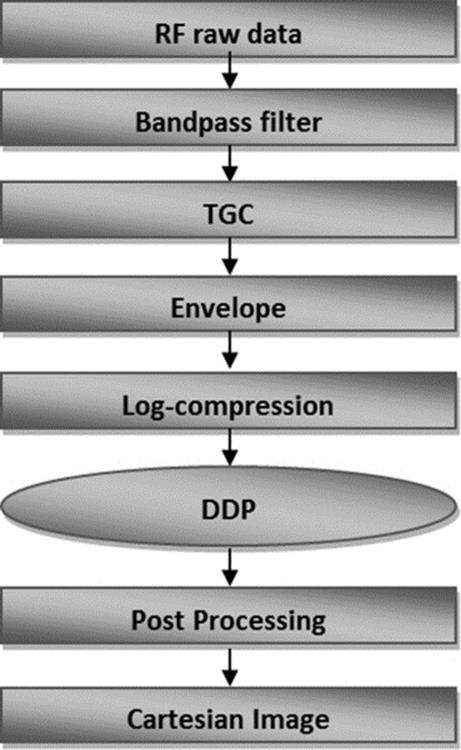
FIGURE 2 Block diagram of reconstruction process.
2.1 RF Dataset
The data were taken from examinations in the Department of Hemodynamic in the Heart Institute of the Medical School of the University of São Paulo (Heart Institute, HCFMUSP), Brazil, using iLab IVUS equipment (Boston Scientific, Fremont, USA), equipped with a 40-MHz catheter Atlantis SR 40 Pro and anonymized to avoid the identification of the patient and used only for research purposes.
The RF File Reader (designed by Boston Scientific) is an xml file that contains information about the examination. This file allows us to identify the number of rows, columns, and frames from each exam. Beyond this, the reader contains the distance from each pixel in the image, in millimeters.
Once image attributes have been found using the RF File Reader, it is possible to extract the data. These data were placed in a tri-dimensional matrix. The rows of this matrix represent the lines in A-mode, each line with radial information about the vessel, the columns represent the distance to the tip of catheter and the slices, third dimension, represent each time frames of the exam. The study of IVUS used in this work results in a 3D matrix, where the dimensions represents the size of each image and the third dimension being the number of frames.
After this, each frame was submitted to the reconstruction shown in Figure 2.
2.2 Band-Pass Filter
A Butterworth band-pass filter was applied to dataset in order to eliminate frequencies that do not come from the transducer. The manufacture of transducer describes the central frequency emitted by transducer at the tip of catheter as 40 MHz and frequency sample rate as 200 MHz.
Each line in A-mode was filtered by a Butterworth finite impulse response (FIR) filter. The frequency range was adjusted between 20 and 60 MHz as can be viewed in Figure 3(a).
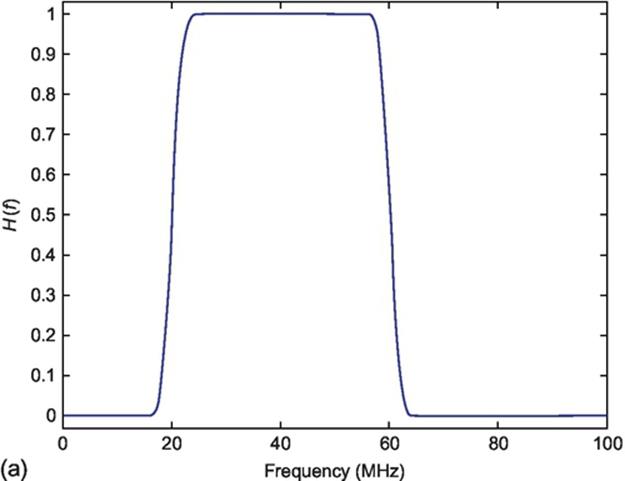
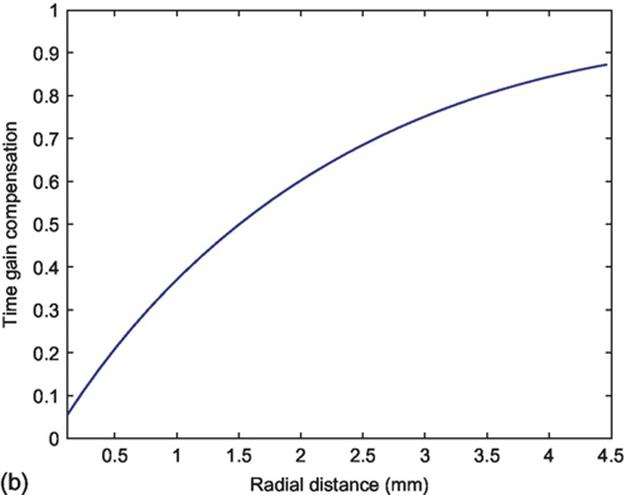
FIGURE 3 (a) Frequency response of the Butterworth FIR filter and (b) profile of TGC function.
2.3 Time Gain Compensation
The ultrasound is a mechanical wave and due to this nature, the intensity of the ultrasound beam is attenuated as it penetrates the tissue.
To compensate for this loss in signal intensity, TGC is applied to each line in A-mode, which is defined as
![]() (1)
(1)
where β is the coefficient of attenuation and r is the radial distance from tip of catheter.
The range of the radial distance was extracted from the RF File Reader of exam ranging until 4.48 cm.
In Ciompi [14], RF signal of in vivo and ex vivo was used to develop a multiclass classifier to the problem of characterization of the atherosclerotic plaque. They define a value for the coefficient of attenuation as β = 0.4605 dB/cm, which was adopted in this work.
The profile of TGC function is shown in Figure 3(b).
2.4 Signal Envelope
To show the changes stemming from the texture and not from the wave profile, the envelope of the signal is obtained simply applying the Hilbert transform to each line in A-mode from the RF signal, Figure 4(a).
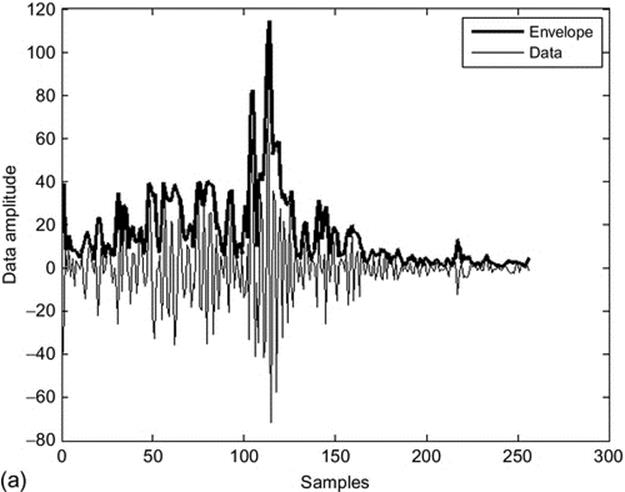
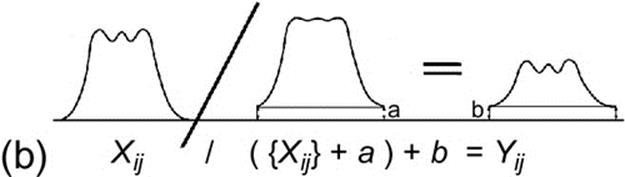
FIGURE 4 (a) RF envelope is shown as a black line over the wave profile of RF signal gray line (data) and (b) DDP transformation.
2.5 Log-Compression
The next stage in the procedure described in Figure 2, is to normalize the RF signal providing values between 0 and 1 in order to permit work with a homogeneous range for all IVUS images. After this, the RF signal undergoes a transformation whose purpose is to map a narrow range of grayscale values in an input image to a wide range of output levels [15]. This transformation is defined as
![]()
where Inor represents the RF signal normalized and t is a constant empirically obtained to improve the log-compression.
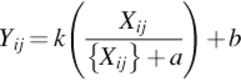
2.6 Digital Development Process
The DDP consist of a nonlinear intensity transformation, used frequently in photography, to emphasize dark regions in images with a large dynamic range, without saturation or overexposure of brighter areas.
This way, in order to emphasize the edges borders and improve contrast gain, a DDP was applied to the image [15].
Each pixel value of an image was modified by the following equation to produce an image with better CNR:
 (3)
(3)
where Xij is obtained by applying a Gaussian low-pass filter, with order 3 and σ = 0.5, to the original image. The parameters a and b control the radial contrast gain and were empirically determined to improve the CRN, Figure 4(b).
The parameter k is a simple gain and the term ![]() control the edge emphasis.
control the edge emphasis.
2.7 Postprocessing
This step in the rebuilding process aims to expand the gray level dynamic band, in term of saturation of the image. It was obtained applying a gamma correction intensity transformation to the image [15].
After this, the image was converted and interpolated to cartesian form, resulting in an image with 512 × 512 pixels and 256 gray levels.
Finally, a two-dimensional (2D) Gabor filter was applied to the image to enhancing the changes streaming from texture and to evidence the edges.
A 2D Gabor filter is a complex field sinusoidal, modulated by a 2D gaussian function in the spatial domain [16].
3 Experimental results
The results of the rebuilding process of the IVUS images are shown in Figure 5, which the major structures visible in an IVUS examination are identified.
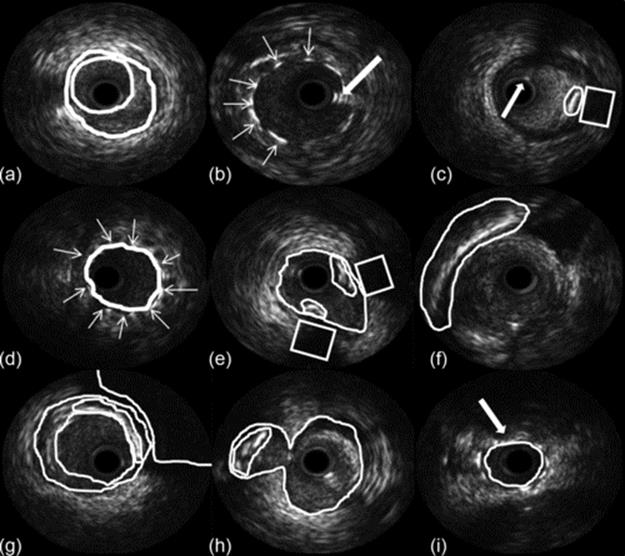
FIGURE 5 Nine images from the reconstruction process showing different regions (a) lumen-adventitia borders, (b) stent, (c) calcification, (d) stent, (e) bifurcation region, (f) pericardium shadow, (g) calcification, (h) bifurcation, and (i) malposition stent.
Figure 5(a) shows the segmentation of lumen and the media-adventitia borders and Figure 5(b) shows the stent and an artifact generated by the wire guide. Figure 5(c) shows a region with calcification and the acoustic shadow behind it, with an arrow pointing to an artifact generated by the wire guide.
Figure 5(e) and (h) shows a bifurcation region, with calcification. A stent is visible in Figure 5(d) and (i), and it is possible to identify the malposition of the stent in Figure 5(i).
Figure 5(f) shows the shadow of the pericardium and Figure 5(g) the acoustic shadow of a big calcification and the lumen and media-adventitia borders.
Figure 6 shows both the rebuild image and the DICOM images, Figure 6(a)–(d) as possible to see DICOM images and in Figures 6(e)–(h) the images rebuilding by the method propose in this article.
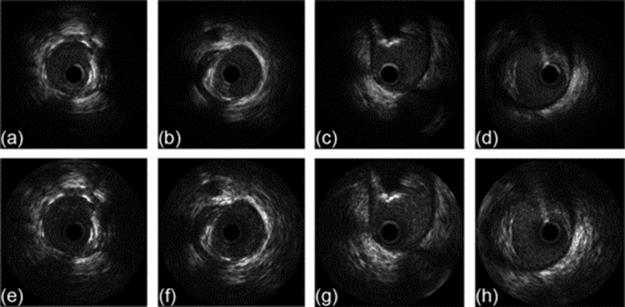
FIGURE 6 (a)–(d) DICOM images and (e)–(h) rebuilt images.
As can be seen, the rebuilt images show the same structures as DICOM images, and in all cases the contrast of the rebuild images is better than the DICOM images. What is perhaps most noticeable is the difference in visibility in the outer region of the lumen. The reconstructed image shows fine detail where the DICOM shows only a black region.
4 Discussion, conclusion, and future work
IVUS is an examination that can provide a good quality image of the cross-section of blood vessel allowing the assessment of inner structures.
In an IVUS medical examination, sets of hundreds or even thousands of images are acquired and used as the basis for a medical diagnosis.
These images are subject to a variability of interpretation inter and intra operator because a set of parameter are adjusted to improve the visualization of an ROI. Once the images are acquired, these parameters cannot be changed, restricting the comparison between different examinations or patients.
To avoid this limitation, this work describes a methodology for reconstructing IVUS images from RF raw data, which are independent of the parameters adjusted by the physician during the exam and which can be processed to improve the CNR of the image.
The RF signal is processed according to the theoretic model proposed in Section 2 and illustrated in Figure 2. The parameters used in the model were adjusted to maximize CNR enabling identification of the main structures of the vessel.
The results of the proposed model were presented in Figures 5 and 6 and compared with the DICOM images generated by the equipment. The proposed model produces images with superior CNR which can be used for clinical purposes.
In the figures, it is possible to see the main structures of the vessel and this result can be used to perform segmentation to help the physician in diagnosis process. Beyond this, it is possible to identify bifurcations and calcifications regions to be submitted a percutaneous coronary intervention.
Considering the data used in this work, the propose method was proved to be robust with regard to fidelity in the reconstruction of structures in comparison with DICOM image and, in all cases the CNR in reconstructed images was higher than DICOM images (Figure 6).
The study of RF signal plays a fundamental role in the rebuilding process and can be used to development of automatic segmentation algorithm of the structures of the vessel and to development of automatic classifiers by tissue characterization.
Thereby, as future works, we are planning to develop a segmentation algorithm and automatic classifiers to perform a tissue classification based on texture and spectral analysis of the RF signal.
References
[1] Noble JA. Ultrasound image segmentation and tissue characterization. Proc Inst Mech Eng H: J Eng Med. 2010;224:307. doi:10.1243/09544119JEIM604.
[2] Mountford RA, Wells PNT. Ultrasonic liver scanning: the A-scan in the normal and cirrhosis. Phys Med Biol. 1972;17:261–269.
[3] Thijssen JM. Ultrasonic speckle formation, analysis and processing applied to tissue characterization. Pattern Recogn Lett. 2003;24:659–675.
[4] Tsui P-H, Yeh C-K, Chang C-C, Liao Y-Y. Classification of breast masses by ultrasonic Nakagami imaging: a feasibility study. Phys Med Biol. 2008;53:6027–6044.
[5] Molthen RC, Shankar PM, Reid JM, Forsberg F, Halpern EJ, Piccoli CW, et al. Comparisons of the Rayleigh and K distribution models using in vivo breast and liver tissue. Ultrasound Med Biol. 1998;24:93–100.
[6] Clifford L, Fitzgerald P, James D. Non-Rayleigh first-order statistics of ultrasonic backscatter from normal myocardium. Ultrasound Med Biol. 1993;19:487–495.
[7] Nillesen MM, Lopata RGP, Gerrits IH, Kapusta L, Thijssen JM, de Korte CL. Modeling envelope statistics of blood and myocardium for segmentation of echocardiographic images. Ultrasound Med Biol. 2008;34(4):674–680.
[8] Lizzi FL, Greenbaum M, Feleppa EJ, Elbaum M, Coleman DJ. Theoretical framework for spectrum analysis in ultrasonic tissue characterization. J Acoustic Soc Am. 1983;73:1366–1373.
[9] Raju BI, Swindells KJ, Gonzalez S, Srinivasan MA. Quantitative ultrasonic methods for characterization of skin lesions in vivo. Ultrasound Med Biol. 2003;29(6):825–838.
[10] Engelhorn A.L.D.V., Engelhorn CA, Salles-Cunha SX, Ehlert R, Akiyoshi FK, Assad KW. Ultrasound tissue characterization of the normal kidney. Ultrasound Quart. 2012;28(4).
[11] Moradi M. A new paradigm for ultrasound-based tissue typing in prostate cancer [Tese de doutorado]. School of Computing, Queen's University; 2008.
[12] Szabo TL. Diagnostic ultrasound imaging inside out. Hartford, Connecticut: Elsevier; 2004.
[13] Granero MA, Gutierrez MA, Costa ET. Rebuilding IVUS images from raw data of the RF signal exported by IVUS equipment. In: The 2014 international conference on image processing, computer vision, and pattern recognition, 2014, Las Vegas, IPCV '14; 2014:57–62.
[14] Ciompi F. Ecoc-based plaque classification using in-vivo and ex-vivo intravascular ultrasound data [Master thesis]. Computer Vision Center, Universitat Autonoma de Barcelona; 2008.
[15] Gonzalez RC, Woods RE, Eddins SL. Digital image processing using Matlab. Prentice Hall; 2004.
[16] Pratt WK. Digital image processing: PIKS Scientific inside. 4th ed. John Wiley & Sons; 2007.
All materials on the site are licensed Creative Commons Attribution-Sharealike 3.0 Unported CC BY-SA 3.0 & GNU Free Documentation License (GFDL)
If you are the copyright holder of any material contained on our site and intend to remove it, please contact our site administrator for approval.
© 2016-2026 All site design rights belong to S.Y.A.