Emerging Trends in Image Processing, Computer Vision, and Pattern Recognition, 1st Edition (2015)
Part I. Image and Signal Processing
Chapter 7. XSET
Image coder based on contrast band-pass filtering
Jaime Moreno1,2; Oswaldo Morales1; Ricardo Tejeida1 1 Superior School of Mechanical and Electrical Engineers, National Polytechnic Institute of Mexico, IPN Avenue, Lindavista, Mexico City, Mexico
2 Signal, Image and Communications Department, University of Poitiers, Poitiers, France
Abstract
Noise is fatal to image compression performance because it can be both annoying for the observer and consumes excessive bandwidth when the imagery is transmitted. Some noise, in addition to some numerical redundancy, is removed during the quantization process, but in some circumstances the removed information is easily perceived by the observer, leading to annoying visual artifacts. Perceptual quantization reduces unperceivable details and thus improves both visual impression and transmission properties. In this work, we apply perceptual criteria in order to define a perceptual forward and inverse quantizer. It is based on the CBPF, a low-level computational model that reproduces color perception in the Human Visual System. Our approach consists in performing a local quantization of wavelet transform coefficients using some of the human visual system behavior properties. It is performed applying a local weight for every coefficient. The CBPF allows recovering these weights from the quantized data, which avoids the storing and transmission of these weights. We apply this perceptual quantizer to the Hi-SET coder. The comparison between JPEG2000 coder and the combination of Hi-SET with the proposed perceptual quantizer (XSET) is shown. The latter produces images with lower PSNR than the former, but they have the same or even better visual quality when measured with well-known image quality metrics such as MSSIM, UQI, or VIF, for instance. Hence, XSET obtain more compressed (i.e., lower bit-rate) images at the same perceptual image quality than JPEG2000.
Keywords
Contrast sensitivity function
Human visual system
JPEG2000
Wavelet transform
Acknowledgment
This work is supported by National Polytechnic Institute of Mexico by means of Project No. 20140096, the Academic Secretary and the Committee of Operation and Promotion of Academic Activities (COFAA), National Council of Science and Technology of Mexico by means of Project No. 204151/2013, and LABEX Σ-LIM France, Coimbra Group Scholarship Programme granted by University of Poitiers and Region of Poitou-Charentes, France.
1 Introduction
Digital image compression has been a research topic for many years and a number of image compression standards have been created for different applications. The JPEG2000 is intended to provide rate-distortion and subjective image quality performance superior to existing standards, as well as to supply functionality [1]. However, JPEG2000 does not provide the most relevant characteristics of the human visual system, since for removing information in order to compress the image mainly information theory criteria are applied. This information removal introduces artifacts to the image that are visible at high compression rates, because of many pixels with high perceptual significance have been discarded. Hence, it is necessary an advanced model that removes information according to perceptual criteria, preserving the pixels with high perceptual relevance regardless of the numerical information. The Chromatic Induction Wavelet Model presents some perceptual concepts that can be suitable for it. Both CBPF and JPEG2000 use wavelet transform. CBPF uses it in order to generate an approximation to how every pixel is perceived from a certain distance taking into account the value of its neighboring pixels. By contrast, JPEG2000 applies the perceptual criteria for all coefficients in a certain spatial frequency independently of the values of its surrounding ones. In other words, JPEG2000 performs a global transformation of wavelet coefficients, while CBPF performs a local one. CBPF attenuates the details that the human visual system is not able to perceive, enhances those that are perceptually relevant and produces an approximation of the image that the brain visual cortex perceives. At long distances, the lack of information does not produce the well-known compression artifacts, rather it is presented as a softened version, where the details with high perceptual value remain (e.g., some edges).
The block diagram of the X-SET engine for encoding and decoding is shown in Figure 1. The source data are an RGB image, which comprises three components, then a color transformation is first applied over all three components. After the color transformation, each component is decomposed with a discrete wavelet transform into a set of planes of different spatial frequencies by means of a forward wavelet transformation (9/7 analysis Filter). Then, these coefficients are forward perceptually quantized using CBPF, for reducing the precision of data in order to make them more perceptually compressible. Perceptual quantization is the only responsible that introduces imperceptible lossless distortion into the image data. Then, Hi-SET algorithm is employed for entropy encoding among quantized coefficients forming the output bit stream. The decoding process is the inverse of the encoding one. The bit stream is first entropy decoded by means of Hi-SET, perceptually dequantized, inverse discrete wavelet transformed and finally inverse color transformed, getting as a result the reconstructed image data.
![]()
FIGURE 1 General block diagram for βSET encoding and decoding.
2 Related Work: JPEG2000 Global Visual Frequency Weighting
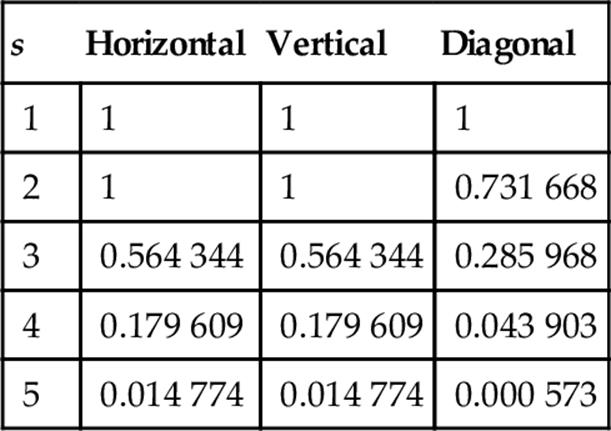
In JPEG2000, only one set of weights is chosen and applied to wavelet coefficients according to a particular viewing condition (100, 200, or 400 dpi’s) with fixed visual weighting [1, Annex J.8]. This viewing condition may be truncated depending on the stages of embedding, in other words at low bit rates, the quality of the compressed image is poor and the detailed features of the image are not available since at a relatively large distance the low frequencies are perceptually more important. Table 1 specifies a set of weights which was designed for the luminance component based on the CSF value at the mid-frequency of each spatial frequency. The viewing distance is supposed to be 4000 pixels, corresponding to 10 in. for 400 dpi print or display. The weight for LL is not included in the table, because it is always 1. Levels 1,2,…,5 denote the spatial frequency levels in low-to-high-frequency order with three spatial orientations, horizontal, vertical, and diagonal.
Table 1
Recommended JPEG2000 Frequency (s) Weighting for 400 dpi’S (s = 1 is the Lowest Frequency Wavelet Plane)
3 Image entropy encoding: XSET algorithm
3.1 Perceptual Quantization
(1) Contrast band-pass filtering: The contrast band-pass filtering (CBPF) [2] is a low-level perceptual model of the HVS. It estimates the image perceived by an observer at a distance d just by modeling the perceptual chromatic induction processes of the HVS. That is, given an image I and an observation distance d, CBPF obtains an estimation of the perceptual image Iρ that the observer perceives when observing I at distance d. CBPF is based on just three important stimulus properties: spatial frequency, spatial orientation, and surround contrast. These three properties allow unifying the chromatic assimilation and contrast phenomena, as well as some other perceptual processes such as saliency perceptual processes.
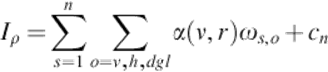
The perceptual image Iρ is recovered by weighting these ωs,o wavelet coefficients using the extended contrast sensitivity function (e-CSF). The e-CSF is an extension of the psychophysical CSF [3] considering spatial surround information (denoted by r), visual frequency (denoted by v, which is related to spatial frequency by observation distance), and observation distance (d). Perceptual image Iρ can be obtained by
 (1)
(1)
where α(ν, r) is the e-CSF weighting function that tries to reproduce some perceptual properties of the HVS. The term α(ν, r)ωs,o is considered the perceptual wavelet coefficients of image I when observed at distance d.
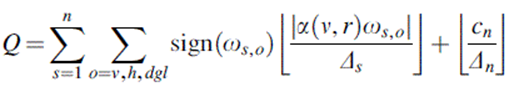
(2) Forward quantization (F-pSQ): Quantization is the only cause that introduces distortion into a compression process. Since each transform sample at the perceptual image Iρ (1) is mapped independently to a corresponding step size either Δs or Δn, thus Iρ is associated with a specific interval on the real line. Then, the perceptually quantized coefficients Q, from a known viewing distance d, are calculated as follows:
 (2)
(2)
Unlike the classical techniques of visual frequency weighting (VFW) on JPEG2000, which apply one CSF weight per subband [1, Annex J.8], perceptual quantization using CBPF (pSQ) applies one CSF weight per coefficient over all wavelet planes ωs,o. In this section, we only explain forward perceptual quantization using CBPF (F-pSQ). Thus, Equation (2) introduces perceptual criteria of the perceptual images (1) to each quantized coefficient of the dead-zone scalar quantizer [1, Annex J.8]. A normalized quantization step size Δ = 1/128 is used, namely, the range between the minimal and maximal values at Iρ is divided into 128 intervals. Finally, the perceptually quantized coefficients are entropy coded, before forming the output code stream or bitstream.
(3) Inverse quantization (I-pSQ): The proposed perceptual quantization is a generalized method, which can be applied to wavelet-transform-based image compression algorithms such as EZW, SPIHT, SPECK, or JPEG2000. In this work, we introduce both forward (F-pSQ) and inverse perceptual quantization (I-pSQ) into the Hi-SET coder [4–6]. An advantage of introducing pSQ is to maintain the embedded features not only of Hi-SET algorithm but also of any wavelet-based image coder. Thus, we call CBPF quantization + Hi-SET = CHi-SET or XSET.
Both JPEG2000 and XSET choose their VFWs according to a final viewing condition. When JPEG2000 modifies the quantization step size with a certain visual weight, it needs to explicitly specify the quantizer, which is not very suitable for embedded coding. By contrast, XSET needs neither to store the visual weights nor to necessarily specify a quantizer in order to keep its embedded coding properties.
The main challenge underlies in to recover not only a good approximation of coefficients Q but also the visual weight α(ν, r) (Equation 2) that weighted them. A recovered approximation ![]() with a certain distortion Λ is decoded from the bitstream by the entropy decoding process. The VFWs were not encoded during the entropy encoding process, since it would increase the amount of stored data. A possible solution is to embed these weights α(ν, r) into
with a certain distortion Λ is decoded from the bitstream by the entropy decoding process. The VFWs were not encoded during the entropy encoding process, since it would increase the amount of stored data. A possible solution is to embed these weights α(ν, r) into ![]() . Thus, our goal is to recover the α(ν, r) weights only using the information from the bitstream, namely, from the Forward quantized coefficients
. Thus, our goal is to recover the α(ν, r) weights only using the information from the bitstream, namely, from the Forward quantized coefficients ![]() . Thus, our goal is to recover the α(ν, r) weights only using the information from bitstream, namely, from the forward quantized coefficients.
. Thus, our goal is to recover the α(ν, r) weights only using the information from bitstream, namely, from the forward quantized coefficients.
The reduction of the dynamic range is uniformly made by the perceptual quantizer, thus the statistical properties of I are maintained in ![]() .
.
Therefore, our hypothesis is that an approximation ![]() of α(ν, r) can be recovered applying CBPF to
of α(ν, r) can be recovered applying CBPF to ![]() , with the same viewing conditions used in I. That is,
, with the same viewing conditions used in I. That is, ![]() is the recovered e-CSF. Thus, the perceptual inverse quantizer or the recovered
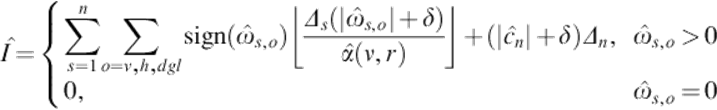
is the recovered e-CSF. Thus, the perceptual inverse quantizer or the recovered ![]() introduces perceptual criteria to inverse scalar quantizer and is given by
introduces perceptual criteria to inverse scalar quantizer and is given by
 (3)
(3)
3.2 Startup Considerations
(1) Hilbert space-filling Curve: The Hilbert curve is an iterated function, which can be represented by a parallel rewriting system, more precisely an L-system. In general, the L-system structure is a tuple of four elements:
(a) Alphabet: the variables or symbols to be replaced.
(b) Constants: set of symbols that remain fixed.
(c) Axiom or initiator: the initial state of the system.
(d) Production rules: how variables are replaced.
In order to describe the Hilbert curve alphabet let us denote the upper left, lower left, lower right, and upper right quadrants as W, X, Y, and Z, respectively, and the variables as U (up, W-X-Y-Z), L (left, W-Z-Y-X), R (right, Z-W-X-Y), and D (down, X-W-Z-Y). Where - indicates a movement from a certain quadrant to another. Each variable represents not only a trajectory followed through the quadrants, but also a set of 4m transformed pixels in m level. The structure of the proposed Hilbert Curve representation does not need fixed symbols, since it is just a linear indexing of pixels. It is appropriate to say that the original work made by David Hilbert [7], proposes an axiom with a D trajectory (Figure 2(a)), while it is proposed to start with an U trajectory (Figure 2(b)). This proposal is based on the most of the image energy is concentrated where the higher subbands with lower frequencies are, namely, at the upper-left quadrant. The first three levels are portrayed in left-to-right order by Figure 2(a) and (b).
The production rule set of the Hilbert curves is defined as follows: U is changed by the string LUUR, L by ULLD, R by DRRU and D by RDDL. In this way, high-order curves are recursively generated replacing each former level curve with the four later level curves.
The Hilbert Curve process remains in an area as long as possible before moving to the neighboring region. Hence, the correlation between pixels is maximized, which is an important image compression issue. Since the higher the correlation at the preprocessing, the more efficient the data compression.
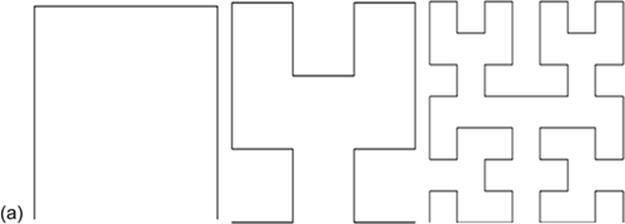
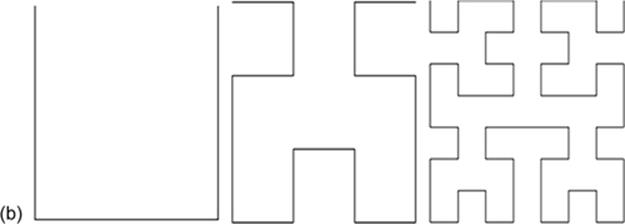
FIGURE 2 First three levels of a Hilbert Curve. (a) Axiom = D proposed by David Hilbert [7]. (b) Axiom = U employed in this chapter.
(2) Linear Indexing: A linear indexing is developed in order to store the coefficient matrix into a vector. Let us define the wavelet transform coefficient matrix as H and the interleaved resultant vector as ![]() , being 2γ × 2γ be the size of H and 4γ' the size of H, where γ, is the Hilbert curve level. Algorithm 1 generates a Hilbert mapping matrix θ with level γ, expressing each curve as four consecutive indexes.
, being 2γ × 2γ be the size of H and 4γ' the size of H, where γ, is the Hilbert curve level. Algorithm 1 generates a Hilbert mapping matrix θ with level γ, expressing each curve as four consecutive indexes.
The level γ of θ is acquired concatenating four different θ transformations in the previous level, γ − 1. Algorithm 1 generates the Hilbert mapping matrix θ, where ![]() refers a 180° rotation of β and βT is the linear algebraic transpose of β. Thus, each wavelet coefficient at H(i,j) is stored and ordered at
refers a 180° rotation of β and βT is the linear algebraic transpose of β. Thus, each wavelet coefficient at H(i,j) is stored and ordered at ![]() , being θ(i, j) the location index into
, being θ(i, j) the location index into ![]() .
.
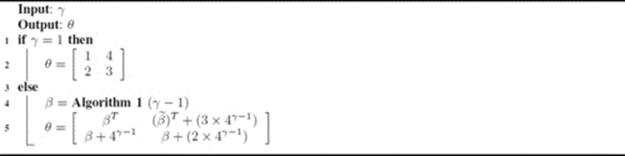
ALGORITHM 1 Function to generate Hilbert mapping matrix θ of size 2γ × 2γ.
(3) SignificanceTest: Asignificance test is defined as the trial of whether a coefficient subset achieves the predetermined significance level or threshold in order to be a significant or insignificant. It defines how these subsets are formed and what are the coefficients considered significant.
With the aim of recovering the original image at different qualities and compression ratios, it is not needed to sort and store all the coefficients ![]() but just a subset of them: the subset of significant coefficients. Those coefficients Hi such that
but just a subset of them: the subset of significant coefficients. Those coefficients Hi such that ![]() are calledsignificant otherwise they are called insignificant. The smaller the thr, the better the final image quality and the lower the compression ratio.
are calledsignificant otherwise they are called insignificant. The smaller the thr, the better the final image quality and the lower the compression ratio.
Let us define a bit-plane as the subset of coefficients S0 such that 2thr ≤ |S0| ≤ 2thr + 1. The significance of a given subset S0 among a particular bit-plane is store at ![]() and can be defined as:
and can be defined as:
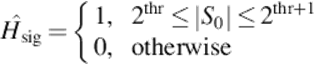 (4)
(4)
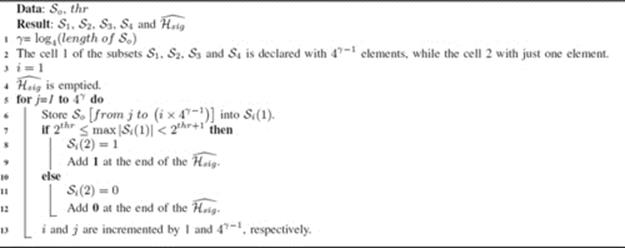
Algorithm 2 shows how a given subset S0 is divided into four equal parts (line 6) and how the significance test (lines 7-12) is performed, resulting in four subsets (S1, S2, S3, and S4) with their respective significance stored at the end of ![]() . Subsets S1, S2, S3, and S4are four 2 × 1 cell arrays. The fist cell of each array contains one of the four subsets extracted from S0(Si(1)) and the second one stores its respective significance test result (Si(2)).
. Subsets S1, S2, S3, and S4are four 2 × 1 cell arrays. The fist cell of each array contains one of the four subsets extracted from S0(Si(1)) and the second one stores its respective significance test result (Si(2)).
ALGORITHM 2 Subset significance test.
3.3 Coding Algorithm
Similar to SPIHT and SPECK [8,9], Hi-SET considers three coding passes: initialization, sorting, and refinement, which are described in the following subsections. SPIHT uses three ordered lists, namely, the list of insignificant pixels (LIP), the list of significant sets (LIS), and the list of significant pixels (LSP). The latter list represents just the individual coefficients, which are considered the most important ones. SPECK employs two of these lists, the LIS and the LSP. Whereas Hi-SET makes use of only one ordered list, the LSP.
Using a single LSP place extra load on the memory requirements for the coder, since the total number of significant pixels remains the same even if the coding process is working in insignificant branches. That is why Hi-SET employs spare lists, storing significant pixels in several sub-lists. These smaller lists have the same length than significant coefficients founded in the processed branch. With the purpose of expediting the coding process it is used not only spare lists, but also spare cell arrays, both are denoted by an prime, LSP′, H′, or ![]() , for instance.
, for instance.
(1) Initialization Pass: The first step is to define threshold thr as
![]() (5)
(5)
that is, thr is the maximum integer power of two not exceeding the maximum value found at ![]() .
.
The second step is to apply Algorithm 2 with thr and ![]() as input data, which divides
as input data, which divides ![]() into four subsets of 4γ − 1 coefficients and adds their significance bits at the end of
into four subsets of 4γ − 1 coefficients and adds their significance bits at the end of ![]() .
.
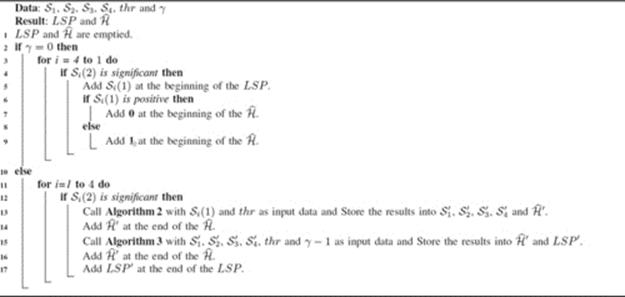
(2) Sorting Pass: Algorithm 3 shows a simplified version of the classification or sorting step of the Hi-SET Coder. The Hi-SET sorting pass exploits the recursion of fractals. If a quadtree branch is significant it moves forward until finding an individual pixel, otherwise the algorithm stops and codes the entire branch as insignificant.
Algorithm 3 is divided into two parts: Sign Coding (lines 2-9) and Branch Significance Coding (lines 11-16). The algorithm performs the Sign Coding by decomposing a given quadtree branch up to level, γ = 0, i.e., the branch is represented by only 4 coefficients with at least one of them being significant. The initial value of γ is ![]() . Only the sign of the significant coefficients is coded, 0 for positives and 1 for negatives. Also, each significant coefficient is added into a spare LSP or LSP′.
. Only the sign of the significant coefficients is coded, 0 for positives and 1 for negatives. Also, each significant coefficient is added into a spare LSP or LSP′.
The Branch Significance Coding calls Algorithm 2 in order to quarter a branch in addition to call recursively an entire sorting pass at level, γ − 1 up to reach the elemental level when, γ = 0. The Significance Test results of a current branch (obtained by the Algorithm 2) and the ones of next branches (acquired by Algorithm 3, denoted as ![]() ) are added at the end of
) are added at the end of ![]() . Also, all the significant coefficients found in previous branches (all the lists LSP′) are added at the end of the LSP. This process is repeated for all four subsets of
. Also, all the significant coefficients found in previous branches (all the lists LSP′) are added at the end of the LSP. This process is repeated for all four subsets of ![]() .
.
ALGORITHM 3 Sorting pass.
(3) Refinement Pass: At the end of ![]() , the (thr − 1)-th most significant bit of each ordered entry of the LSP, including those entries added in the last sorting pass, are added. Then, thr is decremented and another sorting pass is performed. the sorting and refinement steps are repeated up to thr = 1.
, the (thr − 1)-th most significant bit of each ordered entry of the LSP, including those entries added in the last sorting pass, are added. Then, thr is decremented and another sorting pass is performed. the sorting and refinement steps are repeated up to thr = 1.
The decoder employs the same mechanism as the encoder, since it knows the fractal applied to the original image. When the bitstream ![]() is received, by itself describes the significance of every variable of the fractal. Then with these bits, the decoder is able to reconstruct both partially and completely, the same fractal structure of the original image, refining the pixels progressively as the algorithm proceeds.
is received, by itself describes the significance of every variable of the fractal. Then with these bits, the decoder is able to reconstruct both partially and completely, the same fractal structure of the original image, refining the pixels progressively as the algorithm proceeds.
4 Experiments and results
For the sake of comparing the performance between the JPEG2000 [10] and XSET coders, both algorithms are tested according to the process depicted in Figure 3. First an XSET compression with certain viewing conditions is performed, which gives a compressed image with a particular bit-rate (bpp). Then, a JPEG2000 compression is performed with the same bit-rate. Once both algorithms recover their distorted images, they are compared with some numerical image quality estimators such as: MSSIM [11], PSNR [12], SSIM [13], VIF [14], UQI [15], and WSNR [16].
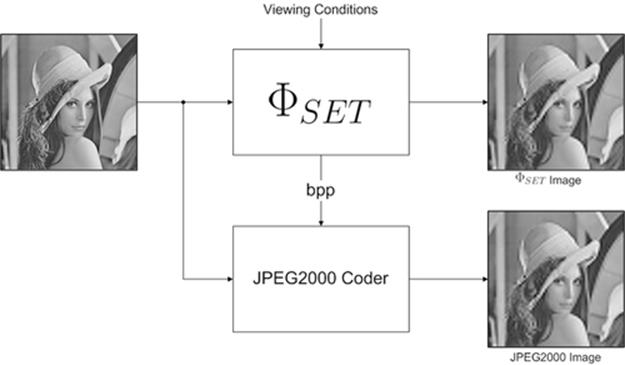
FIGURE 3 Process for comparing JPEG2000 and XSET. Given some viewing conditions a XSET compression is performed obtaining a particular bit-rate. Thus, a JPEG2000 compression is performed with such a bit-rate.
This experiment is performed across the CMU [17] and IVC [18] Image Databases. Image quality estimations are assessed by the six metrics mentioned before.
Figures 4 and 5 show the perceptual quality, estimated by Figure 4(a) MSSIM, Figure 4(c) SSIM, Figure 5(a) UQI, Figure 5(b)VIF and Figure 5(c) WSNR, in addition to the objective quality Figure 4(b) PSNR, of the recovered color images both for JPEG2000 (Blue function; dark gray in print versions) and XSET (Green function; light gray in print versions) as a function of their compression rate. For this experiment, we employthe CMU Image Database and the Kakadu implementation for JPEG2000 compression [19]. On the average, a color image compressed at 1.0 bpp (1:24 ratio, stored in 32 kB) by JPEG2000 coder has MSSIM = 0.9424, SSIM = 0.8149, UQI = 0.5141, VIF = 0.2823 and WSNR = 29.2 of perceptual image quality, and PSNR = 30.11 of objective image quality, while by XSET has MSSIM = 0.9780, SSIM = 0.8758, UQI = 0.6249, VIF = 0.4387, WSNR = 35.41 and PSNR = 31.84. In Figure 6, we can see these differences when images (a-b) Lenna, (c-d) Girl2, and (e-f) Tiffany are compressed at 0.92, 0.54, and 0.93 bpp, respectively, by JPEG2000 and XSET. For example, for these three images, the average difference of MSSIM is 0.0321 in favor of XSET. Therefore, for this image database, XSET has clearly improvement of visual quality than JPEG2000.
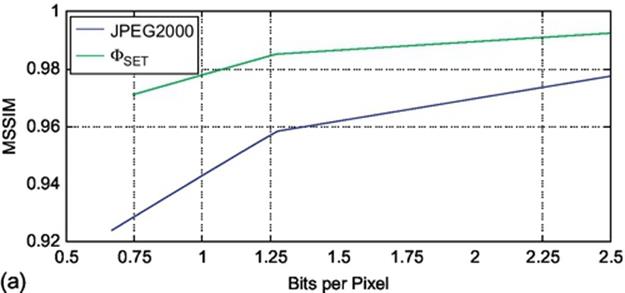
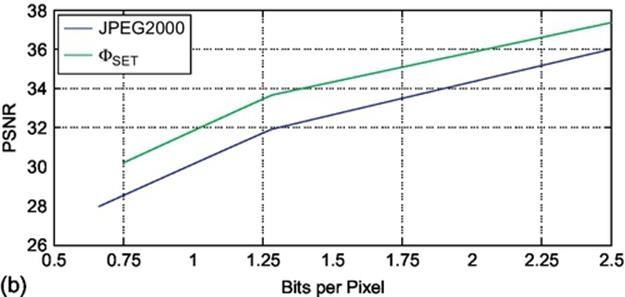
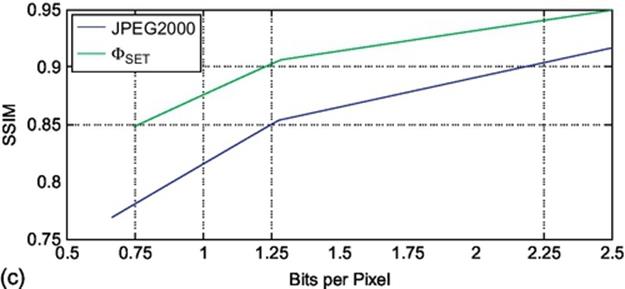
FIGURE 4 Comparison between XSET (green functions; light gray in print versions) and JPEG2000 (blue functions; dark gray in print versions) image coders. Compression rate versus image quality assessed by (a) MSSIM, (b) PSNR and (c) in the CMU image database.
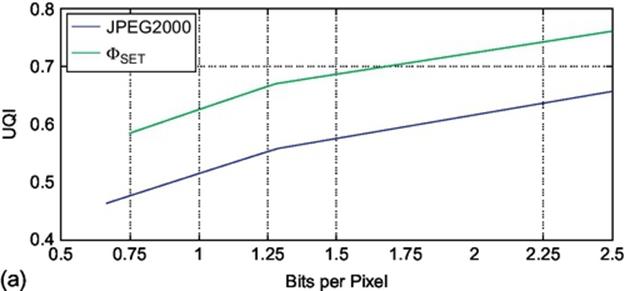
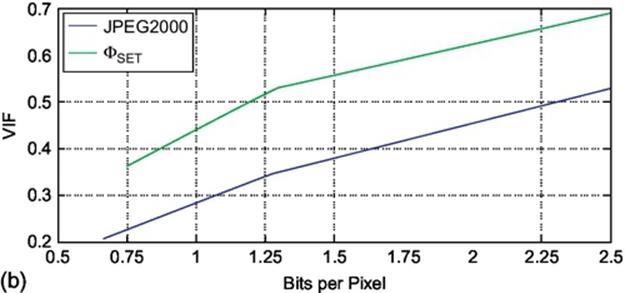

FIGURE 5 Comparison between XSET (green functions; light gray in print versions) and JPEG2000 (blue functions; dark gray in print versions) image coders. Compression rate versus image quality assessed by (a) UQI, (b) VIF, and (c) WSNR in the CMU image database.
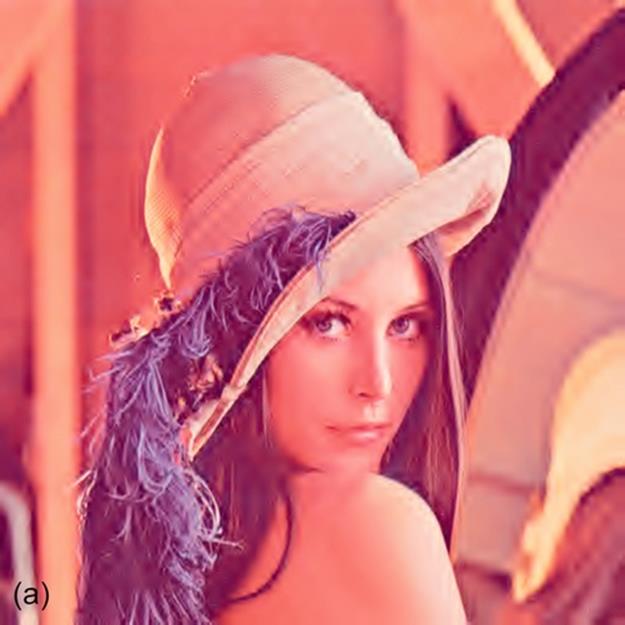
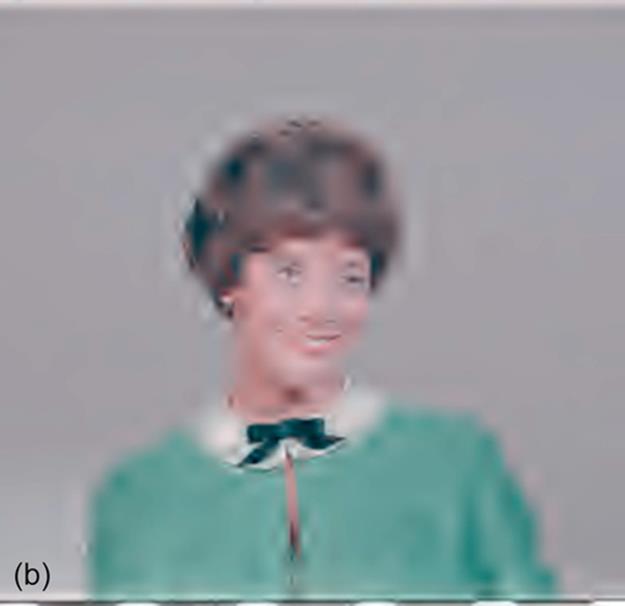
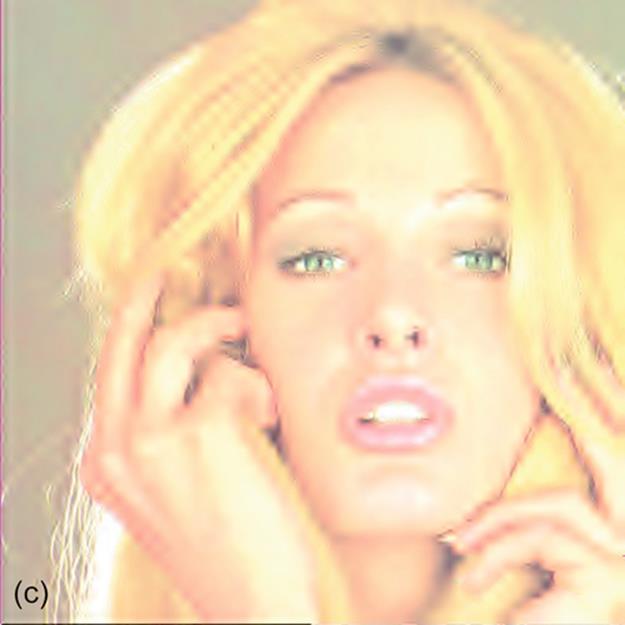

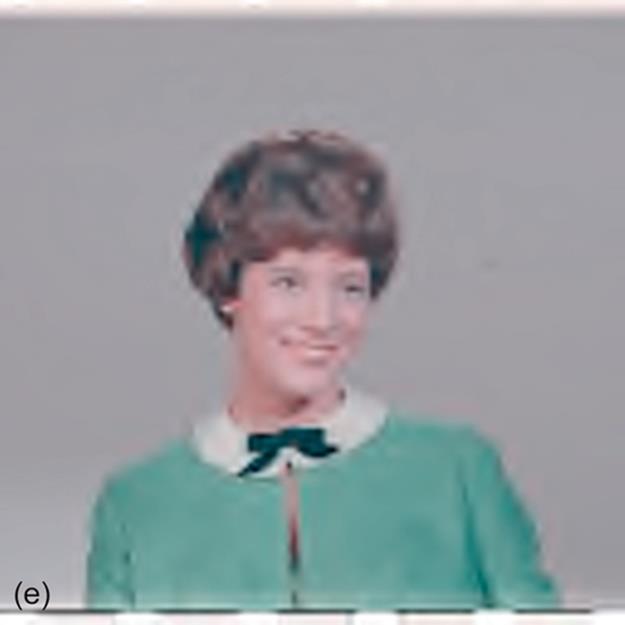

FIGURE 6 Example of recovered color images Lenna, Girl2, and Tiffany of the CMU image database compressed at (a and d) 0.92 bpp, (b and e) 0.54 bpp, and (c and f) 0.93 bpp, respectively. JPEG2000 Images are compressed using Table 1 and s = 3. (a) JPEG2000, MSSIM = 0.9595; (b) JPEG2000, MSSIM = 0.9742; (c) JPEG2000, MSSIM = 0.9274; (d) XSET, MSSIM = 0.9829; (e) XSET, MSSIM = 0.9948; and (f) XSET, MSSIM = 0.9798.
5 Conclusions
The main goal of this chapter is to introduce perceptual criteria on the image compression process. These perceptual criteria are used to identify and to remove non-perceptual information of an image. These aspects are used to propose a perceptual image compression system. Additionally, the coder based on Hilbert scanning (Hi-SET) is also presented.
The Hi-SET coder, presented in Section 3, is based on Hilbert scanning of embedded quadTrees. It has low computational complexity and some important properties of modern image coders such as embedding and progressive transmission. This is achieved by using the principle of partial sorting by magnitude when a sequence of thresholds decreases. The desired compression rate can be controlled just by chunking the stream at the desired file length. When compared to other algorithms that use Hilbert scanning for pixel ordering, Hi-SET improves image quality by around 6.20 dB. Hi-SET achieves higher compression rates than JPEG2000 coder not only for high and medium resolution images but also for low resolution ones where it is difficult to find redundancies among spatial frequencies. Table 2 summarizes the average improvements when compressing the TID2008 Image Database [20].
Table 2
Average PSNR(DB) Improvement of Hi-SET in Front of JPEG2000 for TID2008 Image Database
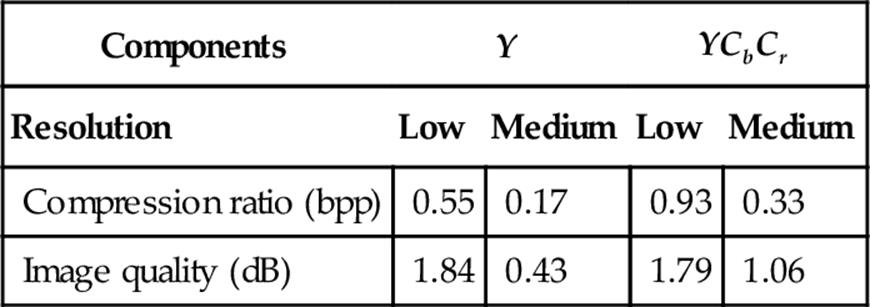
The Hi-SET coder improves the image quality of the JPEG2000 coder around PSNR = 1.16 dB for gray-scale images and 1.43 dB for color ones. Furthermore, it saves around 0.245 bpp for high-resolution gray-scale images. Thus, the results across the CMU image database resulted Hi-SET improved the results of JPEG2000 not only objectively but also by metrics like MSSIM, VIF, or WPSNR, which are perceptual indicators.
This is why in Section 3.1 Forward (F-pSQ) and Inverse (I-pSQ) perceptual quantizer using CBPF are defined. When F-pSQ and I-pSQ are incorporated to Hi-SET, a perceptual image compression system XSET is proposed. In order to measure the effectiveness of the perceptual quantization, a performance analysis is done using the most important image quality assessments such as PSNR, MSSIM, VIF, or WSNR. In addition, when both forward and inverse perceptual quantization are applied into Hi-SET, namely, using XSET, it significatively improves the results regarding the JPEG2000 compression.
References
[1] Boliek M, Christopoulos C, Majani E. Information Technology: JPEG2000 Image Coding System, JPEG 2000 Part I final committee draft version 1.0 ed., ISO/IEC JTC1/SC29 WG1, JPEG 2000; April 2000.
[2] Otazu X, Párraga C, Vanrell M. Toward a unified chromatic induction model. J Vis. 2010;10(12):1–24 No. 6.
[3] Mullen K. The contrast sensitivity of human color vision to red-green and blue-yellow chromatic gratings. J Physiol. 1985;359:381–400.
[4] Moreno J, Otazu X. Image coder based on Hilbert Scanning of Embedded quadTrees. In: IEEE Data compression conference; 2011.
[5] Moreno J, Otazu X. Image coder based on Hilbert Scanning of Embedded QuadTrees. 470 Data Compression Conference (DCC). 2011;470:29–31 Mar.
[6] Moreno J, Otazu X. Image coder based on Hilbert Scaning of Embedded quadTrees: an introduction of Hi-SET coder. In: IEEE international conference on multimedia and expo, July 2011; 2011.
[7] Hilbert D. Über die stetige Abbildung einer Linie auf ein Flächenstück. Math Ann. 1891;38(3):459–460.
[8] Pearlman WA, Said A. Image wavelet coding systems: part II of set partition coding and image wavelet coding systems. Found Trends Sig Process. 2008;2(3):181–246.
[9] Pearlman WA, Said A. Set partition coding: part I of set partition coding and image wavelet coding systems. Found Trends Sig Process. 2008;2(2):95–180.
[10] Taubman DS, Marcellin MW. JPEG2000: image compression fundamentals, standards and practice. Boston, Dordrecht. London: Kluwer Academic Publishers; 2002.079237519X.
[11] Wang Z, Simoncelli E, Bovik A. Multiscale structural similarity for image quality assessment. 1398–1402. Conference record of the thirty-seventh asilomar conference on signals, systems and computers. 2003;2.
[12] Huynh-Thu Q, Ghanbari M. Scope of validity of PSNR in image/video quality assessment. Electron Lett. 2008;44(13):800–801.
[13] Sheikh H, Bovik A. Image information and visual quality. IEEE Trans Image Process. 2006;15(2):430–444.
[14] Wang Z, Bovik A, Sheikh H, Simoncelli E. Image quality assessment: from error visibility to structural similarity. IEEE Trans Image Process. 2004;13(4):600–612.
[15] Wang Z, Bovik A. A universal image quality index. IEEE Sig Process Lett. 2002;9:81–84.
[16] Mitsa T, Varkur K. Evaluation of contrast sensitivity functions for formulation of quality measures incorporated in halftoning algorithms. 301–304. IEEE international conference on acoustics, speech and signal processing. 1993;vol. 5.
[17] S.I.P.I. of the University of Southern California. The USC-SIPI image database. Signal and Image Processing Institute of the University of Southern California. [Online]. Available: http://sipi.usc.edu/database/; 1997.
[18] le Callet P, Autrusseau F. Subjective quality assessment IRCCyN/IVC database. http://www.irccyn.ec-nantes.fr/ivcdb/; 2005.
[19] Taubman D. Kakadu software. [Online]. Available: http://www.kakadusoftware.com/; July 2010.
[20] Ponomarenko N, Lukin V, Zelensky A, Egiazarian K, Carli M, Battisti F. TID2008 -a database for evaluation of fullreference visual quality assessment metrics. Adv Modern Radioelect. 2009;10:30–45.
All materials on the site are licensed Creative Commons Attribution-Sharealike 3.0 Unported CC BY-SA 3.0 & GNU Free Documentation License (GFDL)
If you are the copyright holder of any material contained on our site and intend to remove it, please contact our site administrator for approval.
© 2016-2026 All site design rights belong to S.Y.A.