Geocomputation: A Practical Primer (2015)
PART V
ENABLING INTERACTIONS
18
PUBLIC PARTICIPATION IN GEOCOMPUTATION TO SUPPORT SPATIAL DECISION-MAKING
Richard Kingston
Introduction
The extent to which computational modelling has influenced and been a part of decision-making in geography and urban planning has a long and distinguished history, as outlined by Geertman and Stillwell (2009) and Batty and Brail (2008) amongst others. With more recent advances in visualisation techniques and the ability of computers to manipulate, process and analyse increasingly complex and growing amounts of spatially referenced data, the application of geocomputation to support decision-making within an online environment continues to grow. GIS as the primary visualisation tool over past decade has matured into a tool that can be increasingly utilised by a wider range of users. Ever since the criticisms of GIS in the mid-1990s (cf. Pickles, 1995), GIS has moved from specialised to lay use, alongside a growth in the ability of a broader range of users to use and understand computerised mapping. While 20 years ago it may not have been envisaged that there could be public participation in geocomputation, today we can build, provide models, and allow access via easy to understand user interfaces that to some extent are starting to replicate systems that were only available to advanced users in the past. With the ever-increasing availability of spatial data there has been a growing demand for translation into usable information that supports many aspects of spatial decision-making. This chapter provides an overview of some of those methods used, as well as two illustrative examples of online geocomputational mapping tools that support public participation in environmental planning. The chapter concludes with a look towards the future and the relationship between geocomputation, public participation and the ways in which modelling within online environments allows for improved access to geocomputational models.
Participation and decision support
While there are growing numbers of examples illustrating the use of geocomputation to support public participation in urban planning, many still remain one-off examples, as illustrated in the use of planning support systems (PSSs). Vonk et al. (2005) recognised this problem some time ago when they addressed some of the bottlenecks for implementation, and still today there are very few known cases where computational modelling is used to support routine decision-making in urban planning on a day-to-day basis. Arguably, a major reason for this shortfall is the lack of skills within the planning profession to utilise the appropriate techniques, and the simple fact that much of the technology tends to be developed as one-off bespoke software. As Singleton (2014b) has recently argued, the need for computer programming to be an integral component of geography degrees begs the question whether this should be the case for planning. Well, perhaps as a specialist option so students at least have some understanding of the methods and techniques that planners could draw upon in practice. As Klosterman (2008: 174) argues, ‘we are witnessing a second revolution of computer use in planning’ where planners will need to know less about specific programs to support their decision-making and instead ‘future planners will not have to develop GIS-based tools and models from scratch, but will obtain them from the web and link them together to perform particular tasks’ (p. 175). It is now very easy to set up map-based public participation tools to support public engagement in decision-making. With a Google account, combined with its mapping application programming interface (API) and some knowledge of its Fusion tables, pretty much anyone can quickly set up an interactive map with absolutely no programming experience. Furthermore, customisable tools such as CartoDB (http://cartodb.com) make such a task even easier.
The notion of a PSS was coined by Britton Harris in the late 1980s when he highlighted concerns about the need for strategic support of routine planning tasks. Harris (1989) gave planners new insights into the uses and design of (geo)computation models to support strategic plan making and development of management associated with specific planning tasks. The term ‘planning support system’ in this context refers to the combined use of GIS, spatial decision support systems, spreadsheets, databases and other ICT-based tools. Over the past 15 years these have increasingly been made available over the internet as PSSs have essentially grown into online computer-based systems aimed at integrating a vast array of tasks to support the work of planners, associated decision-makers and increasingly the public (Harris and Batty, 1993; Kingston et al., 2000; Kingston, 2007). At the heart of many of the tools to support the decision-making process are geocomputational models and methods. These can be for a broad range of application areas, for example optimising site location for large-scale retailers, or modelling the flood risk potential of a new residential housing development using techniques such as location allocation and spatial interaction models (Chapters 11 and 13). The focus in this chapter, though, is to highlight how we can provide public access to geocomputational methods that support decision-making, particularly when making decisions about the environment around us.
The involvement of the public in decision-making has a long tradition in planning going back to the 1960s, coincidentally around the same time as when computation was introduced into the profession. Spatial planning systems across the world influence the places and spaces where people work and live. Planning is deemed to operate in the public interest in order to ensure that development and the use of land result in more sustainable communities, but this is a complex task given the diverse nature of public, private and community interests affected by and involved in the planning system and process. Whether it be for ensuring development occurs where communities need it, or for the protection and enhancement of the natural and historic environment and the countryside, planning affects us all. During the 1990s the notion of collaborative planning (Healey, 2005) began to emerge together with the suggestion that to understand participation in public policy it is necessary to examine the broader governance strategies that institutions may utilise to achieve different levels of engagement. These can be categorised in to three such strategies. First, top-down strategies start and finish with the government agencies that plan such schemes, and the local authorities that implement them. Such initiatives occupy the therapeutic and manipulative levels of Arnstein’s (1969) ladder, and at best there can be an element of negotiation. Second, limited dialogue strategies involve a stronger commitment to a two-way communication process. The method and policy framework are set by national and local public bodies, but with dialogue that can lead to substantial change in decisions and thinking. Finally, bottom-up strategies are distinguished by their commitment to open discussion and the active encouragement of excluded or marginalised groups to become involved. In more recent times the use of ICTs to empower local communities has begun to take hold through the use of online participatory GIS to complement well-established techniques. It is this approach that is the focus of the remainder of this chapter. To what extent can online geocomputational tools support public engagement in spatial planning?
First, though, it is worth noting that the use of GIS and computational modelling to support spatial planning has witnessed a patchwork of success globally for a number of reasons. Often the success or failure of the implementation of geocomputational tools in urban planning is predicated not just on the institutional factors of GIS adoption (Budic and Godshalk, 1994), but on the underlying ‘system’ within which planning operates. Globally, planning systems tend to adhere to one of two types of system referred to as ‘regulatory’ (e.g. USA, Canada, France, Germany, Spain) or ‘discretionary’ (e.g. England, Scotland, Wales, Northern Ireland), with some countries using a hybrid of the two. It is suggested that the differing natures of these two types of system mean that the regulatory approach lends itself to being more amenable to utilising geocomputational modelling than the discretionary system, and hence geocomputational support for planning is more widespread in those countries utilising the former approach. Nevertheless it still requires planners in practice not necessarily to learn new programming skills, but to think about how they organise themselves and how they communicate their plans and proposals to their stakeholders. One of the key findings of a recent research project, outlined in the next section, was that GIS began to help in the breaking down of ‘silos’ between departments in order to gather evidence of the need to act on climate change adaptation. It brought together different people in different agencies who had ‘ownership’ of different types of data that were needed to support the planning policy-making process. Without this collaboration the problems they are facing would not be solved.
In the next section two examples are given showing how different stakeholders make use of web-based spatial data analysis to support decision-making. The first is from an EU-funded project to develop climate change adaptation action plans across Europe, and the second is a prototype system to support the connection of decentralised energy production to the UK’s National Grid network.
Participation in understanding local climate change impacts
Climate change is a problem globally and within a European context, and being able to understand that Europe’s climate is changing is important not just for decision-makers, but also the public at large. Recent extreme weather events in North America, Australia and parts of Europe illustrate how ill prepared our built and natural environment is. In 2012 we witnessed a record warm winter in the US Midwest, followed by a record cold winter in 2013; record heat in Australia, when normally ocean currents would have cooled the land; and drought in the UK, followed by floods in 2014. The two Spot 6 satellite images in Figure 18.1 show the River Parrett near Bridgewater, Somerset in south-west England on 8 June 2013 and again on 11 February 2014, illustrating the extent of the flooding.
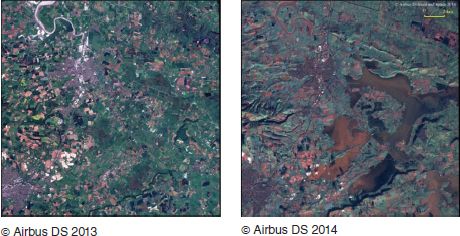
FIGURE 18.1 River Parrett before and during flooding (http://airbusdefenceandspace.com/satellite-images-reveal-uk-flood-impact/)
Building on research originally carried out at the University of Manchester, the GRaBS project (http://www.ppgis.manchester.ac.uk/grabs/) developed an innovative, cost-effective and user-friendly risk and vulnerability assessment tool to aid the strategic planning of climate change adaptation responses in towns, cities and regions across Europe. The main aim of the GRaBS Assessment Tool was to assess current vulnerability of urban areas to climate change impacts, with an additional assessment of relative patterns of spatial risk where suitable data were available. The tool is based on a GIS and has been built on top of the Google Maps interface using a range of spatial data for the whole of Europe, together with specific spatial data from project partners – in total over 325 different map layers. From the start of the project there was a desire to develop a tool that would be easily accessible to a wide range of stakeholders involved in climate change adaptation, including the general public. With 11 partners responsible for developing adaptation action plans, creating a tool that would meet the needs of all project partners has been quite a challenge.
The GRaBS project looked in detail at the potential impacts of climate change across the European continent. This understanding helped to provide a context for the assessment tool from the perspective of vulnerability to climate change in the partner cities and regions. Two key issues are as follows:
• Temperatures are projected to increase over Europe at levels higher than the global average. Increases of 2–6°C are expected, depending on the greenhouse gas emissions scenario considered. The north is projected to warm at a slightly faster pace than the south.
• Precipitation patterns are expected to change significantly. Recent seasonal and geographic changes in rainfall are projected to intensify. Northern Europe has become wetter over the last century, a trend that is likely to continue, and particularly over the winter. However, southern Europe has become drier, with further reductions in precipitation expected. Increases in precipitation extremes are also likely.
These changes in temperature and precipitation will generate impacts including:
• Flooding events are expected to increase in frequency and magnitude, especially over northern and western Europe during the winter months where river discharges are projected to increase. Extreme rainfall events will increase the threat of flash floods across most of Europe.
• Lower rainfall and associated river discharge/aquifer recharge will increase drought risk, particularly over southern and eastern Europe. The threat of longer dry spells is lower in northern Europe.
• Central and eastern Europe in particular are likely to experience summer heatwaves of increasing intensity and duration. By 2050, the Mediterranean could have an extra month with days over 25°C.
• During the 1990s, the number of extreme weather events (floods, storms, droughts) doubled. This increase in frequency has persisted into the twenty-first century and is projected to continue to do so. It is extreme events, not gradual changes in climate, that cause the most significant impacts on human and natural systems.
• Sea-level rise is a key threat to coastal communities and ecosystems. Globally, increases of 18–59cm are projected, with regional variations also likely. The prospect of more significant increases cannot be ruled out, for example relating to the melting of the polar ice caps.
• Climate change is expected to bring with it changes in wind speeds, with significant regional variation. Increases of 10–15% in average and extreme wind speeds are possible over northern Europe, with a 10–15% decline in speeds in southern Europe. An increase in storminess over western Europe during the winter months is also possible.
(Adapted from European Environment Agency (EEA), 2008)
At the time of the project, the most up-to-date information on recent and projected future change to Europe’s climate could be found in the European Environment Agency publication Impacts of Europe’s Changing Climate – 2008 Indicator-Based Assessment (EEA, 2008). With this overview setting the context for the project, and feeding into the requirements of the tool, individual partners set about assessing their own climate impact priorities and deciding what their own priorities were within their own municipalities.
The tool is based on, but further develops, the findings of the University of Manchester’s Adaptation Strategies for Climate Change in the Urban Environment (ASCCUE) project (Lindley et al., 2007); and development followed the principles of an online public participation GIS (Kingston et al., 2000). Here the main aim was to develop web-based GIS to enhance public involvement and participation in environmental planning and decision-making. These systems are referred to as PPGIS and are a form of PSS. The main objective is based on the belief that by providing all stakeholders, including citizens, with access to information and data in the form of maps and visualisations they can make better-informed decisions about the natural and built environment around them. The nature of the GRaBS project with a pan-European user base meant that the tool had to be built using a common map base for all partners. Using Google Map’s API, which is ‘free’, generic, highly customisable, and, probably most importantly from a user perspective, very simple to use and navigate, meant that we were able to build a single generic tool for all partners.
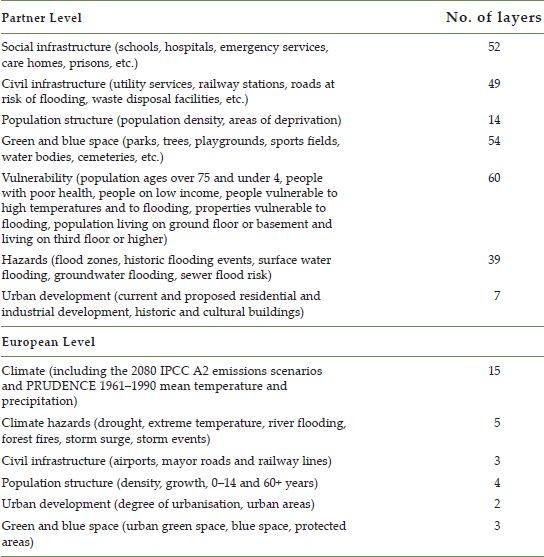
At the start of the project it was difficult to anticipate the amount and complexity of the data layers that would be used in the tool. Indeed we involved all partners in assessing what were the key climate impact factors and climate-related issues in their areas so that the tool was fit for purpose in each of the municipalities and regions across Europe. Thus the project team embarked on a collaborative process of tool development with all the partners in order to shape the exact form and function of the final tool (see Figure 18.2). Through the use of a user needs and requirements analysis (UNRA), partners were asked to identify the types of functionality and their anticipated requirements of the tool; what their climate change impact priorities were; a series of questions on the availability of data to input into the assessment tool; and the origin and source of the spatial data alongside any access rights issues on the data provided. There are currently 325 different spatial layers in the tool, with partner level data ranging from 7 to 50 layers (see Table 18.1). This reflects the extent to which different municipalities have been collecting relevant data and their ability to work across departmental boundaries to obtain necessary data. In the UK, the Cabinet Office’s Policy Action Team 17 and 18 reports (Department of the Environment, Transport and the Regions, 2000; Office for National Statistics, 2000) have helped UK local authorities to put in place robust systems for the collection and storing of spatial data. At the EU level there are 32 spatial layers available.
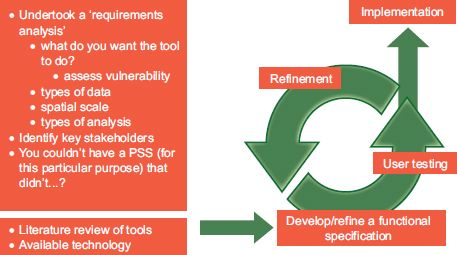
FIGURE 18.2 Assessment tool development
TABLE 18.1 Data types
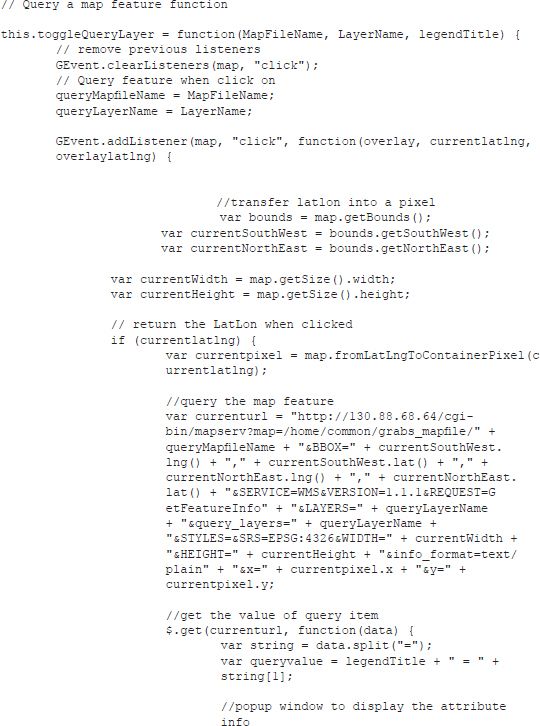
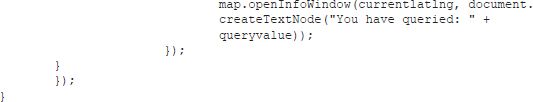
To complement the UNRA, a review of climate change vulnerability, risk and adaptation assessment tools was undertaken (Lindley, 2009). This review concluded that a wide range of online tools are available for risk assessment and risk management, but that there was debate surrounding what comprises such a tool in relation to climate adaptation. The review also identified that there was no existing tool specifically for vulnerability assessment, and there was a scarcity of tools specifically focused on cities and urban areas. This was further enhanced by a review of the available technology, and at the time of development, only the Google Maps platform provided an API, allowing software developers to customise and build other tools on top of a common map base (see sample code below for an example of how to query a map feature). Given the popularity and familiarity of the Google Maps interface, this was deemed a suitable platform to build the tool on, although it could be supplemented for a range of alternative solutions. The combination of the above aspects of the tools development revealed that the tool needed to:
• map risk and vulnerability to climate change hazards and show spatial distributions;
• allow map overlay to enable identification of priority areas for adaptation actions;
• identify relative patterns of risk in urban environments;
• show the severity of the impacts;
• generate a list of climate hazards and receptors;
• inform preparation of planning documents to enable accounting of climate change impacts on people, property, assets and infrastructure;
• be fully accessible to all stakeholders online, including residents, developers, local business, utilities and councils.
The tool was built in a single technical environment that could be used seamlessly across Europe – both during the project and after its lifetime. The project budget and timetable did not allow for 12 individual partner approaches to the underlying technical development of the tool, but was devised to enable the tool to provide a common framework for use by each of the partners and in its application across Europe. This also provided flexibility for other municipalities to implement the tool with their own data. A pilot version of the tool was tested in March 2010 by three of the partners. Most of the initial user testing focused on the design of the interface in terms of the ‘look and feel’ and this fed into an initial redesign of the tools interface.
Sample extract of JavaScript for the Google Maps API version 2
This function allows the user to click on a map feature and display the attribute information in a pop-up bubble.
The tool was then introduced to all other partners at a workshop in Graz, Austria. This part of the testing made use of the concept of a ‘storyline’ where all partners followed a scenario, presenting a realistic climate change impact situation demanding action from decision-makers. This included: the risk of flooding in the London Borough of Sutton; protection of critical infrastructure from climate impacts in Styria, Austria; and risk of high temperatures in Catania, Sicily. These storylines contained step-by-step instructions on how to use the tool, its functionality, data and information within the tool, and how this could be used to support their applications. Partners then filled in a questionnaire to provide further feedback on the tool’s menu system, its functionality and data display capabilities. Being present at the workshop to observe the partners using the tool also provided valuable feedback which fed into further improvements.
The feedback from the Graz workshop provided over 60 specific comments on ways the tool could be improved, and this approach formed an important part of the methodology of engaging the project partners in the development and refinement of the tool. The majority of comments were related to the tool’s interface rather than fundamental problems with the underlying approach. This further supported the design process adopted in the early stages of the tools development (Cavan and Kingston, 2012).
At the start of the GRaBS project there was some scepticism amongst many of the partners over the usefulness of a web-based tool to support climate change adaptation. Following a defined methodology of collaborative development with all the partners and extensive user testing, the application of the Assessment Tool by partners was implemented (see Figure 18.2). Users of the tool reported:
It has been used internally by officers, already familiar with climate related risks, to help inform strategy work that is currently underway. In particular, it has been used to test the validity of assumptions about areas of the city that were believed to experience problems.
This supports the case for using the tool to aid strategic decision-making, and in supporting the development of adaptation action plans by all partners. From the outset of the project it was envisaged that the tool would be very useful in supporting stakeholder engagement:
We have included the tool as an activity to be used with community groups in the training material we have developed. At present, this training material includes a reference to the tool which directs users to the above web address; we intend to add further guidance to this web address to help community practitioners in using the tool with their community groups.
This aspect of the tool interacts closely with a further aim of the GRaBS project: to improve stakeholder and community understanding and involvement in planning, delivering and managing green infrastructure in new and existing urban mixed use development, and based upon positive community involvement techniques. For the next partner, a lack of access to relevant data in relation to climate change vulnerability has been a pertinent issue, and part of the tools job has been to identify the gaps in necessary data as much as it is to support adaptation responses.
Ease of use is the main positive [aspect] of the system and awareness raising may be the most important use. The general lack of data on our behalf grabbed the attention of the attendees.
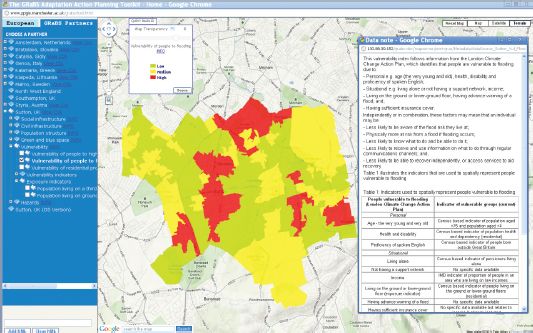
FIGURE 18.3 Final interface
While we did manage to build the tool,1 the final stages of the project opened up more questions. Now that some of the partners were demonstrating the tool to their colleagues and wider stakeholder groups, further issues were raised relating to how the tool would be sustained in the future. One partner highlighted that ‘it would be useful to have a tool that individual authorities could be fully in control of’. The tool is hosted as an open source project at the University of Manchester and is available for use in other local authorities by changing the spatial data and associated metadata – although this required knowledge of the Google Maps API and JavaScript programming. Further work in the future will, however, investigate how the tool could be easily updated and edited by non-specialists so as to keep pace with changing knowledge, updates of the underlying data and applications within alternative contexts. Others raised questions in relation to apparent missing data that were not identified at the time of the UNRA, showing that not knowing who to ‘talk to’ within your own municipality and partner organisations can leave gaps in the knowledge base. Other issues raised related to the lack of climate modelling capabilities within the tool – an extremely tricky nut to crack in its own right, and even more so with a web-based tool. Since the tool was developed in 2011, improvements in web-mapping services mean that it is now possible to access an increasing amount of spatial data directly from source. For example, the Environment Agency in England provides its flooding data via web services, and the European Environment Agency has a data clearing house (http://www.eea.europa.eu/data-and-maps/).
Finally, the process of developing the tool has been valuable in terms of partners building bridges between departments during data collection and bringing together different datasets. A key finding of the project has been the need to break down silos between departments in order to gather evidence of the need to act on adaptation. While the tool in its current form could only deal with current vulnerability to climate change, it helps to improve awareness amongst decision-makers of what the issues are within their locality, and stimulates conversations around resources required to act. It also highlights the need for a common approach throughout Europe on identifying and collecting datasets that enable successful spatial planning for adaptation to climate change. This also has cost benefits – a key consideration within the current financial climate.
Decentralised energy production – siting and connection
Traditionally electrical power networks have been designed as passive systems where there is generally no intervention required under normal operating circumstances. Electrical demand (load) comes from population and business centres, while electrical supply (generation) has always come from centralised generating power stations, with the flow of electricity largely one-way. Over recent years there has been an acceleration of the number of low-carbon technologies that can generate and connect onto the electrical network. However, one problem that this creates relates to the fact that the electricity networks in many countries were not originally designed for such scenarios, and electrical distribution network operators increasingly need to identify where there may be capacity problems and manage them accordingly.
Electrical networks typically have different parts of the network with different capacities both in terms of the substations and the cables between them. The cables can be under or above ground. When new decentralised energy producers wish to connect to the network they need to establish if the current network can cope with the extra energy being added to the network. If not, the next step is to assess what needs to be done to ‘balance’ supply and demand without necessarily having to ‘reinforce’ the network (i.e. increase capacity within the substations and cables) as this is very expensive.
As we attempt to move towards a less carbon-intensive environment there is a continued appetite to connect renewable generation. However, some connections cannot be progressed without significant reinforcement on account of limitations in the existing network. Network reinforcement is both a costly and time-consuming solution. Predictions suggest that there could be over 1.5 million fuel cell electric vehicles (FCEVs) powered by hydrogen in the UK by 2030, by which date 51% of the required hydrogen will be produced by electrolysers (UK H2 Mobility, 2014). Assuming the above, and that FCEV take-up is consistent with existing cars, this would add 355MW of demand to the electrical network in Scotland alone. Energy companies in Scotland are therefore considering the implications of the installation of electrolysers on the electrical network in support of the hydrogen economy initiatives from the government. Electrolysers could therefore offer significant benefits by providing grid-balancing services to enable more renewable generation where the existing network is constrained. This could allow energy companies to provide cheaper and quicker connections of distributed generation, rather than providing connections requiring more traditional reinforcement as outlined above. In addition, there are the implications for energy providers of large demand, such as electrolysers, and generation being connected in constrained network environments, and particularly in urban environments where demand is high.
One viable solution to this problem is to apply geocomputational techniques to these problems with the potential to identify situations where the supply and demand conundrum can be balanced effectively. Such an approach also requires a range of stakeholders to assess the problem, not just the energy companies. The local authority, land owner and the individual owner of the decentralised generation facility also need to know if they will have a problem with connecting to the network. Our solution here has been to provide a publicly accessible online mapping tool that undertakes geocomputational modelling of new generation and demand scenarios on the fly. Thus, users can test different scenarios and combine these with a range of spatial environmental constraint variables that may inhibit the location of such supply and demand infrastructure. Figure 18.4 shows the user interface with the electrical network showing balanced supply (green traffic lights), lack of capacity (purple traffic light) and close to critical (orange traffic light). The user can then turn on/off a range of environmental constraints; in this case the orange circles are 500m buffers around schools.
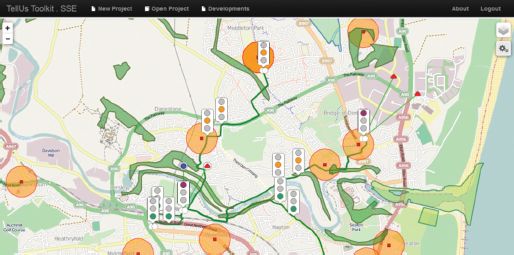
FIGURE 18.4 Optimising supply and demand with environmental factors
Source: http://www.tellus-toolkit.com/video.html
By selecting a substation or power line a user can increase or decrease supply or demand on the network until they have balanced the network (i.e. changed the traffic light colour from purple or orange to green). This approach allows energy providers to move from a static electrical model based approach for connecting low-carbon technologies, to a dynamic geospatial approach by identifying where there is an opportunity to deploy what is called an active network management scheme on the network. In addition, the geospatial approach, as opposed to a traditional schematic electrical network approach, allows for a set of spatial constraint maps such as flooding, telecommunications availability, environmental or archaeological factors. This enables improved engagement with stakeholders by providing indicative information on network availability and connection costs. By offering stakeholders a service allowing them to register a proposed scheme, they can geographically begin to look at best-value combined solutions (i.e. where we can control new generation and flexible demand for a lower cost and quicker connection).
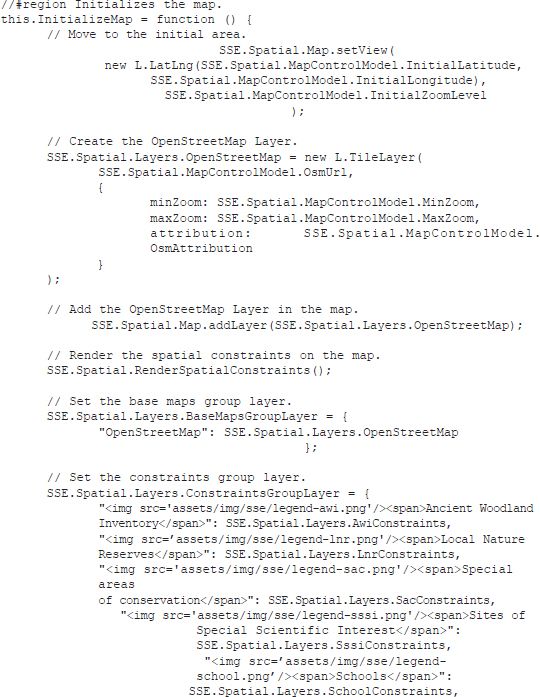
Sample extract of the Leaflet open source JavaScript Library
This function sets up OpenStreetMap as the base map and creates a legend with a series of spatial constrain maps.
This approach can inform the user of the best sites for locating facilities that add generation or demand onto the network. Such an approach allows the user to apply a method and create a model to identify limitations on the electrical distribution network, and enables the uploading and analysis of the impact of planned additions to the network in an interactive manner. This geocomputational approach allows the user to apply potential solutions to the limitations on the electrical distribution network by using an online GIS environment; and to apply different factors and constraints that can be manipulated in an interactive manner using the online mapping interface. It allows the user to add (remove) of a range of site characteristics and contextual data to (from) the map – for example, flood maps, proximity to schools as appropriate. Such an approach gives more certainty to potential generator,s as they get a better indication of what capacity exists on the current network. Without this certainty they risk the possibility of building their generating scheme without knowing if they can connect to the network, and, in many cases, not bringing forward more sustainable modes of energy production.
Conclusions
This chapter has discussed two examples of the application of online geocomputational mapping tools that support public participation in spatial decision-making. The first example showed how stakeholders can participate in adapting urban areas to deal with a changing climate. The second example showed how, as we move towards a less carbon-intensive environment, there is a continued appetite to connect renewable generation. The problem here, though, lies in the fact that electricity generation companies have not planned for this decentralisation of energy supply and there are problems associated with connecting such supply to the current electricity network.
Recent developments in web-based technologies mean that it is now possible not only to provide public stakeholder access to interactive mapping but also to interrogate the underlying computational models. Users can interact with and undertake their own scenario analysis in ways that were previously not possible in an online environment. Using various scripting languages (e.g. PHP, Javascript, MySQL), online spatial databases using web mapping services, AJAX (e.g. jQuery) and online mapping libraries (e.g. Leaflet, D3), developers can implement high-end interactive geocomputational methods to support complex spatial decision-making problems.
As these technologies become more mature over the coming years it should become easier for decision-makers to adopt geocomputational approaches to support decision-making more easily than ever before. In the past, these approaches have been too complex to be adopted in main stream decision-making, but, as Klosterman (2008: 174) observed, ‘we are witnessing a second revolution of computer use in planning’. Such approaches will become even more widespread as the technology develops further in increasingly flexible and well-designed packages that are easily customisable with limited programming knowledge. The key to their success will be for decision-makers and other stakeholders to understand that good decision-making is both an art and a science, and that geocomputational tools are there to support and aid them to help improve the outcomes.
FURTHER READING
Pickles, J. (1995). Ground Truth: The Social Implications of Geographical Information Systems. New York: Guilford Press.
Although this is now quite an old book, many of the criticisms in it still hold true today. Pickles discusses the social implications of GIS use which led to the PPGIS response from the GIS community. The book provides what was the first in-depth engagement of GIS with critical social theory.
Ramasubramanian, L. (2008) Geographic Information Science and Public Participation. Berlin: Springer-Verlag.
This book argues that many positive planning and policy outcomes can result when GIS experts and community organisers work together to address problems affecting our neighbourhoods and cities. The case studies are drawn from multiple scales and represent stakeholders, although the focus is on North America. It highlights the pathways to facilitate social change through consensus building and provides practical guidelines for policy-makers seeking to implement consensus-building approaches that are supported by GIS and other digital tools.
Svennerberg, G. (2010) Beginning Google Maps API 3. New York: Apress.
This is the techie book for those interested in trying to build their own web-based mapping tools using Google Maps API 3. It provides some of the skills and knowledge necessary to incorporate Google Maps version 3 on web pages in both desktop and mobile browsers. It also describes how to deal with common problems that most map developers encounter at some point, such as performance and usability issues with having too many markers and possible solutions to that. The book is aimed at web designers/developers with a basic knowledge of HTML, CSS and JavaScript. If you have API 2 applications there is help here to easily transfer to the new API.
There are a number of other techie books out there, but as things change all the time it is best to go direct to their websites to access the APIs and help files. Useful links include:
Google Maps https://developers.google.com/maps/documentation/javascript/
Leaflet http://leafletjs.com/
OpenStreetMap http://wiki.openstreetmap.org/wiki/API
OpenLayers http://openlayers.org/
OS OpenSpace http://www.ordnancesurvey.co.uk/business-and-government/products/os-openspace/
ACKNOWLEDGEMENTS
I would like to thank many of my PhD students who over the years have provided the space in which to discuss and elaborate on these ideas in my research. Particular thanks go to those of you who have focused on the many aspects of web-based PPGIS and PSS, including Khai Zhou, Jessica Pineda-Zumaran, Félix Aponte-González and current students Seyedehsomayeh Taheri Moosav, Moozhan Shakeri and Vasilis Vlastaras.
1It was recently rewritten using OpenStreetMap for mainland Europe and OS OpenSpace for the UK due to Google turning off version 2 of its mapping API.
All materials on the site are licensed Creative Commons Attribution-Sharealike 3.0 Unported CC BY-SA 3.0 & GNU Free Documentation License (GFDL)
If you are the copyright holder of any material contained on our site and intend to remove it, please contact our site administrator for approval.
© 2016-2026 All site design rights belong to S.Y.A.