MySQL High Availability (2014)
Part II. Monitoring and Managing
Now that you have a sophisticated, multiserver system that hopefully meets your site’s needs, you must keep on top of it. This part of the book explains monitoring, with some topics in performance, and covers backups and other aspects of handling the inevitable failures that sometimes occur.
Chapter 10. Getting Started with Monitoring
Joel placed his nonfat half-caf latte, fruit cup, and cheese pastry on his desk and smiled at the parody of nutrition awaiting him. Ever since he found the upscale shopping center on his walk to work, his breakfasts had gotten rather creative.
He turned on his monitor and waited for his email application to retrieve his messages while he opened the top of his latte. Scanning the message subjects and hoping there wasn’t yet another message from his boss, he noticed several messages from users with subjects that hinted at performance issues.
Joel clicked through them, scanning the text. “Well, I guess something must be wrong,” he mumbled, as he read complaints about how applications that queried the database system were taking too long to respond.
He unwrapped his pastry and pondered what could be causing the problems. “Things were just fine yesterday,” he reasoned. After a few sips of his latte he remembered something he read about performance monitoring while working on the lab machines at college.
Joel finished his pastry and reached for his MySQL High Availability book. “There has got to be something in here,” he said.
How do you know when your servers are performing poorly? If you wait for your users to tell you something is wrong, chances are there has been something wrong for some time. Leaving problems unaddressed for an extended period complicates the diagnosis and repair process.
In this chapter, we will begin our examination of monitoring MySQL at the operating system level, using the basic tools available on various systems. We look here first because a system service or application always relies on the performance of the operating system and its hardware. If the operating system is performing poorly, so will the database system or application.
We will first examine the reasons for monitoring systems, then we’ll look at basic monitoring tasks for popular operating systems and discuss how monitoring can make your preventive maintenance tasks easier. Once you’ve mastered these skills, you can begin to look more closely at your database system. In the next chapter, we will look in greater detail at monitoring a MySQL server, along with some practical guides to solving common performance problems.
Ways of Monitoring
When we think of monitoring, we normally think about some form of early warning system that detects problems. However, the definition of monitor (as a verb) is “to observe, record, or detect an operation or condition with instruments that do not affect the operation or condition.” This early warning system uses a combination of automated sampling and an alert system.
The Linux and Unix operating systems are very complex and have many parameters that affect all manner of minor and major system activities. Tuning these systems for performance can be more art than science. Unlike some desktop operating systems, Linux and Unix (and their variants) do not hide the tuning tools nor do they restrict what you can tune. Some systems, such as Mac OS X and Windows, hide many of the underlying mechanics of the system behind a very user-friendly visual interface.
The Mac OS X operating system, for example, is a very elegant and smoothly running operating system that needs little or no attention from the user under normal conditions. However, as you will see in the following sections, the Mac OS X system provides a plethora of advanced monitoring tools that can help you tune your system if you know where to look for them.
The Windows operating system has many variants, the newest at the time of this writing being Windows 8. Fortunately, most of these variants include the same set of monitoring tools, which allow the user to tune the system to meet specific needs. While not considered as suave as Mac OS X, Windows offers a greater range of user-accessible tuning options.
There are three primary categories of system monitoring: system performance, application performance, and security. You may commence monitoring for more specific reasons, but in general, the task falls into one of these categories.
Each category uses a different set of tools (with some overlap) and has a different objective. For instance, you should monitor system performance to ensure the system is operating at peak efficiency. Application performance monitoring ensures a single application is performing at peak efficiency, and security monitoring helps you ensure the systems are protected in the most secure manner.
Monitoring a MySQL server is akin to monitoring an application. This is because MySQL, like most database systems, lets you measure a number of variables and status indicators that have little or nothing to do with the operating system. However, a database system is very susceptible to the performance of the host operating system, so it is important to ensure your operating system is performing well before trying to diagnose problems with the database system.
Because the goal is to monitor a MySQL system to ensure the database system is performing at peak efficiency, the following sections discuss monitoring the operating system for performance. We leave monitoring for security to other texts that specialize in the details and nuances of security monitoring.
Benefits of Monitoring
There are two approaches to monitoring. You may want to ensure nothing has changed (no degradation of performance and no security breaches) or to investigate what has changed or gone wrong. Monitoring the system to ensure nothing has changed is called proactive monitoring, whereas monitoring to see what went wrong is called reactive monitoring. Sadly, most monitoring occurs in a reactive manner. Very few IT professionals have the time or resources to conduct proactive monitoring. Reactive monitoring is therefore the only form of monitoring some professionals understand.
However, if you take the time to monitor your system proactively, you can eliminate a lot of reactive work. For example, if your users complain about poor performance (the number one trigger for reactive monitoring), you have no way of knowing how much the system has degraded unless you have previous monitoring results with which to compare. Recording such results is called forming a baseline of your system (i.e., you monitor the performance of your system under low, normal, and high loads over a period of time). If you do the sampling frequently and consistently, you can determine the typical performance of the system under various loads. Thus, when users report performance problems, you can sample the system and compare the results to your baseline. If you include enough detail in your historical data, you can normally see, at a glance, which part of the system has changed.
System Components to Monitor
You should examine four basic parts of the system when monitoring performance:
Processor
Check to see how much of it is utilized and what peaks are reached by utilization.
Memory
Check to see how much is being used and how much is still available to run programs.
Disk
Check to see how much disk space is available, how disk space is used, and what demand there is for it and how fast it delivers content (response time).
Network
Check for hroughput, latency, and error rates when communicating with other systems on the network.
Processor
Monitor the system’s CPU to ensure there are no runaway processes and that the CPU cycles are being shared equally among the running programs. One way to do this is to call up a list of the programs running and determine what percentage of the CPU each is using. Another method is to examine the load average of the system processes. Most operating systems provide several views of the performance of the CPU.
NOTE
A process is a unit of work in a Linux or Unix system. A program may have one or more processes running at a time. Multithreaded applications, such as MySQL, generally appear on the system as multiple processes.
When a CPU is under a performance load and contention is high, the system can exhibit very slow performance and even periods of seeming inactivity. When this occurs, you must either reduce the number of processes or reduce the CPU usage of processes that seem to be consuming more CPU time. You can find which processes are consuming more CPU by using the top utility for Linux and Unix systems, Activity Monitor on Mac OS X, or the Task Manager Performance tab on Windows. But be sure to monitor the CPUs to make sure that high CPU utilization is really the cause of the problem—slowness is even more likely to occur because of memory contention, discussed in the next section.
Some of the common solutions to CPU overloading include:
Provision a new server to run some processes
This is, of course, the best method, but requires money for new systems. Experienced system administrators can often find other ways to reduce CPU usage, especially when the organization is more willing to spend your time than to spend money.
Remove unnecessary processes
An enormous number of systems run background processes that may be useful for certain occasions but just bog down the system most of the time. However, an administrator must know the system very well to identify which processes are nonessential.
Kill runaway processes
These probably stem from buggy applications, and they are often the culprit when performance problems are intermittent or rare. In the event that you cannot stop a runaway process using a controlled or orderly method, you may need to terminate the process abruptly using a force quitdialog or the command line.
Optimize applications
Some applications routinely take up more CPU time or other resources than they really need. Poorly designed SQL statements are often a drag on the database system.
Lower process priorities
Some processes run as background jobs, such as report generators, and can be run more slowly to make room for interactive processes.
Reschedule processes
Maybe some of those report generators can run at night when system load is lower.
Processes that consume too much CPU time are called CPU-bound or processor-bound, meaning they do not suspend themselves for I/O and cannot be swapped out of memory.
If you find the CPU is not under contention and there are either few processes running or no processes consuming large amounts of CPU time, the problem with performance is likely to be elsewhere (waiting on disk I/O, insufficient memory, excessive page swapping, etc.).
Memory
Monitor memory to ensure your applications are not requesting so much memory that they waste system time on memory management. From the very first days of limited random access memory (RAM, or main memory), operating systems have evolved to employ a sophisticated method of using disk memory to store unused portions or pages of main memory. This technique, called paging or swapping, allows a system to run more processes than main memory can load at one time, by storing the memory for suspended processes and later retrieving the memory when the process is reactivated. While the cost of moving a page of memory from memory to disk and back again is relatively high (it is time-consuming compared to accessing main memory directly), modern operating systems can do it so quickly that the penalty isn’t normally an issue unless it reaches such a high level that the processor and disk cannot keep up with the demands.
However, the operating system may perform some swapping at a high level periodically to reclaim memory. Be sure to measure memory usage over a period of time to ensure you are not observing a normal cleanup operation.
When periods of high paging occur, it is likely that low memory availability may be the result of a runaway process consuming too much memory or too many processes requesting too much memory. This kind of high paging, called thrashing, can be treated the same way as a CPU under contention. Processes that consume too much memory are called memory-bound.
When treating memory performance problems, the natural tendency is to add more memory. While that may indeed solve the problem, it is also possible that the memory is not allocated correctly among the various subsystems.
There are several things you can do in this situation. You can allocate different amounts of memory to parts of the system—such as the kernel or filesystem—or to various applications that permit such tweaking, including MySQL. You can also change the priority of the paging subsystem so the operating system begins paging earlier.
WARNING
Be very careful when tweaking memory subsystems on your server. Be sure to consult your documentation or a book dedicated to improving performance for your specific operating system.
If you monitor memory and find that the system is not paging too frequently, but performance is still an issue, the problem is likely related to one of the other subsystems.
Disk
Monitor disk usage to ensure there is enough free disk space available, as well as sufficient I/O bandwidth to allow processes to execute without significant delay. You can measure this using either a per-process or overall transfer rate to and from disk. The per-process rate is the amount of data a single process can read or write. The overall transfer rate is the maximum bandwidth available for reading and writing data on disk. Some systems have multiple disk controllers; in these cases, overall transfer rate may be measured per disk controller.
Performance issues can arise if one or more processes are consuming too much of the maximum disk transfer rate. This can have very detrimental effects on the rest of the system in much the same way as a process that consumes too many CPU cycles: it “starves” other processes, forcing them to wait longer for disk access.
Processes that consume too much of the disk transfer rate are called disk-bound, meaning they are trying to access the disk at a frequency greater than the available share of the disk transfer rate. If you can reduce the pressure placed on your I/O system by a disk-bound process, you’ll free up more bandwidth for other processes.
NOTE
You may hear the terms I/O-bound or I/O-starved when referring to processes. This normally means the process is consuming too much disk.
One way to meet the needs of a process performing a lot of I/O to disk is to increase the block size of the filesystem, thus making large transfers more efficient and reducing the overhead imposed by a disk-bound process. However, this may cause other processes to run more slowly.
WARNING
Be careful when tuning filesystems on servers that have only a single controller or disk. Be sure to consult your documentation or a book dedicated to improving performance for your specific operating system.
If you have the resources, one strategy for dealing with disk contention is to add another disk controller and disk array and move the data for one of the disk-bound processes to the new disk controller. Another strategy is to move a disk-bound process to another, less utilized server. Finally, in some cases it may be possible to increase the bandwidth of the disk by upgrading the disk system to a faster technology.
There are differing opinions as to where to optimize first or even which is the best choice. We believe:
§ If you need to run a lot of processes, maximize the disk transfer rate or split the processes among different disk arrays or systems.
§ If you need to run a few processes that access large amounts of data, maximize the per-process transfer rate by increasing the block size of the filesystem.
You may also need to strike a balance between the two solutions to meet your unique mix of processes by moving some of the processes to other systems.
Network Subsystem
Monitor network interfaces to ensure there is enough bandwidth and that the data being sent or received is of sufficient quality.
Processes that consume too much network bandwidth, because they are attempting to read or write more data than the network configuration or hardware make possible, are called network-bound. These processes keep other processes from accessing sufficient network bandwidth to avoid delays.
Network bandwidth issues are normally indicated by utilization of a percentage of the maximum bandwidth of the network interface. You can solve these issues with processes by assigning the processes to specific ports on a network interface.
Network data quality issues are normally indicated by a high number of errors encountered on the network interface. Luckily, the operating system and data transfer applications usually employ checksumming or some other algorithm to detect errors, but retransmissions place a heavy load on the network and operating system. Solving the problem may require moving some applications to other systems on the network or installing additional network cards, which normally requires a diagnosis followed by changing the network hardware, reconfiguring the network protocols, or moving the system to a different subnet on the network.
NOTE
When referring to a process that is taking too much time accessing networking subsystems, we say it is network-bound.
Monitoring Solutions
For each of the four subsystems just discussed, a modern operating system offers its own specific tools that you can use to get information about the subsystem’s status. These tools are largely standalone applications that do not correlate (at least directly) with the other tools. As you will see in the next sections, the tools are powerful in their own right, but it requires a fair amount of effort to record and analyze all of the data they produce.
Fortunately, a number of third-party monitoring solutions are available for most operating and database systems. It is often best to contact your systems providers for recommendations on the best solution to meet your needs and maintain compatibility with your infrastructure. Most vendors offer system monitoring tools as an option. The following are a few of the more notable offerings:
up.time
An integrated system for monitoring and reporting performance for servers. It supports multiple platforms.
Cacti
A graphical reporting solution for graphing data from the RRDtool. RRDtool is an open source data logging system and can be tailored using Perl, Python, Ruby, LUA, or TCL.
KDE System Guard (KSysGuard)
Permits users to track and control processes on their system. Designed to be easy to set up.
Gnome System Monitor
A graphical tool to monitor CPU, network, memory, and processes on a system.
Nagios
A complete solution for monitoring all of your servers, network switches, applications, and services.
MySQL Enterprise Monitor
Provides real-time visibility into the performance and availability of all your MySQL databases.
NOTE
We will discuss the MySQL Enterprise Monitor and automated monitoring and report in greater detail in Chapter 16.
The following sections describe the built-in monitoring tools for some of the major operating systems. We will study the Linux and Unix commands in a little more detail, as they are particularly suited to investigating the performance issues and strategies we’ve discussed. However, we will also include an examination of the monitoring tools for Mac OS X and Microsoft Windows.
Linux and Unix Monitoring
Database monitoring on Linux or Unix can involve tools for monitoring the CPU, memory, disk, network, and even security and users. In classic Unix fashion, all of the core tools run from the command line and most are located in the bin or sbin folders. Table 10-1 includes the list of tools we’ve found useful, with a brief description of each.
Table 10-1. System monitoring tools for Linux and Unix
|
Utility |
Description |
|
ps |
Shows the list of processes running on the system. |
|
top |
Displays process activity sorted by CPU utilization. |
|
vmstat |
Displays information about memory, paging, block transfers, and CPU activity. |
|
uptime |
Displays how long the system has been running. It also tells you how many users are logged on and the system load average over 1, 5, and 15 minutes. |
|
free |
Displays memory usage. |
|
iostat |
Displays average disk activity and processor load. |
|
sar |
System activity report. Allows you to collect and report a wide variety of system activity. |
|
pmap |
Displays a map of how a process is using memory. |
|
mpstat |
Displays CPU usage for multiprocessor systems. |
|
netstat |
Displays information about network activity. |
|
cron |
A subsystem that allows you to schedule the execution of a process. You can schedule execution of these utilities so you can collect regular statistics over time or check statistics at specific times, such as during peak or minimal loads. |
NOTE
Some operating systems provide additional or alternative tools. Consult your operating system documentation for additional tools for monitoring your system performance.
As you can see from Table 10-1, a rich variety of tools is available with a host of potentially useful information. The following sections discuss some of the more popular tools and explain briefly how you can use them to identify the problems described in the previous sections.
Process Activity
Several commands provide information about processes running on your system—notably top, iostat, mpstat, and ps.
The top command
The top command provides a summary of system information and a dynamic view of the processes on your system ranked by the most CPU-intensive tasks. The display typically contains information about the process, including the process ID, the user who started the process, its priority, the percentage of CPU it is using, how much time it has consumed, and of course, the command used to start the process. However, some operating systems have slightly different reports. This is probably the most popular utility in the set because it presents a snapshot of your system every few seconds. Figure 10-1 shows the output when running top on a Linux (Ubuntu) system under moderate load.
The system summary is located at the top of the listing and has some interesting data. It shows the percentages of CPU time for user (%us); system (%sy); nice (%ni), which is the time spent running users’ processes that have had their priorities changed; I/O wait (%wa); and even the percentage of time spent handling hardware and software interrupts. Also included are the amount of memory and swap space available, how much is being used, how much is free, and the size of the buffers.
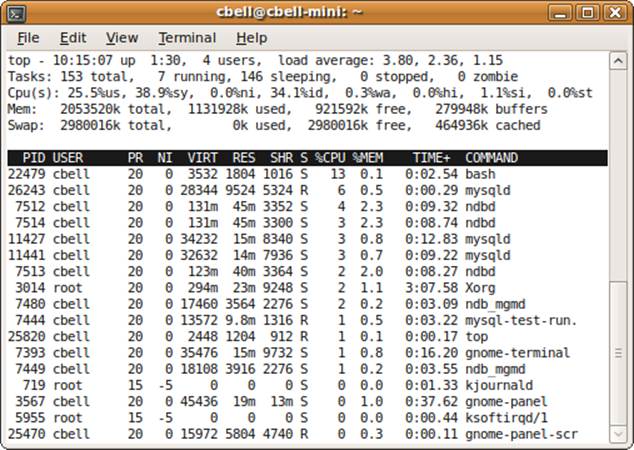
Figure 10-1. The top command
Below the summary comes the list of processes, in descending order (which is from where the name of the command derives) based on how much CPU time is being used. In this example, a Bash shell is currently the task leader followed by one or several installations of MySQL.
NICENESS
You can change the priority of a process on a Linux or Unix system. You may want to do this to lower the priorities of processes that require too much CPU power, are of lower urgency, or could run for an extended period but that you do not want to cancel or reschedule. You can use the commands nice, ionice, and renice to alter the priority of a process.
Most distributions of Linux and Unix now group processes that have had their priorities changed into a group called nice. This allows you to get statistics about these modified processes without having to remember or collate the information yourself. Having commands that report the CPU time for nice processes gives you the opportunity to see how much CPU these processes are consuming with respect to the rest of the system. For example, a high value on this parameter may indicate there is at least one process with too high of a priority.
Perhaps the best use of the top command is to allow it to run and refresh every three seconds. If you check the display at intervals over time, you will begin to see which processes are consuming the most CPU time. This can help you determine at a glance whether there is a runaway process.
NOTE
You can change the refresh rate of the command by specifying the delay on the command. For example, top -d 3 sets the delay to three seconds.
Most Linux and Unix variants have a top command that works like we have described. Some have interesting interactive hot keys that allow you to toggle information on or off, sort the list, and even change to a colored display. You should consult the manual page for the top command specific to your operating system, because the special hot keys and interactive features differ among operating systems.
The iostat command
The iostat command gives you different sets of information about your system, including statistics about CPU time, device I/O, and even partitions and network filesystems (NFS). The command is useful for monitoring processes because it gives you a picture of how the system is doing overall related to processes and the amount of time the system is waiting for I/O. Figure 10-2 shows an example of running the iostat command on a system with moderate load.
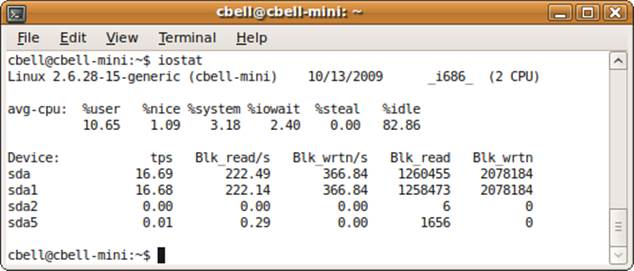
Figure 10-2. The iostat command
NOTE
The iostat, mpstat, and sar commands might not be installed on your system by default, but they can be installed as an option. For example, they are part of the sysstat package in Ubuntu distributions. Consult your operating system documentation for information about installation and setup.
Figure 10-2 shows the percentages for CPU usage from the time the system was started. These are calculated as averages among all processors. As you can see, the system is running on a dual-core CPU, but only one row of values is given. This data includes the percentage of CPU utilization:
§ Executing at the user level (running applications)
§ Executing at the user level with nice priority
§ Executing at the system level (kernel processes)
§ Waiting on I/O
§ Waiting for virtual processes
§ Idle time
A report like this can give you an idea of how your system has been performing since it was started. While this means that you might not notice periods of poor performance (because they are averaged over time), it does offer a unique perspective on how the processes have been consuming available processing time or waiting on I/O. For example, if %idle is very low, you can determine that the system was kept very busy. Similarly, a high value for %iowait can indicate a problem with the disk. If %system or %nice is much higher than %user, it can indicate an imbalance of system and prioritized processes that are keeping normal processes from running.
The mpstat command
The mpstat command presents much of the same information as iostat for processor time, but splits the information out by processor. If you run this command on a multiprocessor system, you will see the percentage of data per processor as well as the totals for all processors. Figure 10-3shows an example of the mpstat command.
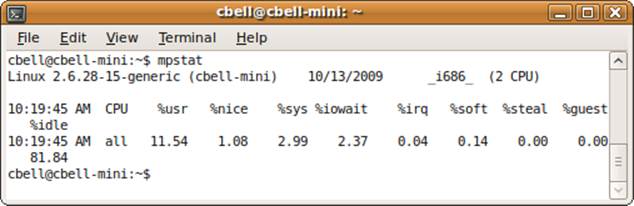
Figure 10-3. The mpstat command
There is an option to tell the mpstat command to refresh the information based on an interval passed. This can be helpful if you want to watch how your processors are performing with respect to the processes over a period of time. For instance, you can see whether your processor affinity is unbalanced (too many processes are assigned to one specific processor).
TIP
Some implementations of mpstat provide an option to see a more comprehensive display including show statistics for all processors. This may be -A or -P ALL depending on your operating system.
To find out more about the mpstat command, consult the manual page for your operating system.
The ps command
The ps command is one of those commands we use on a daily basis but never take the time to consider its power and utility. This command gives you a snapshot of the processes running on your system. It displays the process ID, the terminal the process is running from, the amount of time it has been running, and the command used to start the process. It can be used to find out how much memory a process uses, how much CPU a process uses, and more. You can also pipe the output to grep to more easily find processes. For example, the command ps -A | grep mysqld is a popular command to find information about all of the MySQL processes running on your system. This will send the list of all processes to the grep command, which will in turn only show those rows with “mysqld” in them. You can use this technique to find a process ID so you can get detailed information about that process using other commands.
What makes the ps command so versatile is the number of options available for displaying data. You can display the processes for a specific user, get related processes for a specific process by showing its process tree, and even change the format of the output. Consult your documentation for information about the options available on your operating system.
One of the ways you can use this output to diagnose problems is to look for processes that have been running for a long time or check process status (e.g., check those that are stuck in a suspicious state or sleeping). Unless they are known applications like MySQL, you might want to investigate why they have been running for so long.
Figure 10-4 shows an abbreviated example of the ps command run on a system under moderate load.
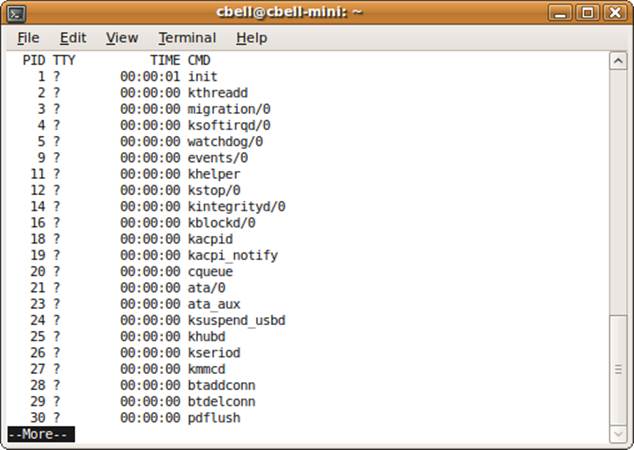
Figure 10-4. The ps command
Another use for the output is to see whether there are processes that you do not recognize or a lot of processes run by a single user. Many times this indicates a script that is spawning processes, perhaps because it has been set up improperly, and can even indicate a dangerous security practice.
There are many other utilities built into operating systems to display information about processes. As always, a good reference on performance tuning for your specific operating system will be the best source for more in-depth information about monitoring processes.
Memory Usage
Several commands provide information about memory usage on your system. The most popular ones include free and pmap.
The free command
The free command shows you the amount of physical memory available. It displays the total amount of memory, the amount used, and the amount free for physical memory, and it displays the same statistics for your swap space. It also shows the memory buffers used by the kernel and the size of the cache. Figure 10-5 shows an example of free run on a system with a moderate load.
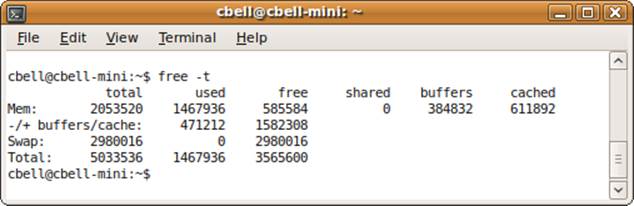
Figure 10-5. The free command
NOTE
In the output from an Ubuntu system, shown in Figure 10-5, the shared column is obsolete.
There is a switch that puts the command into a polling mode where the statistics are updated for the number of seconds provided. For example, to poll memory every five seconds, issue free -t -s 5.
The pmap command
The pmap command gives you a detailed map of the memory used for a process. To use this command, you must first find the process ID for the process you want to explore. You can get this information using the ps command, or even the top command if you are looking at a process that is consuming lots of CPU time.
You can also get the memory map of multiple processes by listing the process IDs on the command line. For example, pmap 12578 12579 will show the memory map for process IDs 12578 and 12579.
The output shows a detailed map of all of the memory addresses and the sizes of the portions of memory used by the process at the instant the report was created. It displays the command used to launch the process, including the full path and parameters, which can be very useful for determining where the process was started and what options it is using. You’d be amazed how handy that is when trying to figure out why a process is behaving abnormally. The display also shows the mode (access rights) for the memory block. This can be useful in diagnosing interprocess issues. Figures 10-6 and 10-7 show an example of a mysqld process map when running on a system with moderate load.
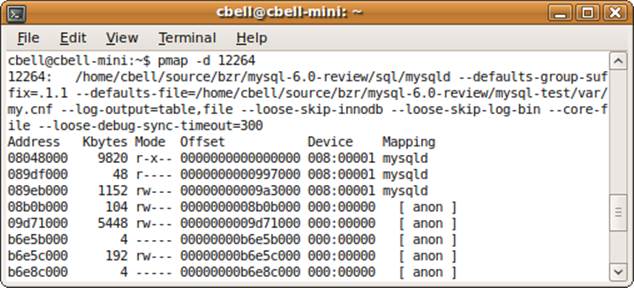
Figure 10-6. The pmap command—part 1
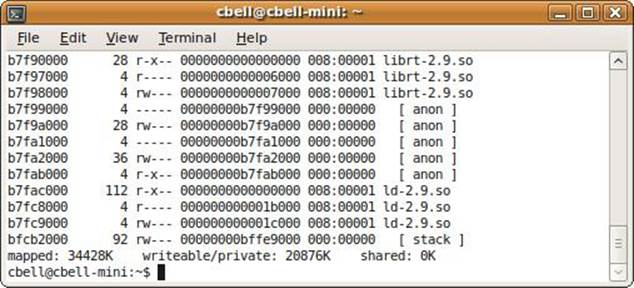
Figure 10-7. The pmap command—part 2
Notice that the listing chosen is the device output format (selected by issuing the -d parameter on startup) as well as where the memory is being mapped or used. This can be handy in diagnosing why a particular process is consuming lots of memory and which part (e.g., a library) is consuming the most.
Figure 10-7 shows the final line of the pmap output, which displays some useful summary information.
The final line shows how much memory is mapped to files, the amount of private memory space, and the amount shared with other processes. This information may be a key piece of data needed to solve memory allocation and sharing issues.
There are several other commands and utilities that display information about memory usage (e.g., dmesg, which can display messages from bootup); consult a good reference on performance tuning for your operating system.
Disk Usage
A number of commands can reveal the disk usage statistics on your system. This section describes and demonstrates the iostat and sar commands.
The iostat command
As you have already seen in Process Activity, the iostat command shows the CPU time used and a list of all of the disks and their statistics. Specifically, iostat lists each device, its transfer speed, the number of blocks read and written per second, and the total number of blocks read and written. For easy consultation, Figure 10-8 repeats Figure 10-2, which is an example of the iostat command run on a system with a moderate load.
Figure 10-8. The iostat command
This report can be very important when diagnosing disk problems. At a glance, it can tell you whether some devices are being used more than others. If this is the case, you can move some processes to other devices to reduce demand for a single disk. The output can also tell you which disk is experiencing the most reads or writes—this can help you determine whether a particular device needs to be upgraded to a faster one. Conversely, you can learn which devices are underutilized. For example, if you see that your shiny new super-fast disk is not being accessed much, it is likely that you have not configured the high-volume processes to use the new disk. On the other hand, it could be that your program is using memory caches that I/O is seldom performed on.
The sar command
The sar command is a very powerful utility that displays all sorts of information about your system. It records data over time and can be configured in a variety of ways, so it can be a little tricky to set up. Consult your operating system’s documentation to ensure you have it set up correctly. Like most of the system utilization commands we show, you can also configure sar to generate reports at regular intervals.
NOTE
The sar command can also display CPU usage, memory, cache, and a host of other data similar to that shown by the other commands. Some administrators set up sar to run periodically to cull the data and form a benchmark for their system. A complete tutorial on sar is beyond the scope of this book. For a more detailed examination, see System Performance Tuning by Gian-Paolo D. Musumeci and Mike Loukides (O’Reilly).
In this section, we will look at how to use the sar command to display information about disk usage. We do this by combining displays of the I/O transfer rates, swap space and paging statistics, and block device usage. Figure 10-9 shows an example of the sar command used to display disk usage statistics.
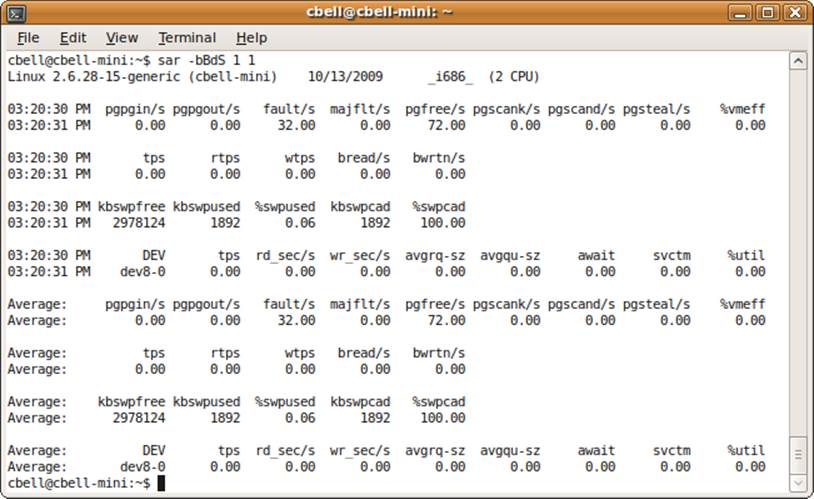
Figure 10-9. The sar command for disk usage
The report displays so much information that it seems overwhelming at first glance. Notice the first section after the header. This is the paging information that displays the performance of the paging subsystem. Below that is a report of the I/O transfer rates, followed by the swap space report and then a list of the devices with their statistics. The last portion of the report displays averages calculated for all parameters sampled.
The paging report shows the rate of pages paged in or out of memory, the number of page faults per second that did not require disk access, the number of major faults requiring disk access, and additional statistics about the performance of the paging system. This information can be helpful if you are seeing a high number of page faults (major page faults are more costly), which could indicate too many processes running. Large numbers of major page faults can cause disk usage problems (i.e., if this value is very high and disk usage is high, poor performance may not be located in the disk subsystems). It is possible the observation is just a symptom of something going wrong in the application or operating system.
The I/O transfer report shows the number of transactions per second (tps), the read and write requests, and the totals for blocks read and written. In this example, the system is not using I/O but is under heavy CPU load. This is a sign of a healthy system. If the I/O values were very high, we would suspect one or more processes of being stuck in an I/O-bound state. For MySQL, a query generating a lot of random disk accesses or tables that reside across a fragmented disk could cause such a problem.
The swap space report shows the amount of swap space available, how much is used, the percentage used, and how much cache memory is used. This can be helpful in indicating a problem with swapping out too many processes and, like the other reports, can help you determine whether the problem lies in your disks and other devices or with memory or too many processes.
The block device (any area of the system that moves data in blocks like disk, memory, etc.) report shows the transfer rate (tps), the reads and writes per second, and average wait times. This information can be helpful in diagnosing problems with your block devices. If these values are all very high (unlike this example, which shows almost no device activity), it could mean you have reached the maximum bandwidth of your devices. However, this information should be weighed against the other reports on this page to rule out a thrashing system, a system with too many processes, or a system without enough memory (or a combination of such problems).
This composite report can be helpful in determining where your disk usage problems lie. If the paging report shows an unusually high rate of faults, it’s an indication you may have too many applications running or not enough memory. However, if these values are low or average, you need to look to the swap space; if that is normal, you can examine the device usage report for anomalies.
Disk usage analyzer
In addition to operating system utilities, the GNOME desktop project has created a graphical application called the Disk Usage Analyzer. This tool gives you an in-depth look at how your storage devices are being used. It also gives you a graphic that depicts disk usage. The utility is available in most distributions of Linux.
Figure 10-10 shows a sample report from the Disk Usage Analyzer.
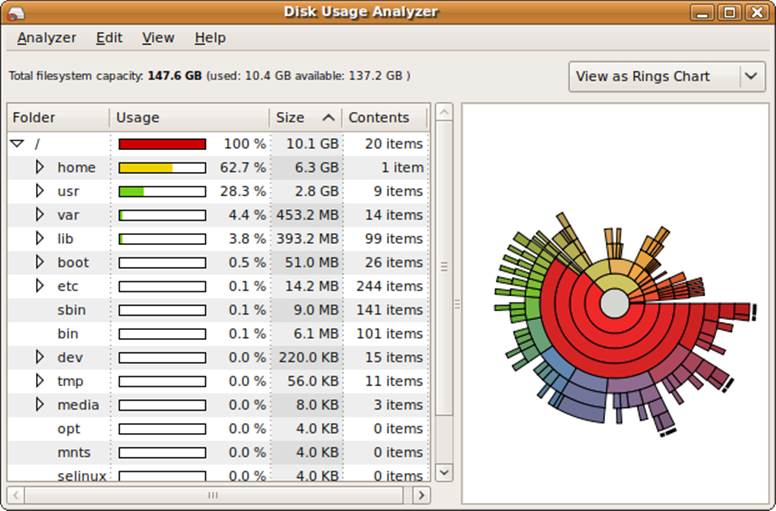
Figure 10-10. Disk Usage Analyzer
Basically, this report gives you a look at how the devices are performing alongside the paging and swap systems. Naturally, if a system is swapping a lot of processes in and out of memory, the disk usage will be unusual. This is why it is valuable to look at these items together on the same report.
Diagnosing disk problems can be challenging, and only a few commands give you the kind of detailed statistics about disk usage we’ve described. However, some operating systems provide more detailed and specific tools for examining disk usage. Don’t forget that you can also determine available space, what is mounted, which filesystems each disk has, and much more from more general commands such as ls, df, and fdisk. Consult your operating system documentation for a list and description of all disk-related commands, as well as for disk usage and monitoringcommands.
NOTE
The vmstat command, shown later in this chapter, can also show this data. Use the vmstat -d command to get a text-based representation of the data.
Network Activity
Diagnosing network activity problems may require specialized knowledge of hardware and networking protocols. Detailed diagnostics are normally left to the networking specialists, but there are two commands you, as a MySQL administrator, can use to get an initial picture of the problem.
The netstat command
The netstat command allows you to see network connections, routing tables, interface statistics, and additional networking-related information. The command provides a lot of the information that a network specialist would use to diagnose and configure complex networking problems. However, it can be helpful to see how much traffic is passing through your network interfaces and which interfaces are being accessed the most. Figure 10-11 shows a sample report of all of the network interfaces and how much data has been transmitted over each one.
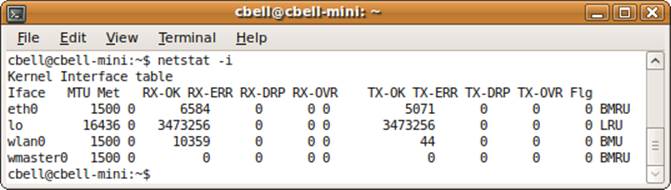
Figure 10-11. The netstat command
In systems that have multiple network interfaces, it may be helpful to determine whether any interface is being overutilized or if the wrong interfaces are active.
The ifconfig command
The ifconfig command, an essential tool for any network diagnostics, displays a list of the network interfaces on your system, including the status and settings for each. Figure 10-12 shows an example of the ifconfig command.
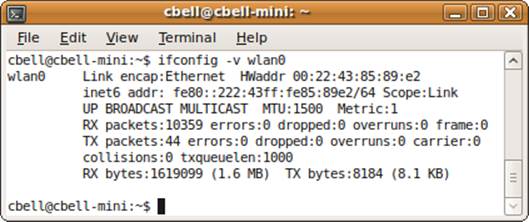
Figure 10-12. The ifconfig command
The output lists each interface, whether it is up or down, along with its configuration information. This can be very helpful in determining how an interface is configured and can tell you, for example, that instead of communicating over your super-fast Ethernet adapter, your network has failed over to a much slower interface. The root of networking problems is often not the traffic on the network, but rather the network interface choice or setup.
If you produce the reports shown here for your system and still need help diagnosing the problem, having this data ahead of time can help your networking specialist zero in on the problem more quickly. Once you have eliminated any processes consuming too much network bandwidth and determined where you have a viable network interface, the networking specialist can then configure the interface for optimal performance.
General System Statistics
Along with the subsystem-specific commands we’ve discussed, and grouped statistical reporting commands, Linux and Unix offer additional commands that give you more general information about your system. These include commands such as uptime and vmstat.
The uptime command
The uptime command displays how long a system has been running. It displays the current time; how long the system has been running; how many users have been using the system (logged on); and load averages for the past 1, 5, and 15 minutes. Figure 10-13 shows an example of the command.
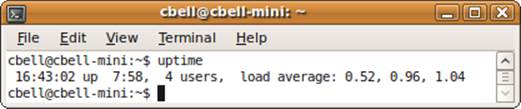
Figure 10-13. The uptime command
This information can be helpful if you want to see how the system has been performing on average in the recent past. The load averages given are for processes in an active state (not waiting on I/O or the CPU). Therefore, this information has limited use for determining performance issues, but can give you a general sense of the health of the system.
The vmstat command
The vmstat command is a general reporting tool that gives you information about processes, memory, the paging system, block I/O, disk, and CPU activity. It is sometimes used as a first stop on a quest for locating performance issues. High values in some fields may lead you to examine those areas more closely using other commands discussed in this chapter.
Figure 10-14 shows an example of the vmstat command run on a system with low load.
The data shown here includes the number of processes, where r indicates those waiting to run and b indicates those in an uninterruptible state. The next set of columns shows the swap space totals including amount of memory swapped in (si) or out (so). The next area shows the I/O reports for blocks received (bi) or sent (bo). The next area shows the number of interrupts per second (in), number of context switches per second (cs), time spent running processes in user space (us), time spent running processes in kernel space (sy), idle time (id), and time waiting for I/O (wa). These times are all in seconds.
There are more parameters and options for the vmstat command. Check your operating system manual for more details on the options available for your operating system.
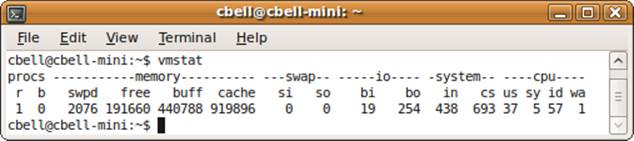
Figure 10-14. The vmstat command
Automated Monitoring with cron
Perhaps the most important tool to consider is the cron facility. You can use cron to schedule a process to run at a specific time. This allows you to run commands and save the output for later analysis. It can be a very powerful strategy, allowing you to take snapshots of the system over time. You can then use the data to form averages of the system parameters, which you can use as a benchmark to compare to when the system performs poorly in the future. This is important because it allows you to see at a glance what has changed, saving you considerable time when diagnosing performance problems.
If you run your performance monitoring tools daily, and then examine the results and compare them to your benchmark, you may be able to detect problems before your users start complaining. Indeed, this is the basic premise behind the active monitoring tools we’ve described.
Mac OS X Monitoring
Because the Mac OS X operating system is built on the Unix Mac kernel, you can use most of the tools described earlier to monitor your operating system. However, there are other tools specific to the Mac. These include the following graphical administration tools:
§ System Profiler
§ Console
§ Activity Monitor
This section will present an overview of each of these tools for the purposes of monitoring a Mac OS X system. These tools form the core monitoring and reporting facilities for Mac OS X. In good Mac fashion, they are all well-written and well-behaved graphical user interfaces (GUIs). The GUIs even show the portions of the tools that report information from files. As you will see, each has a very important use and can be very helpful in diagnosing performance issues on a Mac.
System Profiler
The System Profiler gives you a snapshot of the status of your system. It provides an incredible amount of detail about just about everything in your system, including all of the hardware, the network, and the software installed. Figure 10-15 shows an example of the System Profiler.
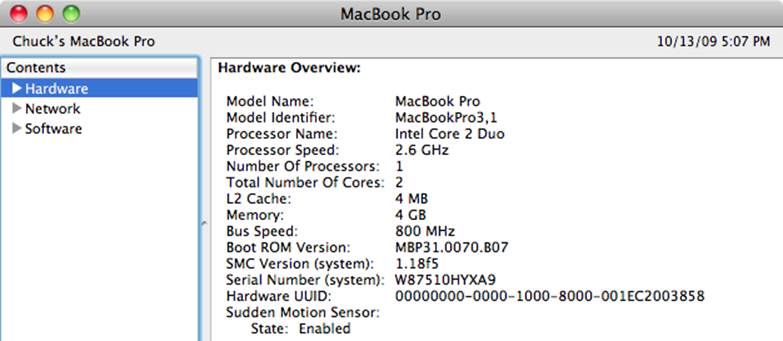
Figure 10-15. The System Profiler
You can find the System Profiler in the Applications/Utilities folder on your hard drive. You can also launch the System Profiler via Spotlight. As Figure 10-15 shows, the tool offers a tree pane on the left and a detail pane on the right. You can use the tree pane to dive into the various components of your system.
NOTE
If you would prefer a console-based report, the System Profiler has a command-line-equivalent application in /usr/sbin/system_profiler. There are many parameters and options that allow you to restrict the view to certain reports. To find out more, open a terminal and type man system_profiler.
If you open the Hardware tree, you will see a listing of all of the hardware on your system. For example, if you want to see what type of memory is installed on your system, you can click the Memory item in the Hardware tree.
System Profiler provides a network report, which we have seen in another form on Linux. Click the Network tree to get a basic report of all of the network interfaces on your system. Select one of the network interfaces in the tree or in the detail pane to see all of the same (and more) information that the network information commands in Linux and Unix generate. You can also find out information about firewalls, locations you’ve defined, and even which volumes are shared on the network.
Another very useful report displays the applications installed on your system. Click Software→Applications report to see a list of all of the software on your system, including the name, version, when it was updated, whether it is a 64-bit application, and what kind of application it is—for instance, whether it’s a universal or a native Intel binary. This last detail can be very important. For example, you can expect a universal binary to run slower than an Intel binary. It is good to know these things in advance, as they can set certain expectations for performance.
Figure 10-16 shows an example of this report.
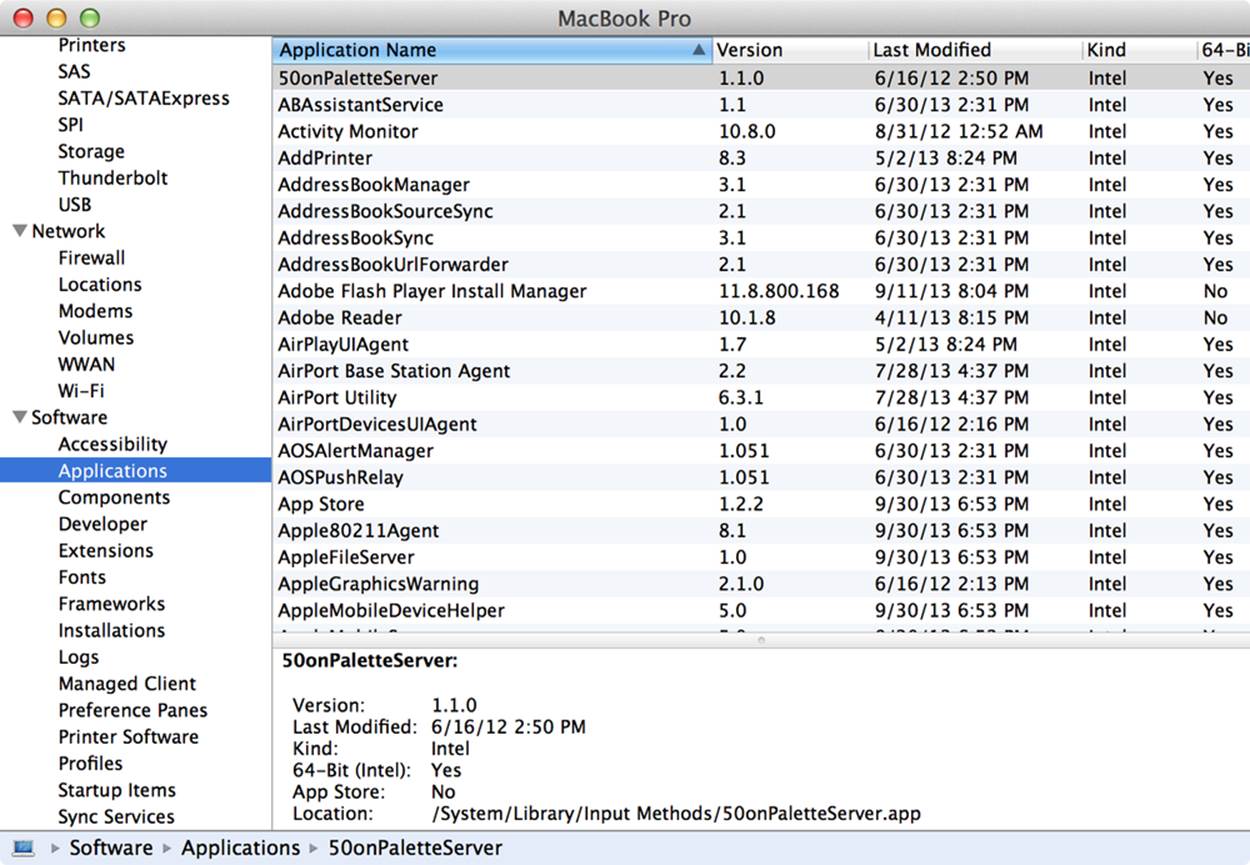
Figure 10-16. Memory report from System Profiler
As you can see, this is a lot of detail. You can see how many memory cards are installed, their speed, and even the manufacturer code and part number. Wow!
NOTE
We call each detail pane a report because it’s essentially a detailed report for a given category. Some people may refer to all of the data as a report, which is not incorrect, but we think it’s better to consider the whole thing a collection of reports.
If you are intrigued with the power of this tool, feel free to experiment and dig around in the tree for more information about your system. You will find just about any fact about it here.
The System Profiler can be very valuable during diagnostics of system problems. Many times AppleCare representatives and Apple-trained technicians will ask for a report of your system. Generate the report from the System Profiler by using the File→Save command. This saves an XML file that Apple professionals can use. You can also export the report to RTF using the File→Export command. Finally, you can print the report after saving it as a PDF file.
You can also change the level of detail reported using the View menu. It has options for Mini, Basic, and Full, which change the level of detail from very minimal to a complete report. Apple professionals usually ask for the full report.
A System Profiler report is the best way to determine what is on your system without opening the box. It should be your first source to determine your system configuration.
Console
The Console application displays the logfiles on your system, and is located in the /Applications/Utilities folder or via Spotlight. Unlike the System Profiler, this tool provides you not only a data dump, but also the ability to search the logs for vital information. When diagnosing problems, it is sometimes helpful to see whether there are any messages in the logs that give more information about an event. Figure 10-17 shows an example of the Console application.
When you launch the Console application, it reads all of the system logs and categorizes them into console diagnostic messages. As you can see in Figure 10-17, the display features a log search pane on the left and a log view on the right. You can also click the individual logfiles in the Files tree to see the contents of each log. The logfiles include the following:
~/Library/Logs
Stores all messages related to user applications. Check here for messages about applications that crash while logged in, information about iDisk activity, and other user-related tasks.
/Library/Logs
Stores all system messages. Check here for information generated at the system level for crashes and other unusual events.
/private/var/log
Stores all Unix BSD process-related messages. Check here for information about the system daemon or BSD utility.
NOTE
Logs are sequential text files where data is always appended, never updated in the middle, and rarely deleted.
The most powerful feature of Console is its search capability. You can create reports containing messages for a given phrase or keyword and view them later. To create a new search, select File→New Database Search in the menu. You will be presented with a generalized search builder that you can use to create your query. When you are finished, you can name and save the report for later processing. This can be a very handy way to keep an eye on troublesome applications.
Another really cool feature is the capability to mark a spot in a log that indicates the current date and time—you can use this to determine the last time you looked at the log. If your experience is like ours, you often find interesting messages in several places in the logs and need to review them later, but don’t know where you found them or where you left off reviewing the log. Having the ability to mark a log is a real help in this case. To mark a log, highlight a location in the file and click the Mark button on the toolbar.
Although the data reported is a static snapshot of the logs upon launch and any reports you run are limited to this snapshot, you can also set up alerts for new messages in the logs. Use Console→Preferences to turn on notifications, which are delivered to you either via a bouncing icon on the Dock or by bringing the Console application to the forefront after a delay.
The Console application can be very helpful for seeing how various aspects of your system work by monitoring the events that occur and for finding errors from applications or hardware. When you are faced with a performance issue or another troublesome event, be sure to search the logs for information about the application or event. Sometimes the cure for the problem is presented to you in the form of a message generated by the application itself.
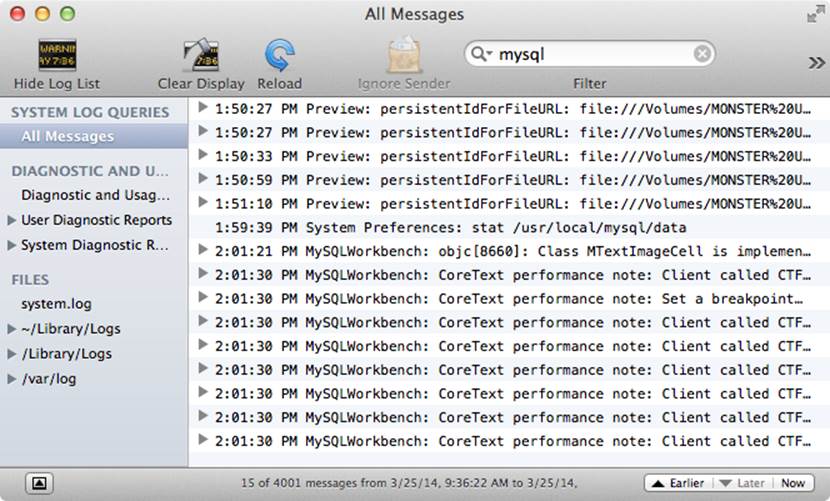
Figure 10-17. The Console application
Activity Monitor
Unlike the static nature of the previously described tools, the Activity Monitor is a dynamic tool that gives you information about the system as it is running. The bulk of the data you will need to treat performance issues can be found in the Activity Monitor. Indeed, you will see information comparable to every tool presented in the Linux and Unix section as you explore the Activity Monitor: information about the CPU, system memory, disk activity, disk usage, and network interfaces.
With the Activity Monitor, for example, you can find out which processes are running and how much memory they are using as well as the percentage of CPU time each is consuming. In this case, the use is analogous to the top command from Linux.
The CPU display shows useful data such as the percentage of time spent executing in user space (user time), the percentage spent in system space (system time), and the percentage of time spent idle. This screen also displays the number of threads and processes running, along with a color-coded graph displaying an aggregate of the user and system time. Combined with the top-like display, this can be an excellent tool if you are investigating problems related to CPU-bound processes.
Figure 10-18 shows the Activity Monitor displaying a CPU report.
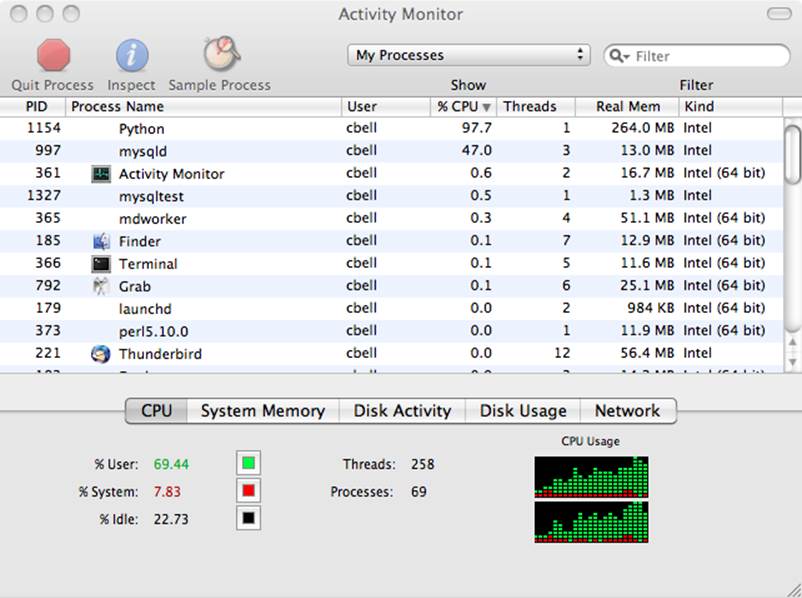
Figure 10-18. The Activity Monitor’s CPU display
Notice that there is a Python script that, at the time of the sampling, was consuming a considerable portion of the CPU time. In this case, the system was running a Bazaar branch in a terminal window. The Activity Monitor shows why my system gets sluggish when branching a code tree.
You can double-click a process to get more information about it. You can also cancel a process either in a controlled manner or by forcing it to quit. Figure 10-19 shows an example of the process inspection dialog.
NOTE
You can export the list of processes by selecting File→Save. You can save the list of processes either as a text file or as an XML file. Some Apple professionals may ask for the process list in addition to the System Profiler report when diagnosing problems.
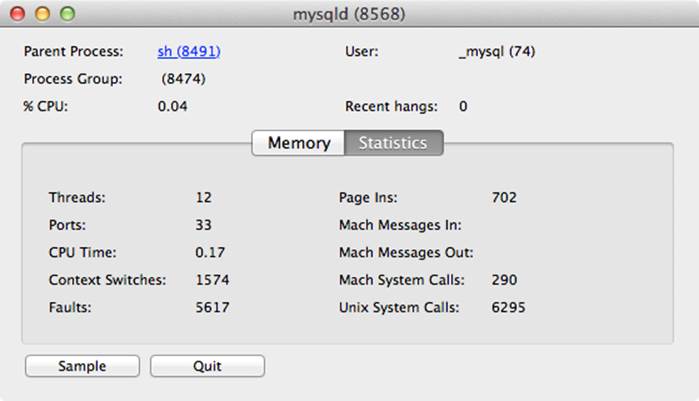
Figure 10-19. The Activity Monitor’s process inspection dialog
The System Memory display (Figure 10-20) shows information about the distribution of memory. It shows how much memory is free, how much memory cannot be cached and must stay in RAM (in other words, the wired memory), how much is being used, and how much is inactive. With this report, you can see at a glance whether you have a memory issue.
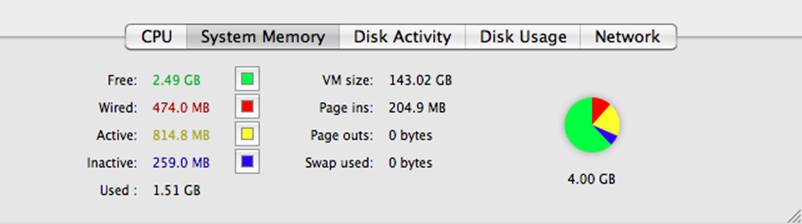
Figure 10-20. The Activity Monitor’s System Memory display
The Disk Activity display (Figure 10-21) shows the disk activity for all of your disks. Shown in the first column are the total number of data transfers from (reads in) and to (writes out) disk along with disk performance for reads and writes per second. The next column shows the total size of the data read from and written to disk along with the throughput for each. Included is a graph that displays reads and writes over time in a color-coded graph.
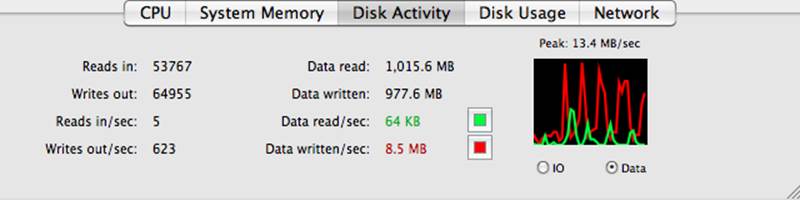
Figure 10-21. The Activity Monitor’s Disk Activity display
The Disk Activity data can tell you whether you invoke a lot of disk accesses and whether the number of reads and writes (and total amount of data) is unusually high. An unusually high value could indicate you may have to run processes at different times so they do not compete for the disk or you may have to add another disk to balance the load.
The Disk Usage display (Figure 10-22) shows the used and free space for each of your drives. It also shows a color-coded pie chart to give you a quick view of the disk utilization. You can view another disk by selecting the disk in the drop-down list.
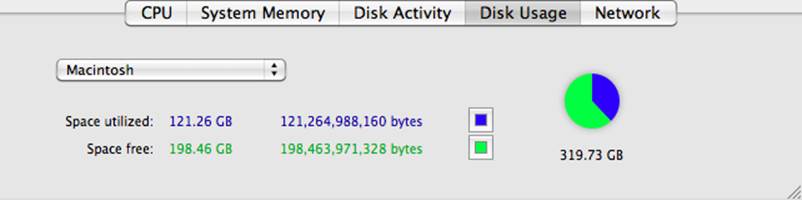
Figure 10-22. The Activity Monitor’s Disk Usage display
This display allows you to monitor the free space on your disk so you know when to add more disks and/or extend partitions to add more space when you run low.
The Network display (Figure 10-23) shows a lot of information about how your system is communicating with the network. Shown in the first column is how many packets were read or received (packets in) and written or sent (packets out) over the network. There are also performance statistics measured in packets per second for reads and writes. The next column shows the size of the data read and written on the network along with the transfer rate for each direction. A color-coded chart shows the relative performance of the network. Note the peak value over the chart. You can use the data on this display to determine whether a process is consuming the maximum bandwidth of your system’s network interfaces.
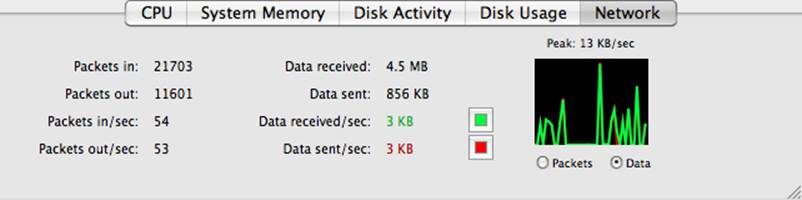
Figure 10-23. The Activity Monitor’s Network display
This section has given you a window into the powerful monitoring tools available on Mac OS X. It’s not a complete tutorial, but it will get you started with monitoring a Mac OS X system. For complete details about each of the applications shown, be sure to consult the documentation provided by Apple on the Help menu of each application.
Microsoft Windows Monitoring
Windows is saddled with the reputation of lacking tools; some have called its monitoring counterintuitive. The good news is the barriers to monitoring a Windows system are a myth. In fact, Windows comes with some very powerful tools, including a scheduler for running tasks. You can take performance snapshots, examine errors in the Event Viewer (the Windows equivalent of logs), and monitor performance in real time.
NOTE
The images shown in this section were taken from several Windows machines. The tools do not differ much in Windows XP or newer versions, including Windows Server 2008 and Windows 8. However, there are differences in accessing the tools in Windows 7 and later, and these differences are noted for each tool.
Indeed, there are a great many tools available to the Windows administrator. We won’t try to cover them all here, but instead we’ll focus on tools that let you monitor a Windows system in real time. Let’s examine some of the basic reporting tools first.
The following are the most popular tools you can use to diagnose and monitor performance issues in Windows:
§ Windows Experience Index
§ System Health Report
§ Event Viewer
§ Task Manager
§ Reliability Monitor
§ Performance Monitor
An excellent source for information about Microsoft Windows performance, tools, techniques, and documentation can be found at the Microsoft Technet website.
The Windows Experience
If you want a quick glance at how your system is performing compared to the expectations of Microsoft’s hardware performance indexes, you can run the Windows Experience report.
To launch the report, click Start, then select Control Panel→System and Maintenance→Performance Information and Tools. You will have to acknowledge the User Account Control (UAC) to continue.
You can also access the System Health Report using the search feature on the Start menu. Click Start and enter “performance” in the search box, then click Performance Information and Tools. Click Advanced Tools and then click the link “Generate a system health report” at the bottom of the dialog. You will have to acknowledge the UAC to continue.
NOTE
Microsoft has changed the Windows Experience in Windows 7. The report is very similar to that of earlier Windows versions, but it supplies more information that you can use to judge the performance of your system.
The report is run once after installation, but you can regenerate the report by clicking Update My Score.
This report rates five areas of your system’s performance: processor (CPU), memory, video controller (graphics), video graphics accelerator (gaming graphics), and the primary hard drive. Figure 10-24 shows an example of the Windows Experience report.
There is a little-known feature of this report you may find valuable—click on the link “Learn how you can improve your computer’s performance” to get a list of best practices for improving each of these scores.
NOTE
You should run this report and regenerate the metrics every time you change the configuration of your system. This will help you identify situations where configuration changes affect the performance of your server.
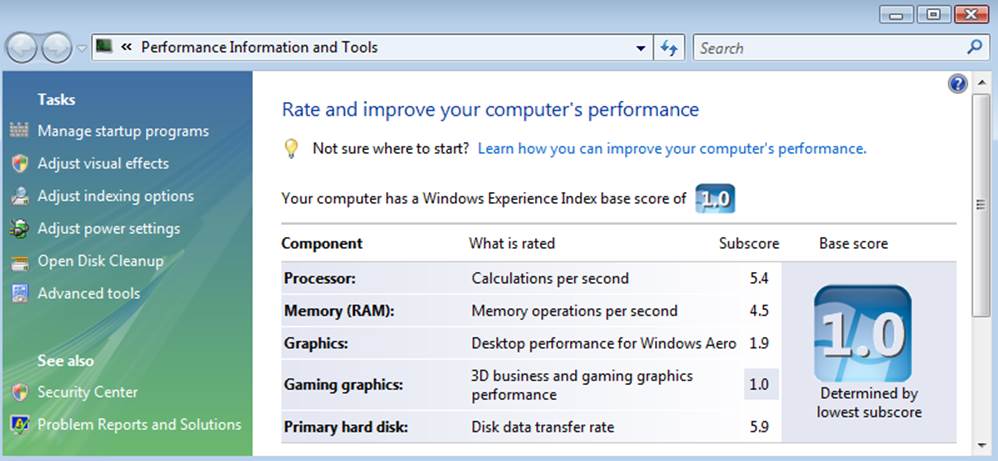
Figure 10-24. The Windows Experience report
The best use for this tool is to get a general impression of how your system is performing without analyzing a ton of metrics. A low score in any of the categories can indicate a performance issue. If you examine the report in Figure 10-24, for instance, you will see that the system has a very low graphics and gaming graphics score. This is not unexpected for a Windows system running as a virtual machine or a headless server, but it might be alarming to someone who just shelled out several thousand dollars for a high-end gaming system.
The System Health Report
One of the unique features and diagnostic improvements in Windows Vista and later is the ability to generate a report that takes a snapshot of all of the software, hardware, and performance metrics for your system. It is analogous to the System Profiler of Mac OS X, but also contains performance counters.
To launch the System Health Report, click Start, then select Control Panel→System and Maintenance→Performance Information and Tools. Next, select Advanced Tools, then click the link “Generate a system health report” at the bottom of the dialog. You will have to acknowledge the UAC to continue.
You can also access the System Health Report using the search feature on the Start menu. Click Start and enter “performance” in the search box, then click Performance Information and Tools. Click Advanced Tools and select the link “Generate a system health report” at the bottom of the dialog. Another way to access the System Health Report is to use the search feature on the Start menu. Click Start and enter “system health report” in the search box, then click the link in the Start menu. You will have to acknowledge the UAC to continue. Figure 10-25 shows an example of the System Health Report.
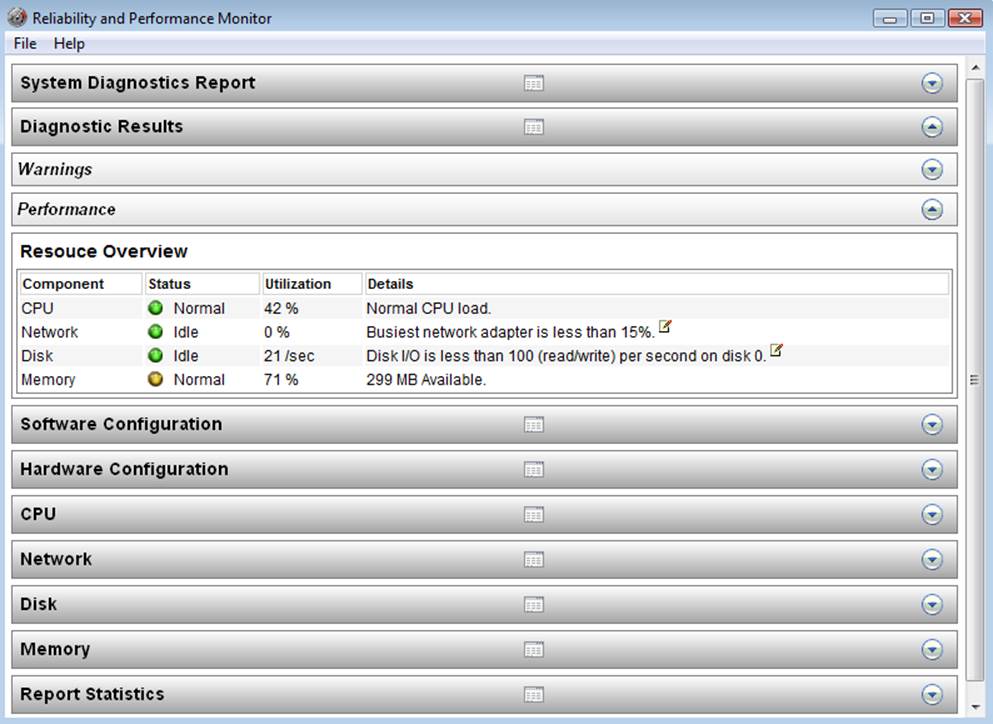
Figure 10-25. The System Health Report
This report has everything—all of the hardware, software, and many other aspects of your system are documented here. Notice the report is divided into sections that you can expand or collapse for easier viewing. The following list briefly describes the information displayed by each section:
System Diagnostics Report
The system name and the date the report was generated.
Diagnostic Results
Warning messages generated while the report was being run, identifying potential problem areas on your computer. Also included is a brief overview of the performance of your system at the time the report was run.
Software Configuration
A list of all of the software installed on your system, including system security settings, system services, and startup programs.
Hardware Configuration
A list of the important metadata for disk, CPU performance counters, BIOS information, and devices.
CPU
A list of the processes running at report time and metadata about system components and services.
Network
Metadata about the network interfaces and protocols on your system.
Disk
Performance counters and metadata about all of the disk devices.
Memory
Performance counters for memory, including the process list and memory usage.
Report Statistics
General information about the system when the report was run, such as processor speed and the amount of memory installed.
The System Health Report is your key to understanding how your system is configured and is performing at a glance. It is a static report, representing a snapshot of the system.
There is a lot of detailed information in the Hardware Configuration, CPU, Network, Disk, and Memory sections. Feel free to explore those areas for greater details about your system.
The best use of this tool, beyond examining the performance counters, is to save the report for later comparison to other reports when your system is performing poorly. You can save an HTML version of the report by selecting File→Save As.
You can use the saved report as a baseline for performance of your system. If you generate the report several times over the course of low, medium, and high usage, you should be able to put together a general expectation for performance. These expectations are important because you can use them to determine whether your performance issues are within the bounds of expectations. When a system enters a period of unusually high load during a time when it is expected to have a low load, the users’ experience may generate complaints. If you have these reports to compare to, you can save yourself a lot of time investigating the exact source of the slowdown.
The Event Viewer
The Windows Event Viewer shows all the messages logged for application, security, and system events. It is a great source of information about events that have occurred (or continue to occur) and should be one of the primary tools you use to diagnose and monitor your system.
You can accomplish a great deal with the Event Viewer. For example, you can generate custom views of any of the logs, save the logs for later diagnosis, and set up alerts for specific events in the future. We will concentrate on viewing the logs. For more information about the Event Viewer and how you can set up custom reports and subscribe to events, consult your Windows help files.
To launch the Event Viewer, click the Start button, then right-click Computer and choose Manage. You will have to acknowledge the UAC to continue. You can then click the Event Viewer link in the left panel. You can also launch the Event Viewer by clicking Start, typing “event viewer,” and pressing Enter.
The dialog has three panes by default. The left pane is a tree view of the custom views, logfiles, and applications and services logs. The logs are displayed in the center pane, and the right pane contains the Action menu items. The log entries are sorted, by default, in descending order by date and time. This allows you to see the most recent messages first.
NOTE
You can customize the Event Viewer views however you like. You can even group and sort events by clicking on the columns in the log header.
Open the tree for the Windows logs to see the base logfiles for the applications, security, and system (among others). Figure 10-26 shows the Event Viewer open and the log tree expanded.
The logs available to view and search include:
Application
All messages generated from user applications as well as operating system services. This is a good place to look when diagnosing problems with applications.
Security
Messages related to access and privileges exercised, as well as failed attempts to access any secure object. This can be a good place to look for application failures related to username and password issues.
Setup
Messages related to application installation. This is the best place to look for information about failures to install or remove software.
System
Messages about device drivers and Windows components. This can be the most useful set of logs for diagnosing problems with devices or the system as a whole. It contains information about all manner of devices running at the system level.
Forwarded Events
Messages forwarded from other computers. Consult the Windows documentation about working with remote event logging.
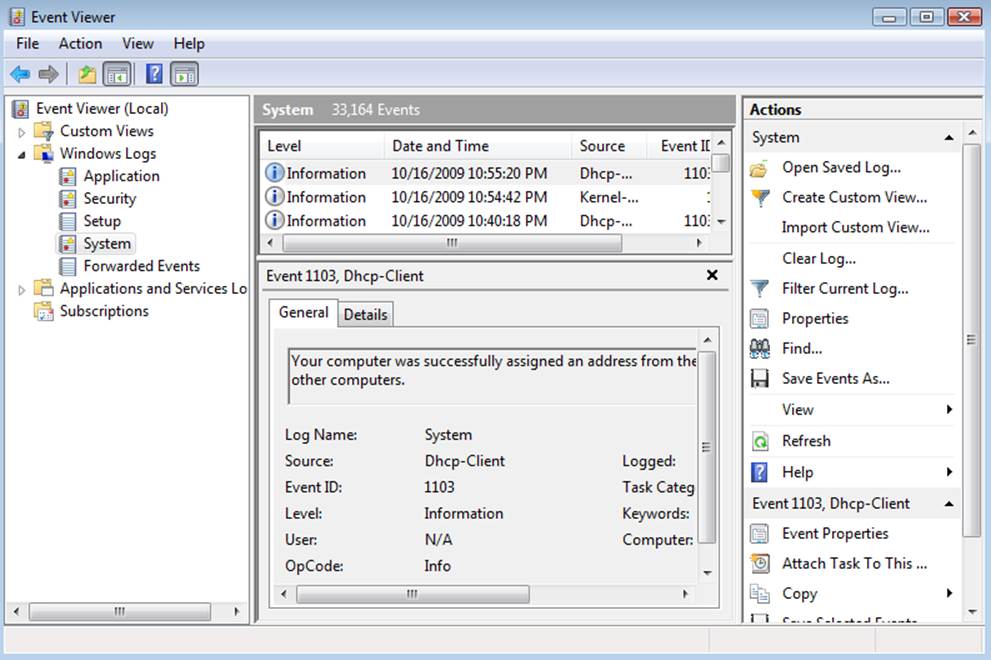
Figure 10-26. The Windows Event Viewer
Digging through these logs can be challenging, because many of them display information that is interesting to developers and not readable by mere mortals. To make things easier, you can search any of the logs by clicking the Find operation in the Actions pane and entering a text string. For example, if you are concerned about memory issues, you can enter “memory” to filter all of the log entries for ones containing the string “memory,” which will then be shown in the center pane.
TIP
You can also click the Details tab to make things easier to read.
Each log message falls into one of the following three categories (these apply to user processes, system components, and applications alike):
Error
Indicates a failure of some magnitude, such as a failed process, out-of-memory problem, or system fault.
Warning
Indicates a less serious condition or event of note, such as low memory or low disk space.
Information
Conveys data about an event. This is generally not a problem, but it could provide additional information when diagnosing problems, such as when a USB drive was removed.
To view a log, open the corresponding tree in the left pane. To view the details about any message, click on the message. The message will be displayed below the log entries, as shown in Figure 10-26. In the lower part of the center pane, you can click the General tab to see general information about the message, such as the statement logged, when it occurred, what log it is in, and the user who was running the process or application. You can click the Details tab to see a report of the data logged. You can view the information as text (Friendly View) or XML (XML View). You can also save the information for later review; the XML View is useful to pass the report to tools that recognize the format.
The Reliability Monitor
The most interesting monitoring tool in Windows is the Reliability Monitor. This is a specialized tool that plots the significant performance and error events that have occurred over time in a graph.
A vertical bar represents each day over a period of time. The horizontal bar is an aggregate of the performance index for that day. If there are errors or other significant events, you will see a red X on the graph. Below the bar is a set of drop-down lists that contain the software installations and removals, any application failures, hardware failures, Windows failures, and any additional failures.
This tool is great for checking the performance of the system over a period of time. It can help diagnose situations when an application or system service has performed correctly in the past but has started performing poorly, or when a system starts generating error messages. The tool can help locate the day the event first turned up, as well as give you an idea of how the system was performing when it was running well.
Another advantage of this tool is that it gives you a set of daily baselines of your system over time. This can help you diagnose problems related to changing device drivers (one of the banes of Windows administration), which could go unnoticed until the system degrades significantly.
In short, the Reliability Monitor gives you the opportunity to go back in time and see how your system was performing. The best part of all? You don’t have to turn it on—it runs automatically, gleaning much of its data from the logs, and therefore automatically knowing your system’s history.
NOTE
One big source of problems on Windows is connecting and configuring hardware. We will not discuss this subject here, as it can easily fill a book in its own right. The good news is there is a plethora of information about Windows on the Internet. Try googling for your specific driver or hardware to see the most popular hits. You can also check out the Microsoft support forums. Another excellent resource and host of some popular Windows tools is Sysinternals.
You can access the Reliability Monitor by clicking Start, typing “reliability,” and pressing Enter or clicking on Reliability and Performance Monitor. You will have to acknowledge the UAC. Click Reliability Monitor in the tree pane on the left. Figure 10-27 shows an example of the Reliability Monitor.
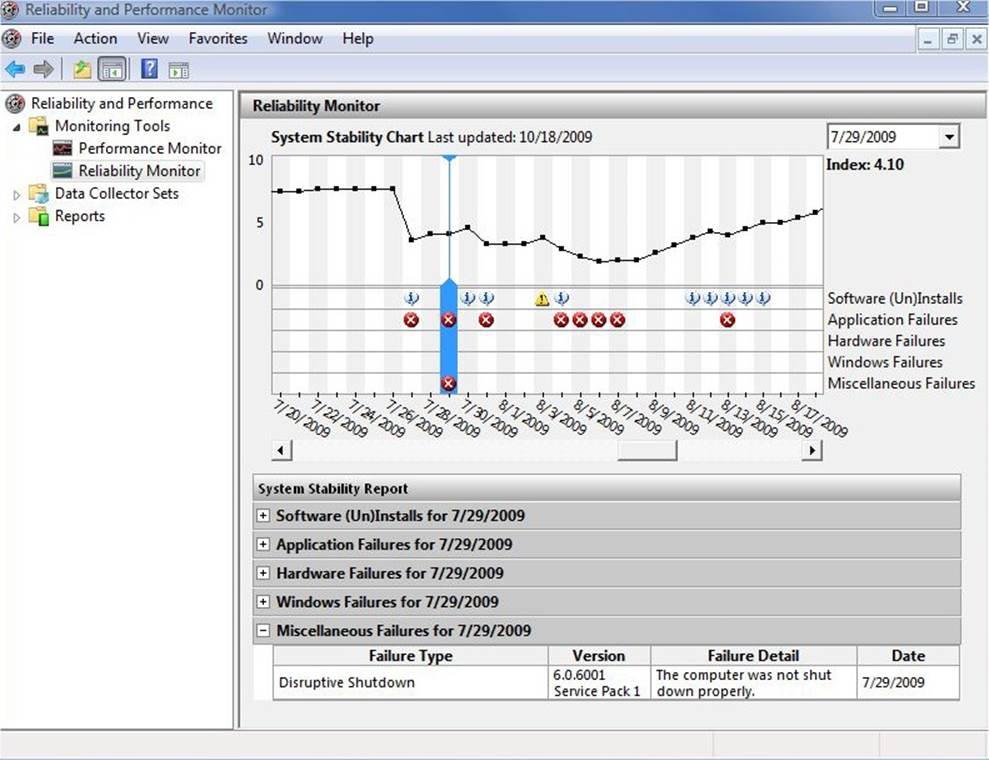
Figure 10-27. The Reliability Monitor
In Windows 7, you can launch the Reliability Monitor by clicking Start, typing “action center” in the search box, and pressing Enter. You can then select Maintenance → View reliability report. The report differs from previous versions of Windows, but offers the same information in a tidier package. For example, instead of the drop-down lists, the new Reliability Monitor report lists known incidents in a single list.
The Task Manager
The Windows Task Manager (shown in Figure 10-28) displays a dynamic list of running processes. It has been around for a long time and has been improved over various versions of Windows.
The Task Manager offers a tabbed dialog with displays for running applications, processes (this is most similar to the Linux top command), services active on the system, a CPU performance meter, a network performance meter, and a list of users. Unlike some other reports, this tool generates its data dynamically, refreshing periodically. This makes the tool a bit more useful in observing the system during periods of low performance.
The reports display the same information as the System Health Report, but in a much more compact form, and are updated continuously. You can find all of the critical metrics needed to diagnose performance issues with CPU, resource-hogging processes, memory, and the network. Conspicuously missing is a report on disk performance.
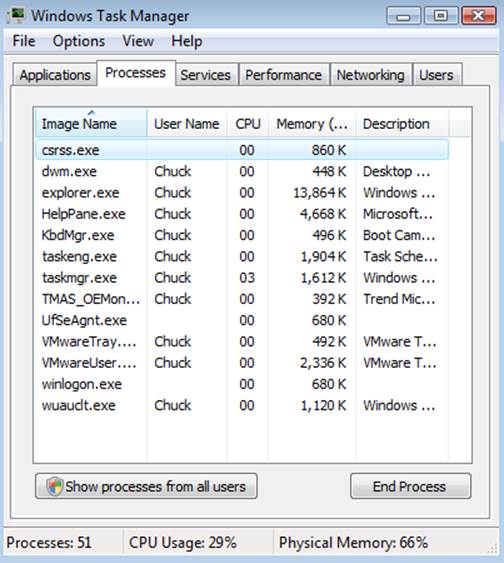
Figure 10-28. The Task Manager
One of the interesting features of the Task Manager is that it shows a miniature performance meter in the notification area on the Start bar that gives you a chance to watch for peaks in usage. You can launch the Task Manager any time by pressing Ctrl+Alt+Del and choosing Task Manager from the menu.
WARNING
Running a dynamic performance monitoring tool consumes resources and can affect a system that already suffers poor performance.
The Performance Monitor
The Performance Monitor is the premier tool for tracking performance in a Windows system. It allows you to select key metrics and plot their values over time. It can also store the session so you can later review it and create a baseline for your system.
The Performance Monitor has metrics for just about everything in your system. There are counters for many of the smaller details having to do with the basic areas of performance: CPU, memory, disk, and network. There are a great many other categories as well.
To launch the Performance Monitor, click Start, then select Control Panel→System and Maintenance→Performance Information and Tools. Click Advanced Tools and then click the link Open Reliability and Performance Monitor near the middle of the dialog. You will have to acknowledge the UAC to continue. Click Reliability Monitor in the tree pane on the left to access the Performance Monitor feature.
You can also launch the Performance Monitor by clicking Start, typing “reliability,” and pressing Enter or clicking on Reliability and Performance Monitor. You will have to acknowledge the UAC. Click Reliability Monitor in the tree pane on the left to access the Performance Monitor feature. Figure 10-29 shows an example of the Performance Monitor.
Microsoft has two levels of metrics: objects that offer a high-level view of an area such as the processor or memory, and counters that represent a specific detail of the system. Thus, you can monitor the CPU’s performance as a whole or watch the finer details, such as percentage of time idle or the number of user processes running. Add these objects or counters to the main chart by clicking the green plus sign on the toolbar. This opens a dialog that allows you to choose from a long list of items to add to the chart. Adding the items is a simple matter of selecting the object and expanding the drop-down list on the left, then dragging the desired object to the list on the right.
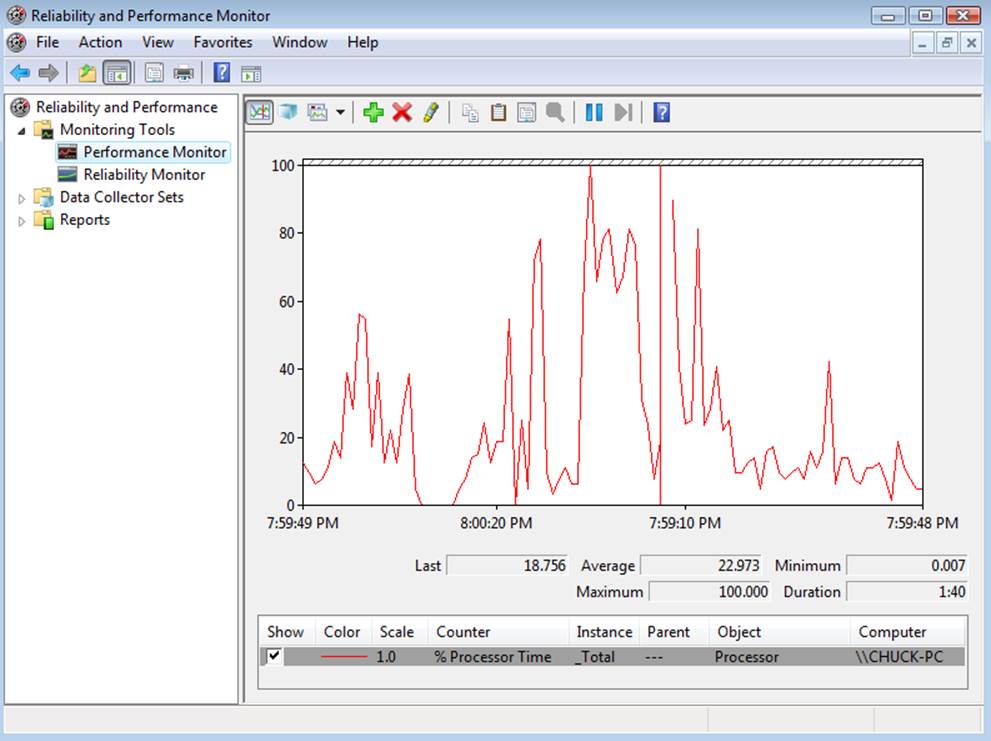
Figure 10-29. The Performance Monitor
You can add as many items as you want; the chart will change its axis accordingly. If you add too many items to track or the values are too diverse, however, the chart may become unreliable. It is best to stick to a few related items at a time (such as only memory counters) to give you the best and most meaningful chart.
A full description of the features of the Performance Monitor is well beyond the scope of this chapter. We encourage you to investigate additional features such as Data Collector Sets and changing the chart’s display characteristics. There are many excellent texts that describe these features and more in great detail.
The versatility of the Performance Monitor makes it the best choice for forming baselines and recording the behavior of the system over time. You can use it as a real-time diagnostic tool.
NOTE
If you have used the Reliability or Performance Monitor, you may have noticed a seldom-commented-on feature called the Resource Overview. This is the default view of the Reliability and Performance Monitor. It provides four dynamic performance graphs for CPU, disk, network, and memory. Below the graphs are drop-down detail panes containing information about these areas. This report is an expanded form of the Task Manager performance graphs and provides yet another point of reference for performance monitoring and diagnosis on Microsoft Windows.
This brief introduction to monitoring performance on Microsoft Windows should persuade you that the belief that Microsoft’s Windows platform is difficult to monitor and lacks sophisticated tools is a myth. The tools are very extensive (some could argue too much so) and provide a variety of views of your system’s data.
Monitoring as Preventive Maintenance
The techniques discussed so far give you a snapshot of the status of the system. However, most would agree that monitoring is normally an automated task that samples the available statistics for anomalies. When an anomaly is found, an alert is sent to an administrator (or group of administrators) to let someone know there may be a problem. This turns the reactive task of checking the system status into a proactive task.
A number of third-party utilities combine monitoring, reporting, and alerts into easy-to-use interfaces. There are even monitoring and alert systems for an entire infrastructure. For example, Nagios can monitor an entire IT infrastructure and set up alerts for anomalies.
There are also monitoring and alert systems available either as part of or an add-on for operating systems and database systems. We will examine the Enterprise Monitor for MySQL in Chapter 16.
Conclusion
There are a great many references on both performance tuning and security monitoring. This chapter provides a general introduction to system monitoring. While it is not comprehensive, the material presented is an introduction to the tools, techniques, and concepts of monitoring your operating system and server performance. In the next chapter, we will take on the task of monitoring a MySQL system and discuss some common practices to help keep your MySQL system running at peak performance.
“Joel!”
He knew that voice and that tone. Joel’s boss was headed his way and about to conduct another drive-by tasking. He turned to face his office door as his boss stepped through it. “Did you read Sally’s email about the slowdown?”
Joel recalled that Sally was one of the employees who sent him a message asking why her application was running slowly. He had just finished checking the low-hanging fruit—there was plenty of memory and disk space wasn’t an issue.
“Yes, I was just looking into the problem now.”
“Make it your top priority. Marketing has a deadline to produce their quarterly sales projections. Let me know what you find.” His boss nodded once and stepped away.
Joel sighed and returned to examining the reports on CPU usage while wondering how to describe technology to the nontechnical.
All materials on the site are licensed Creative Commons Attribution-Sharealike 3.0 Unported CC BY-SA 3.0 & GNU Free Documentation License (GFDL)
If you are the copyright holder of any material contained on our site and intend to remove it, please contact our site administrator for approval.
© 2016-2026 All site design rights belong to S.Y.A.