MySQL High Availability (2014)
Part II. Monitoring and Managing
Chapter 11. Monitoring MySQL
Joel had a feeling today was going to be a better day. Everything was going well: the performance measurements for the servers were looking good and the user complaints were down. He had successfully reconfigured the server and improved performance greatly. There was only one application still performing poorly, but he was sure it wasn’t a hardware- or operating-system-related problem; more likely, it was an issue with a poorly written query. Nevertheless, he had sent his boss an email message explaining his findings and that he was working on the remaining problems.
Joel heard quickened footsteps approaching his office. He instinctively looked toward his door, awaiting the now-routine appearance of his boss. He was shocked as Mr. Summerson zipped by without so much as a nod in his direction.
He shrugged his shoulders and returned to reading his email messages. Just then a new message appeared with “HIGH PRIORITY” in the subject line in capital letters. It was from his boss. Chiding himself for holding his breath, Joel relaxed and opened the message. He could hear his boss’s voice in his mind as he read through the message.
“Joel, good work on those reports. I especially like the details you included about memory and disk performance. I’d like you to generate a similar report about the database server. I’d also like you to look into a problem one of the developers is having with a query. Susan will send you the details.”
With a deep sigh, Joel once again opened his favorite MySQL book to learn more about monitoring the database system. “I hope it has something about drilling down into individual components,” he mumbled, knowing he needed to get up to speed quickly on an advanced feature of MySQL.
Now that you understand how monitoring works and how to keep your host’s operating systems at peak efficiency, how do you know whether your MySQL servers are performing at their peak efficiency? Better still, how do you know when they aren’t?
In this chapter, we begin with a look at monitoring MySQL, a brief discussion of monitoring techniques for MySQL, and the taxonomy of monitoring MySQL, and then move on to monitoring and improving performance in your databases. We conclude with a look into best practices for improving database performance.
What Is Performance?
Before we begin discussions about database performance and general best practices for monitoring and tuning a MySQL server, it is important to define what we mean by performance. For the purposes of this chapter, good performance is defined as meeting the needs of the user such that the system performs as expediently as the user expects, whereas poor performance is defined as anything less. Typically, good performance means that response time and throughput meet the users’ expectations. While this may not seem very scientific, savvy administrators know the best gauge of how well things are going is the happiness of the users.
That doesn’t mean we don’t measure performance. On the contrary, we can and must measure performance in order to know what to fix, when, and how. Furthermore, if you measure performance regularly, you can even predict when your users will begin to be unhappy. Your users won’t care if you reduce your cache hit rate by 3%, beating your best score to date. You may take pride in such things, but metrics and numbers are meaningless when compared to the user’s experience at the keyboard.
There is a very important philosophy that you should adopt when dealing with performance. Essentially, you should never adjust the parameters of your server, database, or storage engine unless you have a deliberate plan and a full understanding of the expectations of the change as well as the consequences. More important, never adjust without measuring the effects of the change over time. It is entirely possible that you can improve the performance of the server in the short run but negatively impact performance in the long run. Finally, you should always consult references from several sources, including the reference manuals.
Now that we’ve issued that stern warning, let’s turn our attention to monitoring and improving performance of the MySQL server and databases.
NOTE
Administrators monitoring MySQL almost always focus on improving performance. Certainly performance is important, in terms of how long the user must wait for a query to execute. But monitoring can also check for the exhaustion of resources, or a high demand for those resources which can cause timeouts or other failures to get access to your server.
MySQL Server Monitoring
Managing the MySQL server falls in the category of application monitoring. This is because most of the performance parameters are generated by the MySQL software and are not part of the host operating system. As mentioned previously, you should always monitor your base operating system in tandem with monitoring MySQL because MySQL is very sensitive to performance issues in the host operating system.
There is an entire chapter in the online MySQL Reference Manual that covers all aspects of monitoring and performance improvement, intriguingly titled “Optimization.” Rather than repeat the facts and rhetoric of that excellent reference, we will discuss a general approach to monitoring the MySQL server and examine the various tools available.
This section is an introduction to the finer details of monitoring the MySQL server. We’ll start with a short discussion of how to change and monitor the behavior of the system, then discuss monitoring primarily for the purposes of diagnosing performance issues and forming a performance benchmark. We will also discuss best practices for diagnosing performance issues and take a look at monitoring the storage engine sublayer in MySQL—an area not well understood or covered by other reference sources.
How MySQL Communicates Performance
There are two mechanisms you can use to govern and monitor behavior in the MySQL server. You use server variables to control behavior and status variables to read behavior configuration and statistical information regarding features and performance.
There are many variables you can use to configure the server. Some can be set only at startup (called startup options, which can also be set in option files). Others can be set at the global level (across all connections), the session level (for a single connection), or both the global and session levels.
You can read server variables using the following commands:
SHOW [GLOBAL | SESSION] VARIABLES;
You can change those variables that are not static (read-only) using the following commands (you can include multiple settings on a single line using a comma separator):
SET [GLOBAL | SESSION] variable_name = value;
SET [@@global. | @@session. | @@]variable_name = value;
NOTE
Session variable settings are not persistent beyond the current connection and are reset when the connection is closed.
You can read status variables using the following commands—the first two commands display the value of all local or session scope variables (the default is session) and the third command displays those variables that are global in scope:
SHOW STATUS;
SHOW SESSION STATUS;
SHOW GLOBAL STATUS;
We discuss how and when to use these commands in the next section.
Two of the most important commands for discovering information about the server and how it is performing are SHOW VARIABLES and SHOW STATUS. There are a great many variables (over 290 status variables alone). The variable lists are generally in alphabetical order and are often grouped by feature. However, sometimes the variables are not neatly arranged. Filtering the command by a keyword through the LIKE clause can produce information about the specific aspects of the system you want to monitor. For example, SHOW STATUS LIKE '%thread%' shows all ofthe status variables related to thread execution.
Performance Monitoring
Performance monitoring in MySQL is the application of the previous commands—specifically, setting and reading system variables and reading status variables. The SHOW and SET commands are only two of the possible tools you can use to accomplish the task of monitoring the MySQL server.
Indeed, there are several tools you can use to monitor your MySQL server. The tools available in the standard distributions are somewhat limited in that they are console tools and include special commands you can execute from a MySQL client (e.g., SHOW STATUS) and utilities you can run from a command line (e.g., mysqladmin).
NOTE
The MySQL client tool is sometimes called the MySQL monitor, but should not be confused with a monitoring tool.
There are also GUI tools available that make things a little easier if you prefer or require such options. In particular, you can download the MySQL GUI tools, which include advanced tools that you can use to monitor your system, manage queries, and migrate your data from other database systems.
We begin by examining how to use the SQL commands and then discuss the MySQL Workbench tool. We also take a look at one of the most overlooked tools available to the administrator: the server logs.
Some savvy administrators may consider the server logs the first and primary tool for administering the server. Although they are not nearly as vital for performance monitoring, they can be an important asset in diagnosing performance issues.
SQL Commands
All of the SQL monitoring commands could be considered variants of the SHOW command, which displays internal information about the system and its subsystems. For example, one pair of commands that can be very useful in monitoring replication is SHOW MASTER STATUS and SHOW SLAVE STATUS. We will examine these in more detail later in this chapter.
TIP
Many of these commands can be achieved by querying the INFORMATION_SCHEMA tables directly. See the online MySQL Reference Manual for more details about the INFORMATION_SCHEMA database and its features.
While there are many forms of the SHOW command, the following are the most common SQL commands you can use to monitor the MySQL server:
SHOW INDEX FROM table
Describes the indexes in the table. This can let you know whether you have the right indexes for the way your data is used.
SHOW PLUGINS
Displays the list of all known plug-ins. It shows the name of the plug-in and its current status. The storage engines in newer releases of MySQL are implemented as plug-ins. Use this command to get a snapshot of the currently available plug-ins and their status. While not directly related to monitoring peformance, some plug-ins supply system variables. Knowing which plug-ins are installed can help determine whether you can access plug-in−specific variables.
SHOW [FULL] PROCESSLIST
Displays data for all threads (including those handling connections to clients) running on the system. This command resembles the process commands of the host operating system. The information displayed includes connection data along with the command executing, how long it has been executing, and its current state. Like the operating system command it resembles, it can diagnose poor response (too many threads), a zombie process (long running or nonresponding), or even connection issues. When dealing with poor performance or unresponsive threads, use theKILL command to terminate them. The default behavior is to show the processes for the current user. The FULL keyword displays all processes.
NOTE
You must have the SUPER privilege to see all processes running on the system.
SHOW [GLOBAL | SESSION] STATUS
Displays the values of all of the system variables. You will probably use this command more frequently than any other. Use this command to read all of the statistical information available on the server. Combined with the GLOBAL or SESSION keyword, you can limit the display to those statistics that are global- or session-only.
SHOW TABLE [FROM db ] STATUS
Displays detailed information about the tables in a given database. This includes the storage engine, collation, creation data, index data, and row statistics. You can use this command along with the SHOW INDEX command to examine tables when diagnosing poorly performing queries.
SHOW [GLOBAL | SESSION] VARIABLES
Displays the system variables. These are typically configuration options for the server. Although they do not display statistical information, viewing the variables can be very important when determining whether the current configuration has changed or if certain options are set. Some variables are read-only and can be changed only via the configuration file or the command line on startup, while others can be changed globally or set locally. You can combine this command with the GLOBAL or SESSION keyword to limit the display to those variables that are global- or session-only.
LIMITING THE OUTPUT OF SHOW COMMANDS
The SHOW commands in MySQL are very powerful. However, they often display too much information. This is especially true for the SHOW STATUS and SHOW VARIABLES commands.
To see less information, you can use the LIKE pattern clause, which limits the output to rows matching the pattern specified. The most common example is using the LIKE clause to see only variables for a certain subset, such as replication or logging. You can use the standard MySQL pattern symbols and controls in the LIKE clause in the same manner as a SELECT query.
For example, the following displays the status variables that include the name “log”:
mysql> SHOW SESSION STATUS LIKE '%log%';
+--------------------------+-------+
| Variable_name | Value |
+--------------------------+-------+
| Binlog_cache_disk_use | 0 |
| Binlog_cache_use | 0 |
| Com_binlog | 0 |
| Com_purge_bup_log | 0 |
| Com_show_binlog_events | 0 |
| Com_show_binlogs | 0 |
| Com_show_engine_logs | 0 |
| Com_show_relaylog_events | 0 |
| Tc_log_max_pages_used | 0 |
| Tc_log_page_size | 0 |
| Tc_log_page_waits | 0 |
+--------------------------+-------+
11 rows in set (0.11 sec)
The commands specifically related to storage engines include the following:
SHOW ENGINE engine_name LOGS
Displays the log information for the specified storage engine. The information displayed is dependent on the storage engine. This can be very helpful in tuning storage engines. Some storage engines do not provide this information.
SHOW ENGINE engine_name STATUS
Displays the status information for the specified storage engine. The information displayed depends on the storage engine. Some storage engines display more information than others. For example, the InnoDB storage engine displays dozens of status variables, while the NDB storage engine shows a few, and the MyISAM storage engine displays no information. This command is the primary mechanism for viewing statistical information about a given storage engine and can be vital for tuning certain storage engines (e.g., InnoDB).
NOTE
Older synonyms for the SHOW ENGINE commands (SHOW engine LOGS and SHOW engine STATUS) have been deprecated. Also, these commands can display information only on certain engines, including InnoDB and Performance_Schema.
SHOW ENGINES
Displays a list of all known storage engines for the MySQL release and their status (i.e., whether the storage engine is enabled). This can be helpful when deciding which storage engine to use for a given database or in replication to determine if the same storage engines exist on both the master and the slave.
The commands specifically related to MySQL replication include:
SHOW BINLOG EVENTS [IN log_file] [FROM pos] [LIMIT offset row_count]
Displays the events as they were recorded to the binary log. You can specify a logfile to examine (omitting the IN clause tells the system to use the current logfile), and limit output to the last events from a particular position or to the first number of rows after an offset into the file. This command is the primary command used in diagnosing replication problems. It comes in very handy when an event occurs that disrupts replication or causes an error during replication.
NOTE
If you do not use a LIMIT clause and your server has been running and logging events for some time, you could get a very lengthy output. If you need to examine a large number of events, you should consider using the mysqlbinlog utility instead.
SHOW BINARY LOGS
Displays the list of the binary logs on the server. Use this command to get information about past and current binlog filenames. The size of each file is also displayed. This is another useful command for diagnosing replication problems because it will permit you to specify the binlog file for the SHOW BINLOG EVENTS command, thereby reducing the amount of data you must explore to determine the problem. The SHOW MASTER LOGS command is a synonym.
SHOW RELAYLOG EVENTS [IN log_file] [FROM pos] [LIMIT offset row_count]
Available in MySQL version 5.5.0, this command does the same thing as SHOW BINLOG EVENTS, only with relay logs on the slave. If you do not supply a filename for the log, events from the first relay log are shown. This command has no effect when run on the master.
SHOW MASTER STATUS
Displays the current configuration of the master. It shows the current binlog file, the current position in the file, and all inclusive or exclusive replication settings. Use this command when connecting or reconnecting slaves.
SHOW SLAVE HOSTS
Displays the list of slaves connected to the master that used the --report-host option. Use this information to determine which slaves are connected to your master.
SHOW SLAVE STATUS
Displays the status information for the system acting as a slave in replication. This is the primary command for tracking the performance and status of your slaves. A considerable amount of information is displayed that is vital to maintaining a healthy slave. See Chapter 3 for more information about this command.
Example 11-1 shows the SHOW VARIABLES command and its output from a recent beta release of MySQL.
Example 11-1. Showing thread status variables
mysql> SHOW VARIABLES LIKE '%thread%';
+----------------------------+---------------------------+
| Variable_name | Value |
+----------------------------+---------------------------+
| innodb_file_io_threads | 4 |
| innodb_read_io_threads | 4 |
| innodb_thread_concurrency | 0 |
| innodb_thread_sleep_delay | 10000 |
| innodb_write_io_threads | 4 |
| max_delayed_threads | 20 |
| max_insert_delayed_threads | 20 |
| myisam_repair_threads | 1 |
| pseudo_thread_id | 1 |
| thread_cache_size | 0 |
| thread_handling | one-thread-per-connection |
| thread_stack | 262144 |
+----------------------------+---------------------------+
12 rows in set (0.00 sec)
This example shows not only those status variables for thread management, but also the thread control for the InnoDB storage engine. Although you sometimes get more information than you expected, a keyword-based LIKE clause is sure to help you find the specific variable you need.
Knowing which variables to change and which variables to monitor can be the most challenging part of monitoring a MySQL server. As mentioned, a great deal of valuable information on this topic is included in the online MySQL Reference Manual.
To illustrate the kinds of features you can monitor in a MySQL server, let us examine the variables that control the query cache. The query cache is one of the most important performance features in MySQL if you use the MyISAM storage engine for your application data. It allows the server to buffer frequently used queries and their results in memory. Thus, the more often a query is run, the more likely it is that the results can be read from the cache rather than reexamining the index structures and tables to retrieve the data. Clearly, reading the results from memory is much faster than reading them from disk every time. This can be a performance improvement if your data is read much more frequently than it is written (updated).
Each time you run a query, it is entered into the cache and has a lifetime governed by how recently it was used (old queries are dumped first) and how much memory there is available for the query cache. Additionally, there are a number of events that can invalidate (remove) queries from the cache.
We include a partial list of these events here:
§ Changes to data or indexes.
§ Subtle differences of the same query that have a different result set, which can cause missed cache hits. Thus, it is important to use standardized queries for commonly accessed data. You will see later in this chapter how views can help in this area.
§ When a query derives data from temporary tables (not cached).
§ Transaction events that can invalidate queries in the cache (e.g., COMMIT).
You can determine whether the query cache is configured and available in your MySQL installation by examining the have_query_cache variable. This is a system variable with global scope, but it is read-only. You control the query cache using one of several variables. Example 11-2shows the server variables for the query cache.
Example 11-2. Query cache server variables
mysql> SHOW VARIABLES LIKE '%query_cache%';
+------------------------------+----------+
| Variable_name | Value |
+------------------------------+----------+
| have_query_cache | YES |
| query_cache_limit | 1048576 |
| query_cache_min_res_unit | 4096 |
| query_cache_size | 33554432 |
| query_cache_type | ON |
| query_cache_wlock_invalidate | OFF |
+------------------------------+----------+
6 rows in set (0.00 sec)
As you can see, there are several things you can change to affect the query cache. Most notable is the ability to temporarily turn off the query cache by setting the query_cache_size variable, which sets the amount of memory available for the query cache. If you set this variable to 0, it effectively turns off the query cache and removes all queries from the cache. This is not related to the have_query_cache variable, which merely indicates that the feature is available. Furthermore, it is not sufficient to set query_cache_type = OFF because it does not deallocate the query cache buffer. You must also set the size to completely turn off the query cache. For more information about configuring the query cache, see the section titled “Query Cache Configuration” in the online MySQL Reference Manual.
You can observe the performance of the query cache by examining several status variables, as shown in Example 11-3.
Example 11-3. Query cache status variables
mysql> SHOW STATUS LIKE '%Qcache%';
+-------------------------+-------+
| Variable_name | Value |
+-------------------------+-------+
| Qcache_free_blocks | 0 |
| Qcache_free_memory | 0 |
| Qcache_hits | 0 |
| Qcache_inserts | 0 |
| Qcache_lowmem_prunes | 0 |
| Qcache_not_cached | 0 |
| Qcache_queries_in_cache | 0 |
| Qcache_total_blocks | 0 |
+-------------------------+-------+
8 rows in set (0.00 sec)
Here we see one of the more subtle inconsistencies in the MySQL server. You can control the query cache using variables that start with query_cache, but the status variables start with Qcache. While the inconsistency was intentional (to help distinguish a server variable from a status variable), oddities like this can make searching for the right items a challenge.
There are many nuances to the query cache that allow you to manage and configure it and monitor its performance. This makes the query cache an excellent example to demonstrate the complexity of monitoring the MySQL server.
For example, you can and should periodically defragment the query cache with the FLUSH QUERY CACHE command. This does not remove results from the cache, but instead allows for internal reorganization to better utilize memory.
While no single volume (or chapter in a broader work) can cover all such topics and nuances of the query cache, the practices described in this chapter therefore are general and are designed to be used with any feature in the MySQL server. However, the specific details may require additional research and a good read through the online MySQL Reference Manual.
The mysqladmin Utility
The mysqladmin command-line utility is the workhorse of the suite of command-line tools. There are many options and tools (called “commands”) this utility can perform. The online MySQL Reference Manual discusses the mysqladmin utility briefly. In this section, we examine the options and tools for monitoring a MySQL server.
The utility runs from the command line, so it allows administrators to script sets of operations much more easily than they can process SQL commands. Indeed, some of the third-party monitoring tools use a combination of the mysqladmin and SQL commands to gather information for display in other forms.
You must specify connection information (user, password, host, etc.) to connect to a running server. The following is a list of commonly used commands (as you will see, most of these have equivalent SQL commands that produce the same information):
status
Displays a concise description of the status of the server, including uptime, number of threads (connections), number of queries, and general statistical data. This command provides a quick snapshot of the server’s health.
extended-status
Displays the entire list of system statistics and is similar to the SQL SHOW STATUS command.
processlist
Displays the list of current processes and works the same way as the SQL SHOW PROCESSLIST command.
kill thread id
Allows you to kill a specified thread. Use this in conjunction with processlist to help manage runaway or hung processes.
variables
Displays the system server variables and values. This is equivalent to the SQL SHOW VARIABLES command.
There are many options and other commands not listed here, including commands to start and stop a slave during replication and manage the various system logs.
One of the best features of the mysqladmin utility is its comparison of information over time. The --sleep n option tells the utility to execute the specified command once every n seconds. For example, to see the process list refreshed every three seconds on the local host, use the following command:
mysqladmin -uroot --password processlist --sleep 3
This command will execute until you cancel the utility using Ctrl-C.
Perhaps the most powerful option is the comparative results for the extended status command. Use the --relative option to compare the previous execution values with the current values. For example, to see the previous and current values for the system status variables, use this command:
mysqladmin -uroot --password extended-status --relative --sleep 3
You can also combine commands to get several reports at the same time. For example, to see the process list and status information together, issue the following command:
mysqladmin --root … processlist status
mysqladmin has many other uses. You can use it to shut down the server, flush the logs, ping a server, start and stop slaves in replication, and refresh the privilege tables. For more information about the mysqladmin tool, see the section titled “mysqladmin—Client for Administering a MySQL Server” in the online MySQL Reference Manual. Figure 11-1 shows the sample output of a system with no load.
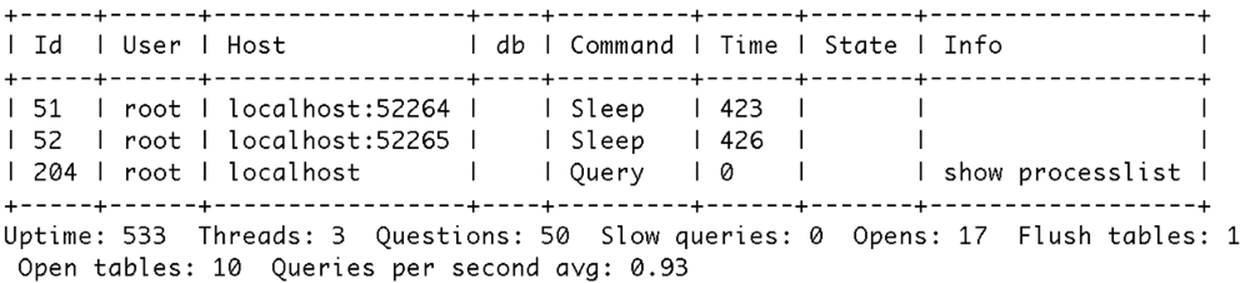
Figure 11-1. Sample mysqladmin process and status report
MySQL Workbench
The MySQL Workbench application is a GUI tool designed as a workstation-based administration tool. MySQL Workbench, which we’ll just call Workbench henceforth, is available for download on the MySQL website and is offered as a community edition (GPL) and a commercial version called the Standard Edition. The Standard Edition is bundled with the MySQL Enterprise offerings.
The major features of Workbench include:
§ Server administration
§ SQL development
§ Data modeling
§ Database Migration Wizard
We will discuss server administration in more detail and briefly introduce SQL development in the following sections. Data modeling is beyond the scope of this chapter, but if you want to implement configuration management for your database schemas, we encourage you to explore the feature presented in the Workbench documentation. The database migration wizard is designed to automate the migration of database schema and data from other database systems. These include Microsoft SQL Server 2000, 2005, 2008, and 2012, PostgreSQL 8.0 and later, and Sybase Adaptive Server Enterprise 15.x and greater. It can be a really handy tool to make adoption of MySQL easier and faster.
NOTE
MySQL Workbench replaces the older MySQL GUI Tools, including MySQL Administrator, MySQL Query Browser, and MySQL Migration Toolkit.
When you launch Workbench, the main screen displays three distinct sections representing SQL development, data modeling, and server administration (Figure 11-2). The links below each section permit you to start working with each of these features. The database migration feature is accessed via the “Database Migrate…” menu option.
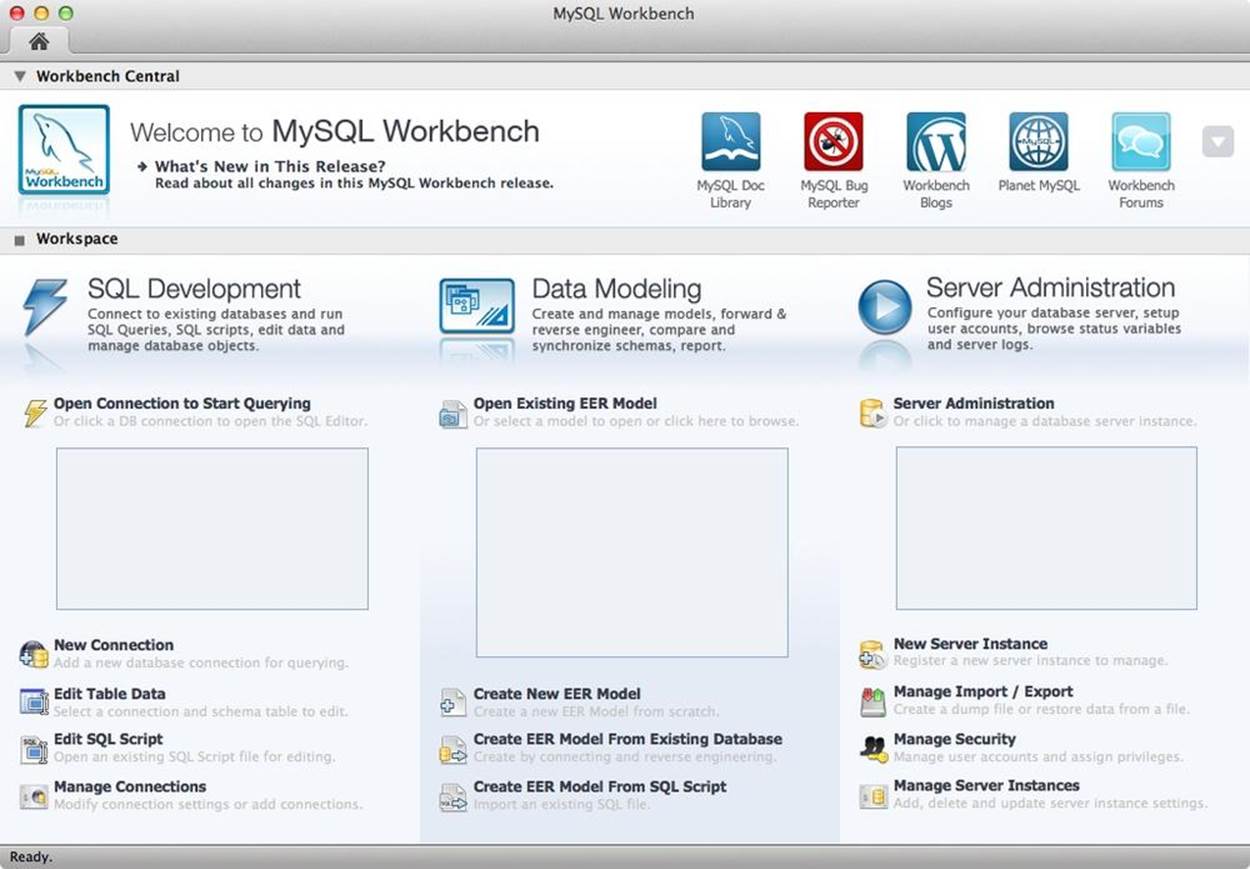
Figure 11-2. MySQL Workbench home window
You can use Workbench on any platform and can access one or more servers connected to the client. This makes the tool much more convenient when monitoring several servers on the network.
For more information and details about installation and setup, refer to the online MySQL Workbench documentation.
MySQL server administration
The server administration feature provides facilities for viewing and changing system variables, managing configuration files, examining the server logs, monitoring status variables, and even viewing graphical representations of performance for some of the more important features. It also has a full set of administration options that allow you to manage users and view database configurations. While it was originally intended to replace the mysqladmin tool, popular demand ensures we will have both for the foreseeable future.
To use the server administration feature, you must first define an instance of a MySQL server to administer. Click the New Server Instance link and follow the steps to create a new instance (connection) to your server. The process will connect to and validate the parameters you entered to ensure it has a valid instance. Once the instance is created, it will be displayed in the box under the Server Administration section of the home window.
To administer your server, choose the server instance from the list then click Server Administration. You will see a new window like Figure 11-3.
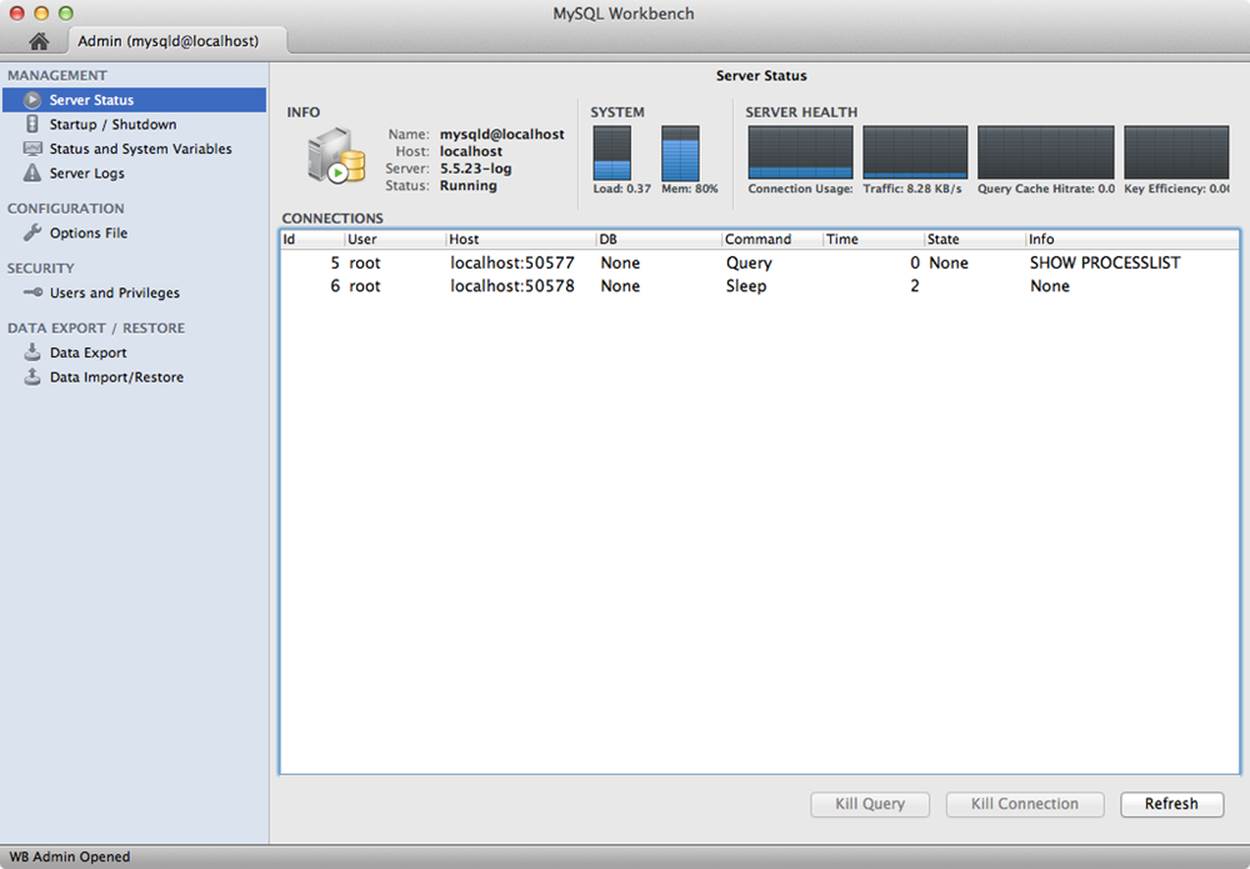
Figure 11-3. Server Administration window
Notice on the left side of the window there are four sections: management, configuration, security, and data export/restore. We discuss each of these briefly.
Management
The management group of tools permits you to see an overview of the server status, start and stop the server, view system and status variables, and view the server logs.
NOTE
In the first edition of this book, we presented the MySQL Administrator application that contained a feature to produce detailed graphs of memory usage, connections, and more. This feature is not present in MySQL Workbench but is included in the MySQL Enterprise Monitor application that contains advanced monitoring tools for enterprises. The graphing feature is vastly superior to the features in the deprecated MySQL Administrator tool.
We see an example of the server status in Figure 11-3. Notice we see a small graph of the server load and its memory usage. To the right of that, we see graphs for connection usage, network traffic, query cache hits, and key efficiency. You can use these graphs as a quick look at your server status. If any of the graphs show unusually high (or, in rare cases, unusually low) values, you can use that as a clue to start looking for performance problems before they become critical.
If you would like a tool that offers finer granularity in graphing system status, health, and so on, you may want to explore the MySQL Enterprise Monitor application. We discuss the MySQL Enterprise Monitor in Chapter 16.
The startup and shutdown tool lets you start or stop the server instance. It also shows the most recent messages from the server, should you start or stop the server with the tool.
The status and system variable tool is one of the handiest of the management group. Figure 11-4 shows an example screenshot of this tool. You can choose to explore status variables by category or search for any status variable matching a phrase (similar to LIKE '%test%').
The system variable tab has the same search feature. Figure 11-5 is an example screen shot of the system variables tool. As you can see, a lot of categories are defined. The categories allow you to quickly zoom to the area you are most interested in viewing. Any variable prefixed by [rw] is read/write and therefore can be changed by the administrator at runtime.
NOTE
The administrator account must have the SUPER privilege.
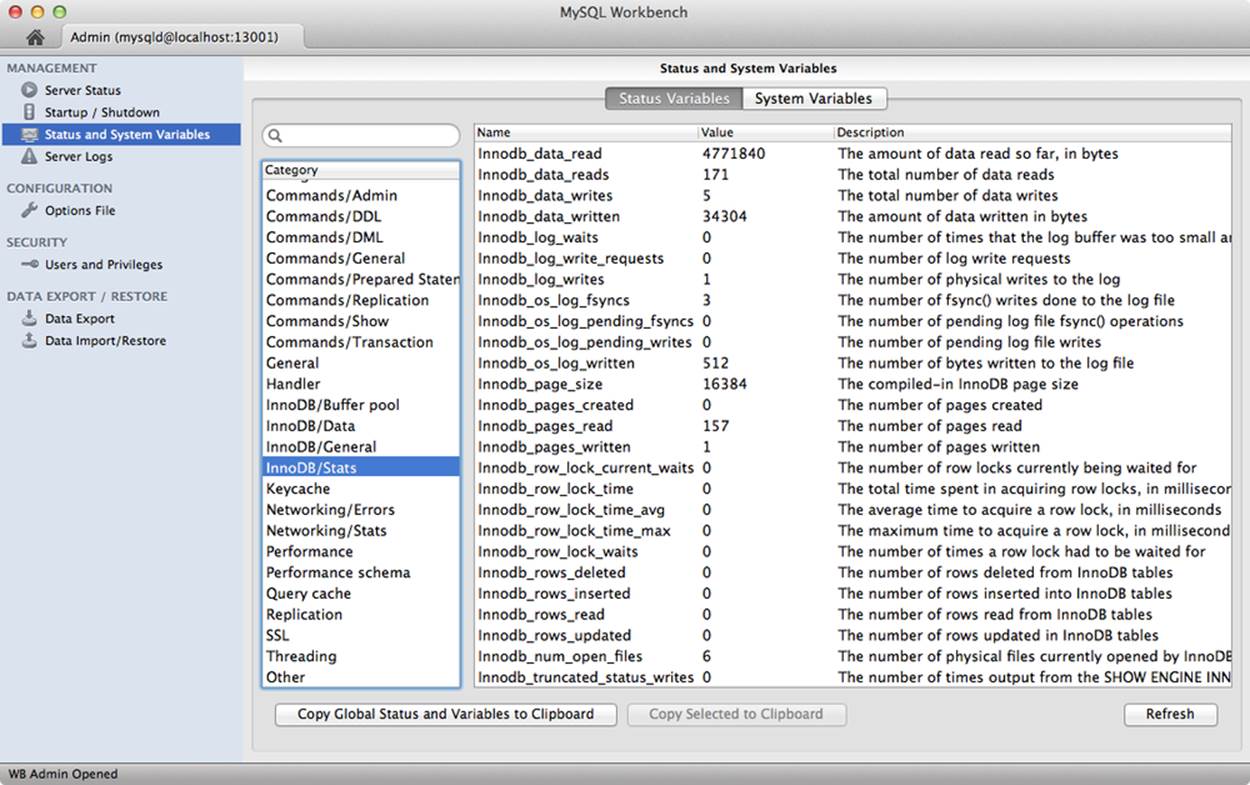
Figure 11-4. Status variables
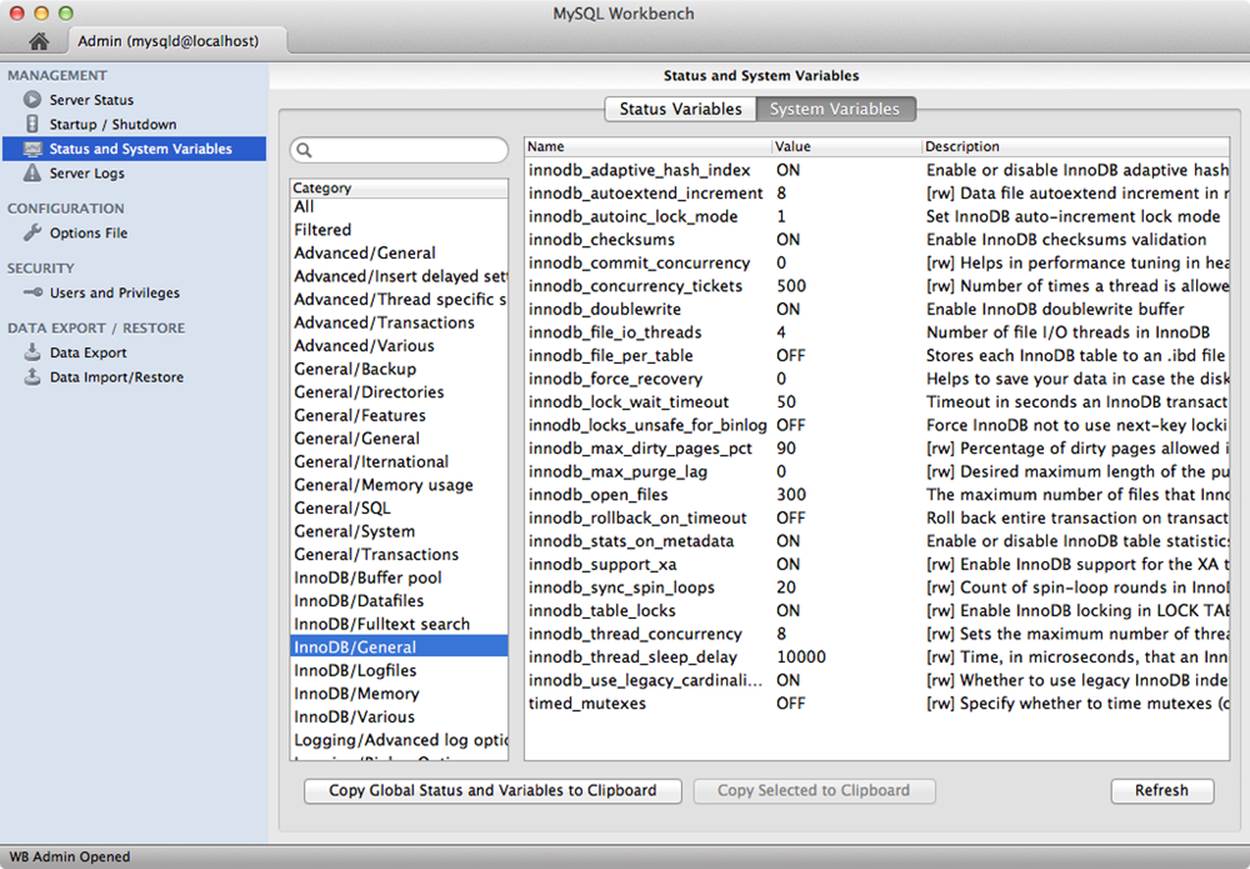
Figure 11-5. System variables
Once you start using Workbench, you should find yourself using these tools frequently. The ability to search and quickly navigate to a status or system variable will save you a lot of typing or reentering SQL SHOW commands. If that isn’t enough to convince you, the tools also allow you to copy the variables to the clipboard for use in reports and similar efforts. You can copy all of the global variables or just those that are shown in the result list.
The last tool in the management group allows you to explore the server logs. Figure 11-6 shows an example screenshot of the server logs tool. It displays a tab for each type of log that is enabled. In the example, we have the slow query, general, and error logs enabled. You can view each log in turn, paging through the log entries. You can also select portions of the logs and copy them to the clipboard for reporting and similar efforts.
NOTE
You may be prompted to enter elevated privileges for reading the log files. Also, if you are connected to a remote server (other than localhost), you must use a SSH instance connection with appropriate credentials.
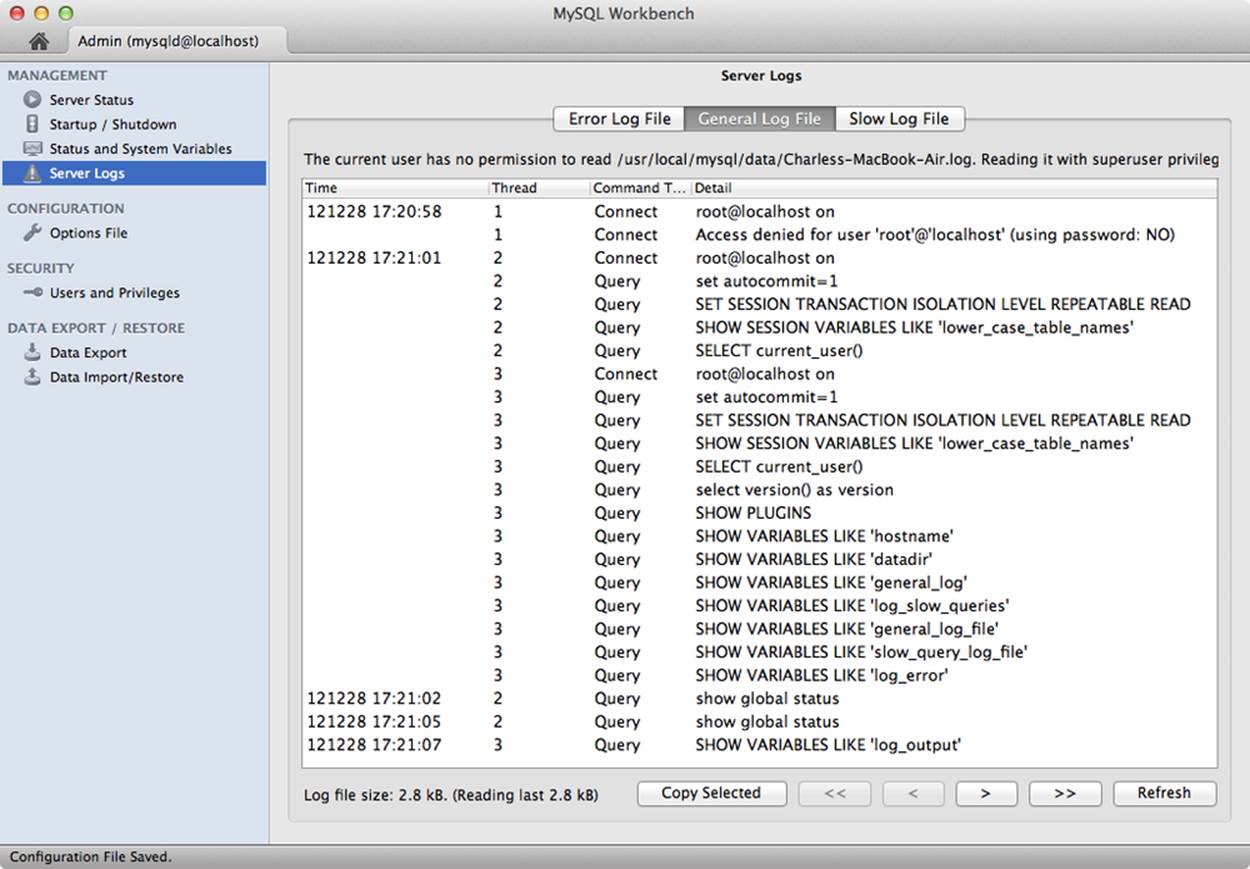
Figure 11-6. Server logs
As you can see, the graphical tools for managing MySQL servers are designed to make rudimentary and repetitive tasks easier.
Configuration
The next group includes a powerful tool for managing your configuration file. Figure 11-7 shows a sample screenshot of the options file tool. Not only can you view what options are set in your configuration file, but you can change their values and save the new values. More on that in a moment.
NOTE
The user account used must have write privileges at the OS-level for this file.
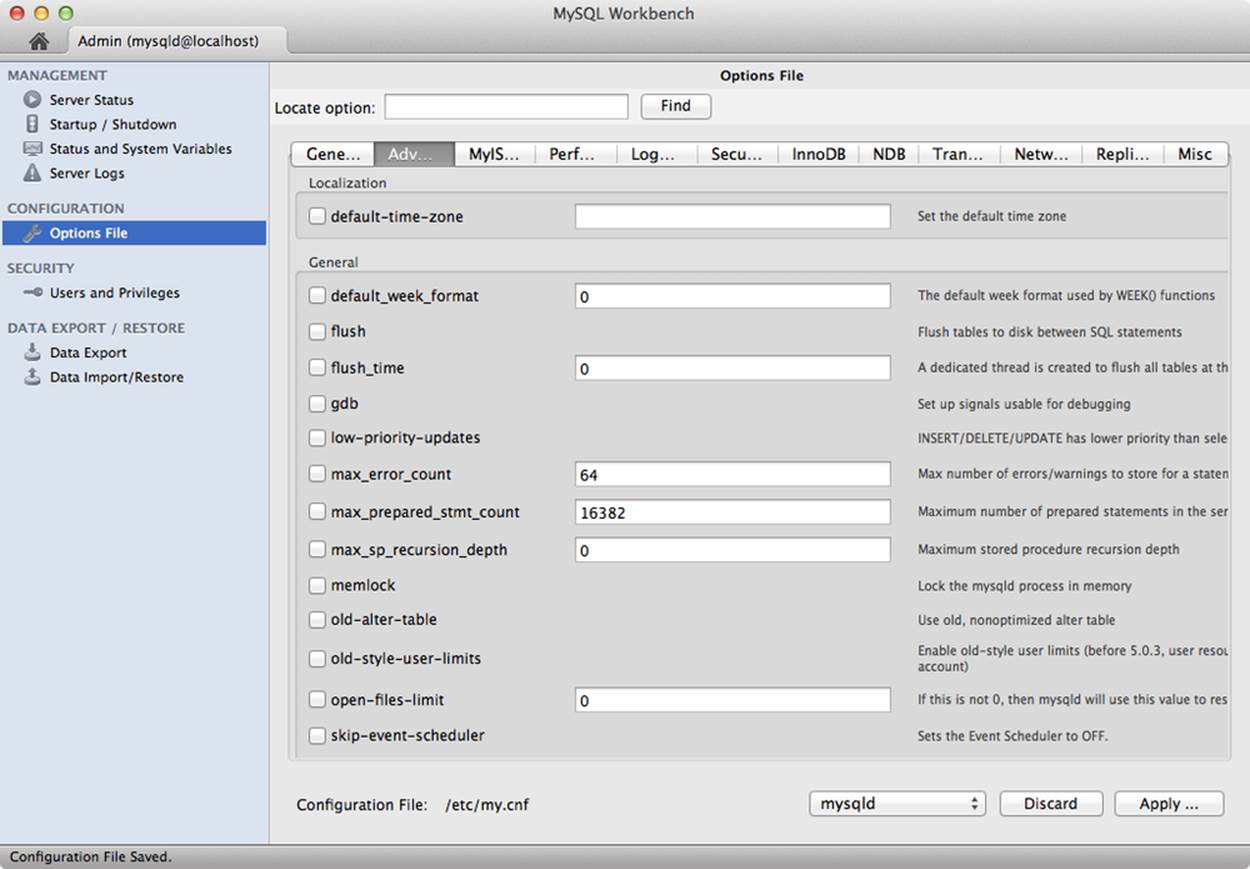
Figure 11-7. Options file
There are several categories listed in tabs across the top. These include general, advanced, MyISAM, performance, logfiles, security, InnoDB, NDB, transactions, networking, replication, and miscellaneous. The tool includes all of the server options known for the version of your server. The use of categories makes finding and setting configuration file entries easier. A short help text is provided to the right of each option.
Setting options requires first checking the tick box to indicate the option should appear in the file. In addition, if the option takes a value, enter or change the value in the provided text box. Once you have all of the options set the way you want, you can make them take effect by clicking Apply. When you click Apply, a dialog opens that displays a summary of the changes to the file. You can cancel or apply the changes or you can see the complete contents of the file from this dialog. When you click Apply, the tool saves the changes to the file, which will take effect on the next start of the server.
There is one other powerful feature to this tool. Notice the drop-down box labeled “mysqld” near the bottom. This allows you to set the section of the configuration file you are editing, and thereby use the tool to modify options for certain applications. Combined with the ability to restart the server, you can use this tool to help tune your server. You may find this easier and faster to use than traditional command-line tools.
Security
The next group contains a permissions tool that allows you to quickly see the permissions for any user from a list of all users defined on the server. Figure 11-8 shows a sample screenshot of the tool.
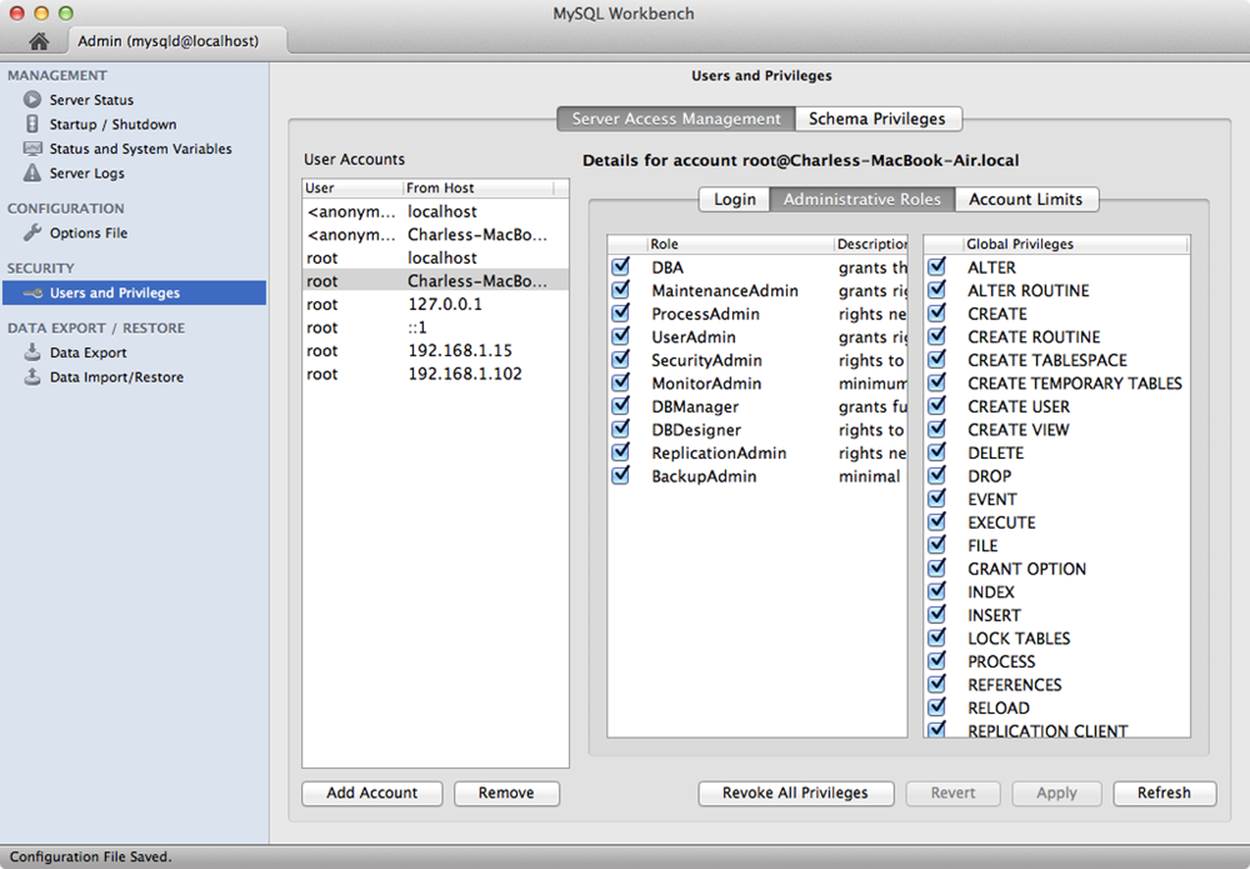
Figure 11-8. Privileges
You can use this tool to help diagnose access issues and to help prune your permission sets to minimal access for your users. The tool also permits you to change permissions for a given user by clicking the tick box to toggle access (no checkmark means the user does not have the permission). Once you’ve made changes to one or more users, you can click Apply to issue the appropriate changes on the server.
Data export/restore
The last group of tools encapsulate the basic data export and import features of mysqldump. While not strictly devoted to monitoring, you would do well to include such features in your collection of tools. For example, it may be necessary to make copies or export data from one server to another for further analysis of a performance-related query issue.
You can select entire databases or any combination of objects to export. Figure 11-9 shows a sample screenshot of the export feature.
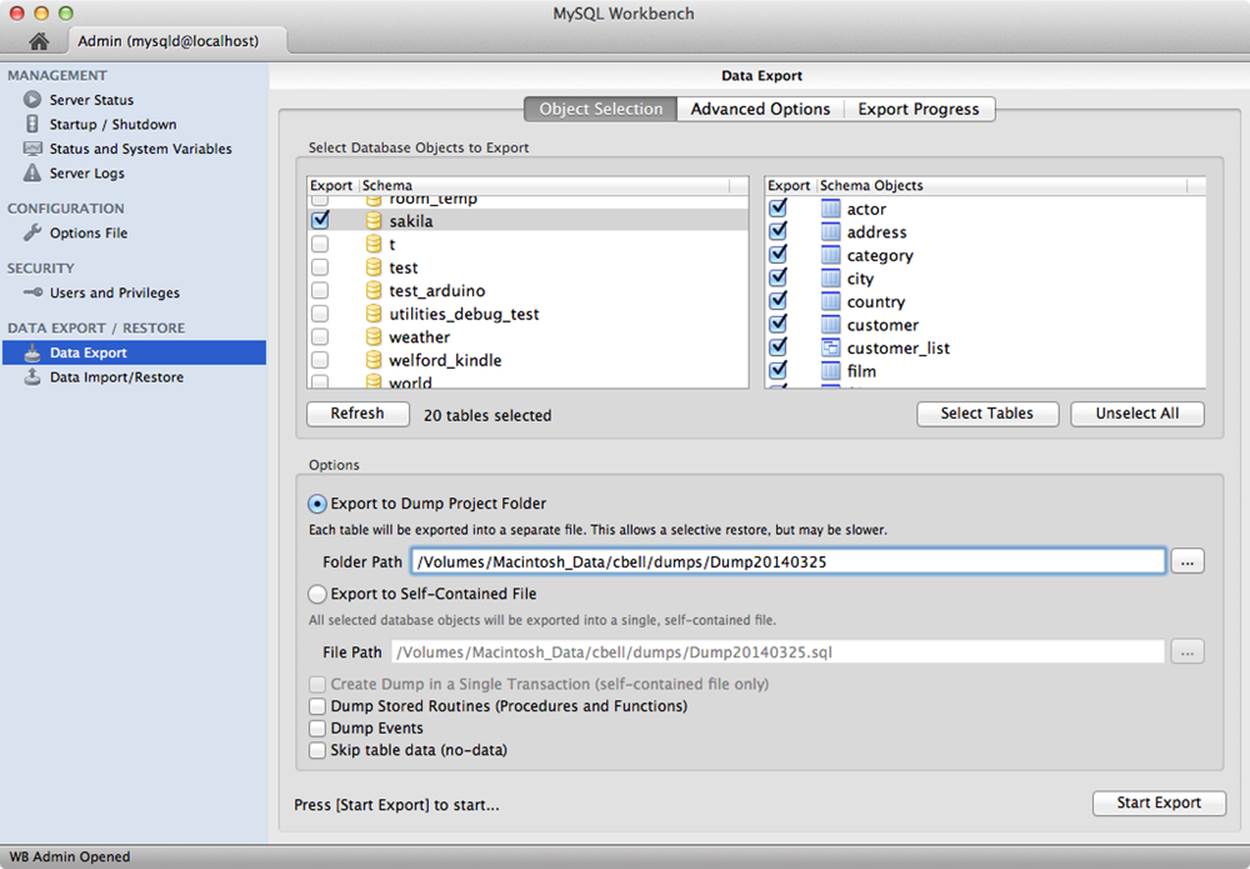
Figure 11-9. Data export
You can dump all the objects and data to a single file, or specify a project folder where each table is saved as a separate .sql file that contains the table creation and data insert SQL statements. After you select either option, along with the databases and tables you want to export, and then click Start Export, the associated mysqldump commands will run. A summary dialog is opened to display progress of the operation and the exact commands used to issue the export. You can save these commands for use in scripts.
You can also choose to export procedures and functions, events, or not export any data at all (exporting only the table structure). If your database uses InnoDB, you can also tell the tool to use a single transaction to avoid prolonged locking of the tables. In this case, the tool tells mysqldump to use the consistent snapshot feature of InnoDB to lock the tables.
Importing data is done via the data import/restore tool (Figure 11-10). It allows you to select an export folder or file to import, a target default database (schema).
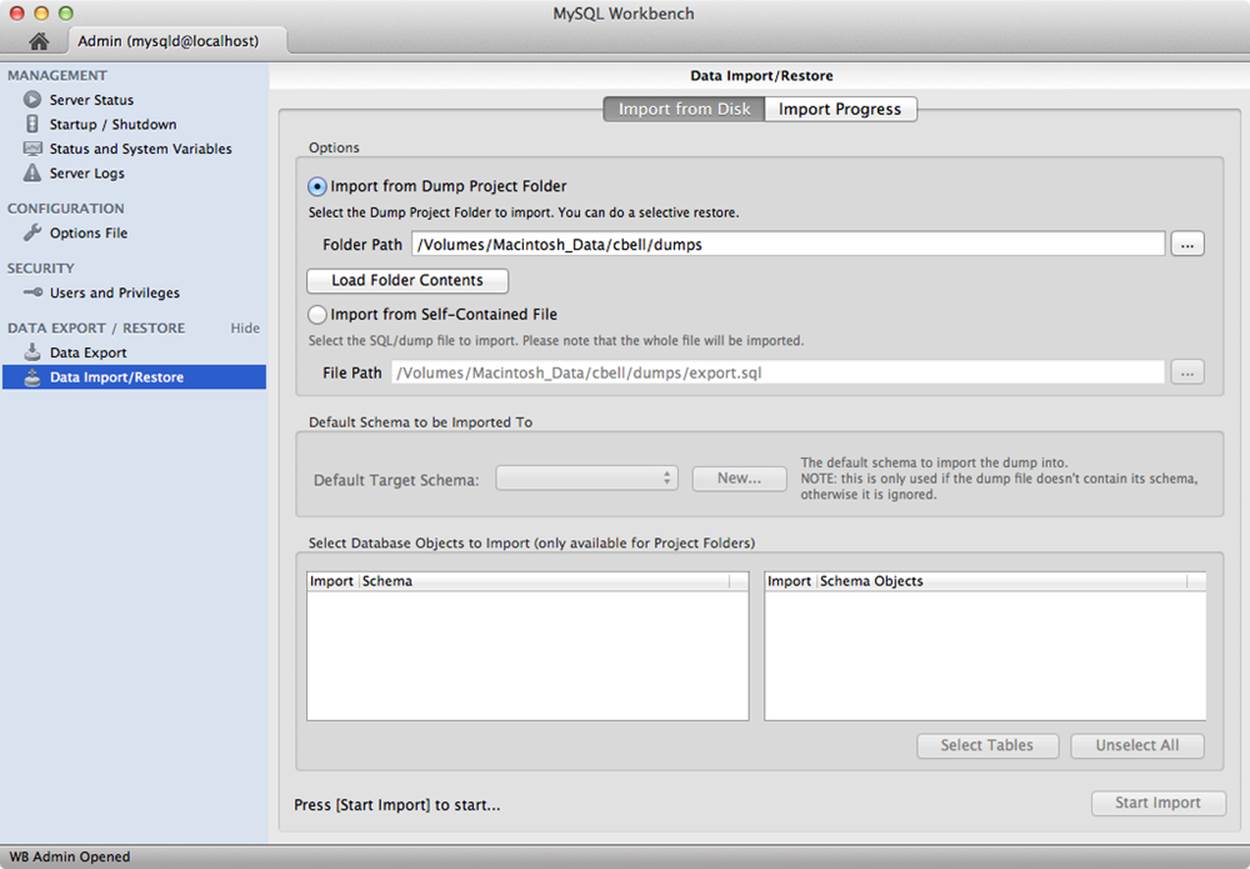
Figure 11-10. Data import
If you elected to export to a project folder, you can also select which files (tables) you want to import, allowing you to perform a selective restore. Like the export tool, executing the import will open a dialog that shows you the progress of the import as well as the mysqldump commands.
SQL development
The SQL Editor is another of the GUI tools available in Workbench. It also is not a monitoring tool in and of itself, but, as you shall see, provides a robust environment for constructing complex SQL statements.
You can access the tool from the home window. Here you select an instance, then click Open Connection to Start Querying. Figure 11-11 shows a sample screenshot.
You can use the SQL Editor to build queries and execute them in a graphical form. Result sets are returned and displayed in a spreadsheet-like display. The SQL Editor allows for vertical scrolling through all of the results as well as changing the size of the columns and horizontally scrolling to better view the data. Many users find this tool more convenient and easier to use than the traditional mysql command-line client.
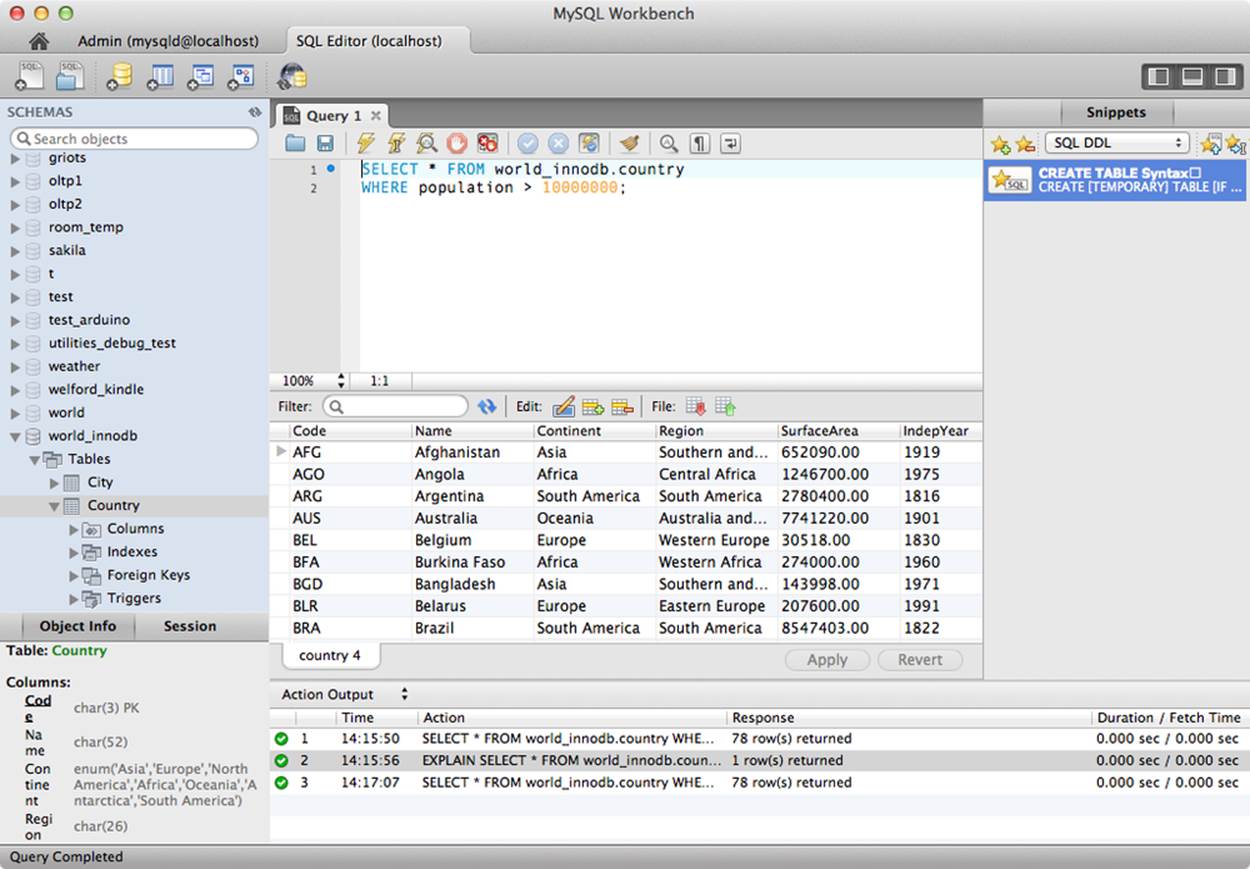
Figure 11-11. SQL Editor
The performance-related functionality and the value added for administrators is the graphical display of the results of the EXPLAIN command for any given query. Figure 11-12 shows a sample explanation of a query from the world (InnoDB) database. We will discuss this in greater detail later in the chapter.
The SQL Editor example shown here should give you an indication of the utilitarian value of the GUI. You can enter any query and see the explanation of the query execution by first executing the query, then selecting Explain Query from the Query menu.
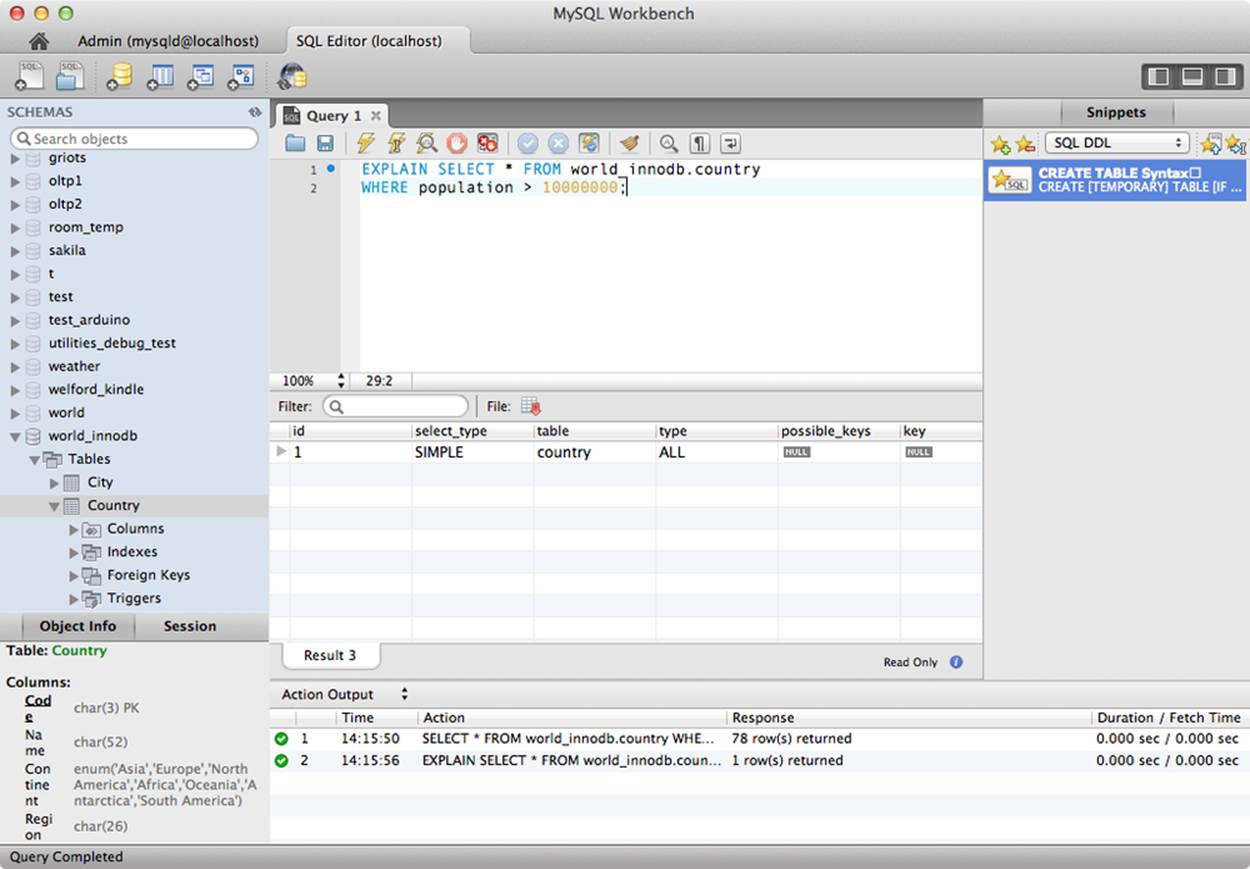
Figure 11-12. SQL Editor: Results view
Notice there are two parts to the results. The bottom part shows the results of the EXPLAIN command as well as the actual rows returned. You can use the scroll bars to view more data without having to reissue the query.
This is a valuable performance tuning tool because you can write the query once, use the Explain Query feature, observe the results, either rewrite the query or adjust the indexes, then reissue the query and observe the changes in the GUI. And you thought query tools were for users only—not so with this tool.
But wait, there’s more. The SQL Editor has enhanced editing tools, such as color-coding. To see all of the advanced features and uses for the SQL Editor, check the online MySQL Workbench documentation.
Third-Party Tools
Some third-party tools are also useful. Some of the more popular are MySAR, mytop, InnoTop, and MONyog. Except for MONyog, they are all text-based (command-line) tools that you can run in any console window and connect to any MySQL server reachable across the network. We discuss each of these briefly in the following sections.
MySAR
MySAR is a system activity report that resembles the output of the Linux sar command. MySAR accumulates the output of the SHOW STATUS, SHOW VARIABLES, and SHOW FULL PROCESSLIST commands and stores them in a database on the server named mysar. You can configure the data collection in a variety of ways, including limiting the data collected. You can delete older data in order to continue to run MySAR indefinitely and not worry about filling up your disk with status dumps.
MySAR is open source and licensed under the GNU Public License version 2 (GPL v2).
TIP
If you use sar to gather a lot of data, you may want to check out the ksar tool. The ksar tool is a graphical presentation tool that operates on the output of sar.
mytop
The mytop utility monitors the thread statistics and general performance statistics of MySQL. It lists common statistics like hostname, version of the server, how many queries have run, the average times of queries, total threads, and other key statistics. It runs the SHOW PROCESSLIST andSHOW STATUS commands periodically and displays the information in a listing like the top command found on Linux. Figure 11-13 shows an example.
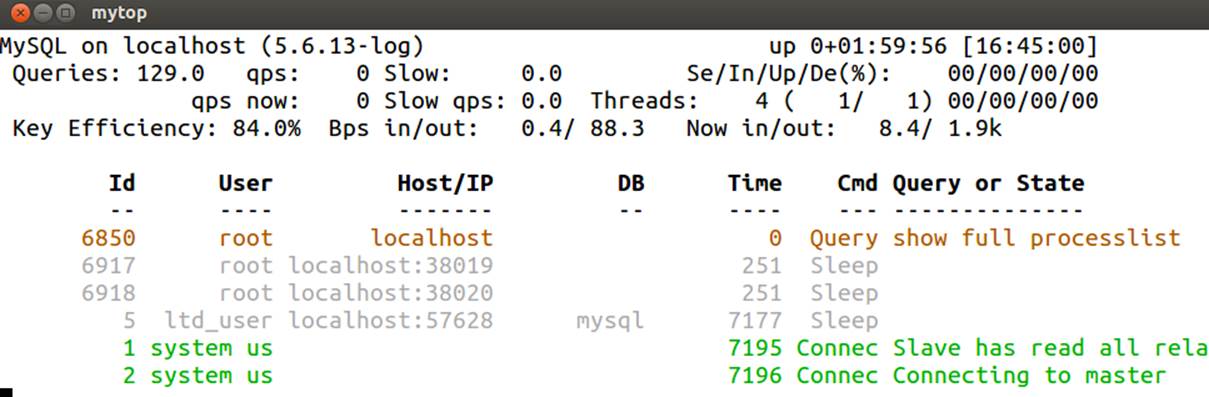
Figure 11-13. The mytop utility
Jeremy D. Zawodny wrote mytop, and it is still maintained by him along with the MySQL community. It is open source and licensed under the GNU Public License version 2 (GPL v2).
InnoTop
InnoTop is another system activity report that resembles the top command. Inspired by the mytop utility, InnoTop has many of the same tools as mytop, but is specifically designed to monitor InnoDB performance as well as the MySQL server. You can monitor critical statistics concerning transactions, deadlocks, foreign keys, query activity, replication activity, system variables, and a host of other details.
InnoTop is widely used and considered by some to be a general performance monitoring tool. It has many features that allow you to monitor the system dynamically. If you are using InnoDB primarily as your default (or standard) storage engine and want a well-rounded monitoring tool you can run in text mode, look no further than InnoTop. Figure 11-14 shows an example of the InnoTop utility.
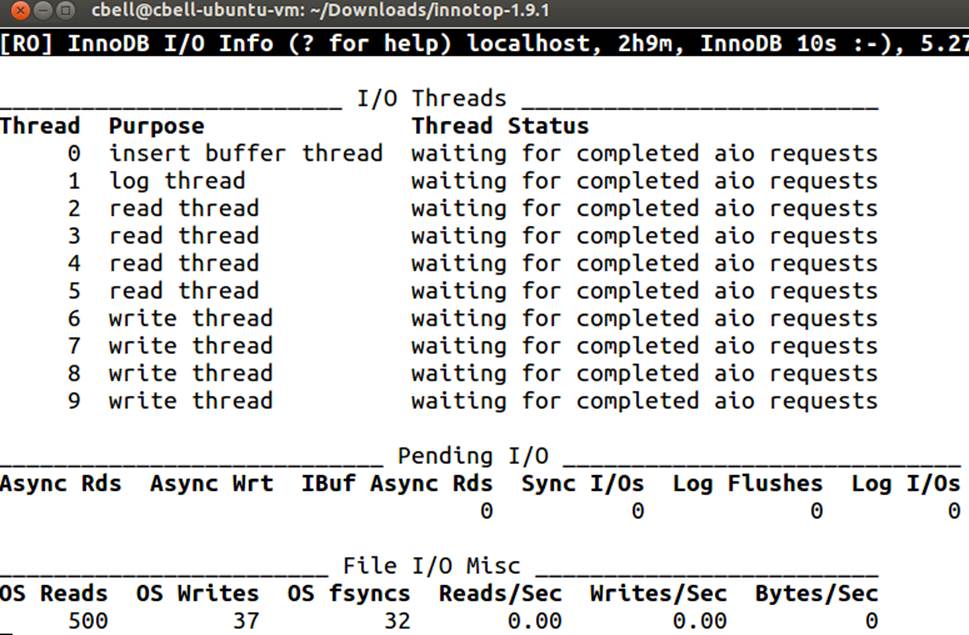
Figure 11-14. The InnoTop utility
The InnoTop utility is licensed under the GNU Public License version 2 (GPL v2).
MONyog
MySQL Monitor and Advisor (MONyog) is another good MySQL monitoring tool. It allows you to set parameters for key components for security and performance, and includes tools to help tune your servers for maximum performance. You can set events to monitor specific parameters and get alerts when the system reaches the specified thresholds. The major features of MONyog are:
§ Server resource monitoring
§ Identification of poorly executing SQL statements
§ Server log monitoring (e.g., the error log)
§ Real-time query performance monitoring and identification of long-running queries
§ Alerting for significant events
MONyog also provides a GUI component if you prefer to graph the output.
The MySQL Benchmark Suite
Benchmarking is the process of determining how a system performs under certain loads. The act of benchmarking varies greatly and is somewhat of an art form. The goal is to measure and record statistics about the system while running a well-defined set of tests whereby the statistics are recorded under light, medium, and heavy load on the server. In effect, benchmarking sets the expectations for the performance of the system.
This is important because it gives you a hint if your server isn’t performing as well as expected. For example, if you encounter a period during which users are reporting slower performance on the server, how do you know the server is performing poorly? Let’s say you’ve checked all of the usual things—memory, disk, etc.—and all are performing within tolerance and without error or other anomalies. How, then, do you know if things are running more slowly?
Enter the benchmarks. You can rerun the benchmark test and if the values produced are much larger (or smaller, depending on what you are measuring), you know the system is performing below expectations.
You can use the MySQL benchmark suite to establish your own benchmarks. The benchmark tool is located in the sql-bench folder and is normally included in the source code distribution. The benchmarks are written in Perl and use the Perl DBI module for access to the server. If you do not have Perl or the Perl DBI module, see the section titled “Installing Perl on Unix” in the online MySQL Reference Manual.
Use the following command to run the benchmark suite:
./run-all-tests --server=mysql --cmp=mysql --user=root
This command will run the entire set of standard benchmark tests, recording the current results and comparing them with known results of running the tests on a MySQL server. Example 11-4 shows an excerpt of the results of running this command on a system with limited resources.
Example 11-4. The MySQL benchmark suite results
cbell@cbell-mini:~/source/bzr/mysql-6.0-review/sql-bench$
Benchmark DBD suite: 2.15
Date of test: 2009-12-01 19:54:19
Running tests on: Linux 2.6.28-16-generic i686
Comments:
Limits from: mysql
Server version: MySQL 6.0.14 alpha debug log
Optimization: None
Hardware:
alter-table: Total time: 77 wallclock secs
( 0.12 usr 0.05 sys + 0.00 cusr 0.00 csys = 0.17 CPU)
ATIS: Total time: 150 wallclock secs
(20.22 usr 0.56 sys + 0.00 cusr 0.00 csys = 20.78 CPU)
big-tables: Total time: 135 wallclock secs
(45.73 usr 1.16 sys + 0.00 cusr 0.00 csys = 46.89 CPU)
connect: Total time: 1359 wallclock secs
(200.70 usr 30.51 sys + 0.00 cusr 0.00 csys = 231.21 CPU)
…
Although the output of this command isn’t immediately valuable, recall that benchmarking is used to track changes in performance over time. Whenever you run the benchmark suite, you should compare it to your known baseline and your last several benchmark checks. Because load can influence the benchmarks, taking the benchmark data over several increments can help mitigate the influence of load for systems that run 24-7.
For example, if you see the wallclock times jump considerably from one run to another, this may not be an indication of a performance slowdown. You should also compare the detailed values, such as user and system time. Of course, an increase in the majority of these values can be an indication that the system is experiencing a heavy load. In this case, you should check the process list to see whether there are indeed a lot of users and queries running. If that is the case, run the benchmark suite again when the load is less and compare the values. If they decrease, you can deduce it was due to sporadic load. On the other hand, if the values remain larger (hence, the system is slower), you should begin investigation as to why the system is taking longer to execute the benchmark tests.
THE BENCHMARK FUNCTION
MySQL contains a built-in function called benchmark() that you can use to execute a simple expression and obtain a benchmark result. It is best used when testing other functions or expressions to determine if they are causing delays. The function takes two parameters: a counter for looping and the expression you want to test. The following example shows the results of running 10,000,000 iterations of the CONCAT function:
mysql> SELECT BENCHMARK(10000000, "SELECT CONCAT('te','s',' t')");
+-----------------------------------------------------+
| BENCHMARK(10000000, "SELECT CONCAT('te','s',' t')") |
+-----------------------------------------------------+
| 0 |
+-----------------------------------------------------+
1 row in set (0.06 sec)
The diagnostic output of this function is the time it takes to run the benchmark function. In this example, it took 0.06 seconds to run the iterations. If you are exploring a complex query, consider testing portions of it using this command. You may find the problem is related to only one part of the query. For more information about the benchmark suite, see the online MySQL Reference Manual.
Now that we have discussed the various tools available for monitoring MySQL and have looked at some best practices, we turn our attention to capturing and preserving operational and diagnostic information using logfiles.
Server Logs
If you are a seasoned Linux or Unix administrator, you are familiar with the concepts and importance of logging. The MySQL server was born of this same environment. Consequently, MySQL creates several logs that contain vital information about errors, events, and data changes.
This section examines the various logs in a MySQL server, including the role each log plays in monitoring and performance improvement. Logfiles can provide a lot of information about past events.
There are several types of logs in the MySQL server:
§ General query log
§ Slow query log
§ Error log
§ Binary log
You can turn any of the logs on or off using startup options. Most installations have at least the error log enabled.
The general query log, as its name implies, contains information about what the server is doing, such as connections from clients, as well as a copy of the commands sent to the server. As you can imagine, this log grows very quickly. Examine the general query log whenever you are trying to diagnose client-related errors or to determine which clients are issuing certain types of commands.
NOTE
Commands in the general query log appear in the same order in which they were received from the clients and may not reflect the actual order of execution.
Turn on the general query log by specifying the --general-log startup option. You can also specify the name of the logfile using the --log-output startup option. These options have dynamic variable equivalents. For example, SET GLOBAL log_output = FILE; sets the log output for a running server to write to a file. Finally, you can read the values of either of these variables using the SHOW VARIABLES command.
The slow query log stores a copy of long-running queries. It is in the same format as the general log, and you can control it in the same manner with the --log-slow-queries startup option. The server variable that controls which queries go into the slow query log is log_query_time (in seconds). You should tune this variable to meet the expectations for your server and applications to help track times when queries perform slower than desired. You can send log entries to a file, a table, or both using the FILE, TABLE, or BOTH option, respectively.
The slow query log can be a very effective tool for tracking problems with queries before the users complain. The goal, of course, is to keep this log small or, better still, empty at all times. That is not to say you should set the variable very high; on the contrary, you should set it to your expectations and adjust the value as your expectations or circumstances change.
NOTE
The slave does not log slow queries by default. However, if you use the --log-slow-slave-statements option, it will write slow-running events to its slow log.
The error log contains information gathered when the MySQL server starts or stops. It also contains the errors generated while the server is running. The error log is your first stop when analyzing a failed or impaired MySQL server. On some operating systems, the error log can also contain a stack trace (or core dump).
You can turn the error log on or off using the --log-error startup option. The default name for the error log is the hostname appended by the extension .err. It is saved in the base directory (the same location as the host of the data directory) by default but can be overridden by setting the path with the general_log_file option.
If you start your server with --console, errors are written to standard error output as well as to the error log.
The binary log stores all of the changes made to the data on the server as well as statistical information about the execution of the original command on the server.
The online MySQL Reference Manual states that the binary logs are used for backup; however, practice shows that replication is a more popular use of the binary log.
The unique format of the binary log allows you to use the log for incremental backups, where you store the binlog file created between each backup. You do this by flushing and rotating the binary logs (closing the log and opening a new log); this allows you to save a set of changes since your last backup. This same technique lets you perform PITR, where you restore data from a backup and apply the binary log up to a specific point or date. For more information about the binary log, see Chapter 4. For more information about PITR, see Chapter 15.
Because the binary log makes copies of every data change, it does add a small amount of overhead to the server, but the performance penalty is well worth the benefits. However, system configuration such as disk setup and storage engine choice can greatly affect the overhead of the binary log. For example, there is no concurrent commit when using the InnoDB storage engine. This may be a concern in high-write scenarios with binary logging and InnoDB.
Turn on the binary log using the --log-bin startup option, specifying the root filename of the binary log. The server appends a numeric sequence to the end of the filename, allowing for automatic and manual rotations of the log. While not normally necessary, you can also change the name of the index for the binary logs by specifying the --log-bin-index startup option. Perform log rotations using the FLUSH LOGS command.
You can also control what is logged (inclusive logging) or what is excluded (exclusive logging) using --binlog-do-db and --binlog-ignore-db, respectively.
Performance Schema
In this section, we present the Performance Schema feature as a technique for measuring the internal execution of the server, which can help you diagnose performance problems. While this section introduces the feature and contains a brief startup guide, it does not contain all of the possible configuration and setup parameters and options nor does it contain a complete guide to using the Performance Schema views. For a complete detailed explanation of how to set up and use the Performance Schema tables, see the online reference manual under the heading “MySQL Performance Schema.”
A recent addition to the MySQL Server, the Performance Schema feature is presented as a database named performance_schema (sometimes shown in all capitals). It contains a set of dynamic tables (stored in memory) that enable you to see very low-level metrics of server execution. This feature was added to the server in version 5.5.3. The Performance Schema feature provides metadata on the execution of the server, right down to the line of code being executed. Indeed, it is possible to monitor precisely a mechanism in a particular source file.
For this reason, the Performance Schema is often considered a developer tool for diagnosing execution of the server code itself. This is because it is most often used to diagnose deadlocks, mutex, and thread problems. However, it is much more than that! You can get metrics for stages of query optimization, file I/O, connections, and much more. Yes, it is very low level and will indeed show you references to source code. But although most metrics target specific code components, the tool also provides historical data as well as current values for a metric. This can be particularly useful if you are diagnosing a difficult performance problem that you can isolate to a specific use case.
You may be thinking that this would create a tremendous load on the server and incur a severe penalty on performance. For some external monitoring solutions, this is true, but the Performance Schema is designed to have little or no measurable impact on server performance. This is possible because of the way the feature is intertwined with the server: it takes advantage of many of the optimizations in the server that external tools simply cannot.
The following section presents a terse introduction to the terms and concepts used in Performance Schema. Later sections will show you how to use the feature to diagnose performance problems.
Concepts
This section presents the basic concepts of the Performance Schema in an effort to make it easier for you to get started using it to gather metrics.
The Performance Schema appears in your list of databases (SHOW DATABASES) as performance_schema and contains a number of dynamic tables that you can see with SHOW TABLES. Example 11-5 lists the available tables in an early release candidate for the MySQL 5.6 server.
The number of tables is likely to expand with future releases of the server.
Example 11-5. performance_schema tables
mysql> SHOW TABLES;;
+----------------------------------------------------+
| Tables_in_Performance Schema |
+----------------------------------------------------+
| accounts |
| cond_instances |
| events_stages_current |
| events_stages_history |
| events_stages_history_long |
| events_stages_summary_by_account_by_event_name |
| events_stages_summary_by_host_by_event_name |
| events_stages_summary_by_thread_by_event_name |
| events_stages_summary_by_user_by_event_name |
| events_stages_summary_global_by_event_name |
| events_statements_current |
| events_statements_history |
| events_statements_history_long |
| events_statements_summary_by_account_by_event_name |
| events_statements_summary_by_digest |
| events_statements_summary_by_host_by_event_name |
| events_statements_summary_by_thread_by_event_name |
| events_statements_summary_by_user_by_event_name |
| events_statements_summary_global_by_event_name |
| events_waits_current |
| events_waits_history |
| events_waits_history_long |
| events_waits_summary_by_account_by_event_name |
| events_waits_summary_by_host_by_event_name |
| events_waits_summary_by_instance |
| events_waits_summary_by_thread_by_event_name |
| events_waits_summary_by_user_by_event_name |
| events_waits_summary_global_by_event_name |
| file_instances |
| file_summary_by_event_name |
| file_summary_by_instance |
| host_cache |
| hosts |
| mutex_instances |
| objects_summary_global_by_type |
| performance_timers |
| rwlock_instances |
| session_account_connect_attrs |
| session_connect_attrs |
| setup_actors |
| setup_consumers |
| setup_instruments |
| setup_objects |
| setup_timers |
| socket_instances |
| socket_summary_by_event_name |
| socket_summary_by_instance |
| table_io_waits_summary_by_index_usage |
| table_io_waits_summary_by_table |
| table_lock_waits_summary_by_table |
| threads |
| users |
+----------------------------------------------------+
52 rows in set (0.01 sec)
Performance Schema monitors events, where an event is any discrete execution that has been instrumented (enabled in code and called “instrument points”) and has a measurable duration. For example, the event could be a method call, a mutex lock/unlock, or a file I/O. Events are stored as a current event (the most recent value), historical values, and summaries (aggregates).
WARNING
Performance Schema events are not the same as binary log events.
An instrument, therefore, consists of the instrument points in the server (source) that produce events when they execute. An instrument must be enabled in order to fire an event.
You can monitor specific users (threads) using the setup_actors table. You can monitor specific tables or all tables in certain databases using the setup_objects table. Currently, only table objects are supported.
A timer is a type of execution that is measured by a time duration. Timers include idle, wait, stage, and statement. You can change the duration of timers to change the frequency of the measurement. Values include CYCLE, NANOSECOND, MICROSECOND, MILLISECOND, and TICK. You can see the available timers by examining the rows in the performance_timers table.
Setup tables are used to enable or disable actors, instruments, objects (tables), and timers.
Getting Started
Performance Schema can be enabled at startup or at runtime. You can check to see whether your server supports Performance Schema and whether it is turned on by examining the performance_schema variable. A value of ON indicates the feature is enabled. To enable Performance Schema at startup, use the --performance-schema startup option:
[mysqld]
…
performance_schema=ON
…
Enabling Performance Schema and configuring events to monitor at startup requires the use of several startup options. Depending on the level of detail you want to collect, enabling Performance Schema at startup can become complicated. Fortunately, all of the required and voluntary options and their values can be stored in your configuration file. If you want to collect all available events for a specific server under controlled conditions, it may be easier to enable Performance Schema at startup.
However, most administrators will want to enable Performance Schema at runtime. You must enable Performance Schema either via the --performance-schema startup variable or via your configuration file. Once enabled, you must configure the events you want to record. This involves modifying the rows in the setup and configuration tables. This section will demonstrate the process you use to enable events and instruments for preparing to collect data for diagnosing performance problems.
To enable monitoring with Performance Schema, begin by setting the timers you want to use, setting the events you want to enable, and enabling the instruments you want to monitor.
For example, if you want to monitor all SHOW GRANTS events, begin by setting the timer for the statement object. In this case, we will use the standard NANOSECOND timing. You can check the current setting by examining the setup_timers table:
mysql> select * from setup_timers;
+-----------+-------------+
| NAME | TIMER_NAME |
+-----------+-------------+
| idle | MICROSECOND |
| wait | CYCLE |
| stage | NANOSECOND |
| statement | NANOSECOND |
+-----------+-------------+
4 rows in set (0.01 sec)
Next, enable the instrument for the SQL statement as follows. In this case, we set some columns in the setup_instruments table to YES for the specific command (SHOW GRANTS). More specifically, we enable the instrumentation of the metric and enable the timer property for the metric:
mysql> UPDATE setup_instruments SET enabled='YES', timed='YES'
WHERE name = 'statement/sql/show_grants';
Query OK, 1 row affected (0.00 sec)
Rows matched: 1 Changed: 1 Warnings: 0
Next, enable the consumers for the events_statements_current and events_statements_history statements:
mysql> UPDATE setup_consumers SET enabled='YES'
WHERE name = 'events_statements_current';
Query OK, 0 rows affected (0.00 sec)
Rows matched: 1 Changed: 1 Warnings: 0
mysql> UPDATE setup_consumers SET enabled='YES'
WHERE name = 'events_statements_history';
Query OK, 1 row affected (0.00 sec)
Rows matched: 1 Changed: 1 Warnings: 0
Now execute the SHOW GRANTS command and examine the events_statements_current and events_statements_history tables:
mysql> show grants \G
*************************** 1. row ***************************
Grants for root@localhost: GRANT ALL PRIVILEGES ON *.* TO 'root'@'localhost'
IDENTIFIED BY PASSWORD '*81F5E21E35407D884A6CD4A731AEBFB6AF209E1B'
WITH GRANT OPTION
*************************** 2. row ***************************
Grants for root@localhost: GRANT PROXY ON ''@'' TO 'root'@'localhost' WITH
GRANT OPTION
2 rows in set (0.01 sec)
mysql> select * from events_statements_current \G
*************************** 1. row ***************************
THREAD_ID: 22
EVENT_ID: 80
END_EVENT_ID: NULL
EVENT_NAME: statement/sql/select
SOURCE: mysqld.cc:903
TIMER_START: 13104624563678000
TIMER_END: NULL
TIMER_WAIT: NULL
LOCK_TIME: 136000000
SQL_TEXT: select * from events_statements_current
DIGEST: NULL
DIGEST_TEXT: NULL
CURRENT_SCHEMA: performance_schema
OBJECT_TYPE: NULL
OBJECT_SCHEMA: NULL
OBJECT_NAME: NULL
OBJECT_INSTANCE_BEGIN: NULL
MYSQL_ERRNO: 0
RETURNED_SQLSTATE: NULL
MESSAGE_TEXT: NULL
ERRORS: 0
WARNINGS: 0
ROWS_AFFECTED: 0
ROWS_SENT: 0
ROWS_EXAMINED: 0
CREATED_TMP_DISK_TABLES: 0
CREATED_TMP_TABLES: 0
SELECT_FULL_JOIN: 0
SELECT_FULL_RANGE_JOIN: 0
SELECT_RANGE: 0
SELECT_RANGE_CHECK: 0
SELECT_SCAN: 1
SORT_MERGE_PASSES: 0
SORT_RANGE: 0
SORT_ROWS: 0
SORT_SCAN: 0
NO_INDEX_USED: 1
NO_GOOD_INDEX_USED: 0
NESTING_EVENT_ID: NULL
NESTING_EVENT_TYPE: NULL
1 row in set (0.00 sec)
mysql> select * from events_statements_history \G
*************************** 1. row ***************************
THREAD_ID: 22
EVENT_ID: 77
END_EVENT_ID: 77
EVENT_NAME: statement/sql/select
SOURCE: mysqld.cc:903
TIMER_START: 12919040536455000
TIMER_END: 12919040870255000
TIMER_WAIT: 333800000
LOCK_TIME: 143000000
SQL_TEXT: select * from events_statements_history
DIGEST: 77d3399ea8360ffc7b8d584c0fac948a
DIGEST_TEXT: SELECT * FROM `events_statements_history`
CURRENT_SCHEMA: performance_schema
OBJECT_TYPE: NULL
OBJECT_SCHEMA: NULL
OBJECT_NAME: NULL
OBJECT_INSTANCE_BEGIN: NULL
MYSQL_ERRNO: 0
RETURNED_SQLSTATE: NULL
MESSAGE_TEXT: NULL
ERRORS: 0
WARNINGS: 0
ROWS_AFFECTED: 0
ROWS_SENT: 1
ROWS_EXAMINED: 1
CREATED_TMP_DISK_TABLES: 0
CREATED_TMP_TABLES: 0
SELECT_FULL_JOIN: 0
SELECT_FULL_RANGE_JOIN: 0
SELECT_RANGE: 0
SELECT_RANGE_CHECK: 0
SELECT_SCAN: 1
SORT_MERGE_PASSES: 0
SORT_RANGE: 0
SORT_ROWS: 0
SORT_SCAN: 0
NO_INDEX_USED: 1
NO_GOOD_INDEX_USED: 0
NESTING_EVENT_ID: NULL
NESTING_EVENT_TYPE: NULL
*************************** 2. row ***************************
THREAD_ID: 22
EVENT_ID: 78
END_EVENT_ID: 78
EVENT_NAME: statement/sql/show_grants
SOURCE: mysqld.cc:903
TIMER_START: 12922392541028000
TIMER_END: 12922392657515000
TIMER_WAIT: 116487000
LOCK_TIME: 0
SQL_TEXT: show grants
DIGEST: 63ca75101f4bfc9925082c9a8b06503b
DIGEST_TEXT: SHOW GRANTS
CURRENT_SCHEMA: performance_schema
OBJECT_TYPE: NULL
OBJECT_SCHEMA: NULL
OBJECT_NAME: NULL
OBJECT_INSTANCE_BEGIN: NULL
MYSQL_ERRNO: 0
RETURNED_SQLSTATE: NULL
MESSAGE_TEXT: NULL
ERRORS: 0
WARNINGS: 0
ROWS_AFFECTED: 0
ROWS_SENT: 0
ROWS_EXAMINED: 0
CREATED_TMP_DISK_TABLES: 0
CREATED_TMP_TABLES: 0
SELECT_FULL_JOIN: 0
SELECT_FULL_RANGE_JOIN: 0
SELECT_RANGE: 0
SELECT_RANGE_CHECK: 0
SELECT_SCAN: 0
SORT_MERGE_PASSES: 0
SORT_RANGE: 0
SORT_ROWS: 0
SORT_SCAN: 0
NO_INDEX_USED: 0
NO_GOOD_INDEX_USED: 0
NESTING_EVENT_ID: NULL
NESTING_EVENT_TYPE: NULL
*************************** 3. row ***************************
THREAD_ID: 22
EVENT_ID: 74
END_EVENT_ID: 74
EVENT_NAME: statement/sql/show_grants
SOURCE: mysqld.cc:903
TIMER_START: 12887992696398000
TIMER_END: 12887992796352000
TIMER_WAIT: 99954000
LOCK_TIME: 0
SQL_TEXT: show grants
DIGEST: 63ca75101f4bfc9925082c9a8b06503b
DIGEST_TEXT: SHOW GRANTS
CURRENT_SCHEMA: performance_schema
OBJECT_TYPE: NULL
OBJECT_SCHEMA: NULL
OBJECT_NAME: NULL
OBJECT_INSTANCE_BEGIN: NULL
MYSQL_ERRNO: 0
RETURNED_SQLSTATE: NULL
MESSAGE_TEXT: NULL
ERRORS: 0
WARNINGS: 0
ROWS_AFFECTED: 0
ROWS_SENT: 0
ROWS_EXAMINED: 0
CREATED_TMP_DISK_TABLES: 0
CREATED_TMP_TABLES: 0
SELECT_FULL_JOIN: 0
SELECT_FULL_RANGE_JOIN: 0
SELECT_RANGE: 0
SELECT_RANGE_CHECK: 0
SELECT_SCAN: 0
SORT_MERGE_PASSES: 0
SORT_RANGE: 0
SORT_ROWS: 0
SORT_SCAN: 0
NO_INDEX_USED: 0
NO_GOOD_INDEX_USED: 0
NESTING_EVENT_ID: NULL
NESTING_EVENT_TYPE: NULL
*************************** 4. row ***************************
THREAD_ID: 22
EVENT_ID: 75
END_EVENT_ID: 75
EVENT_NAME: statement/sql/select
SOURCE: mysqld.cc:903
TIMER_START: 12890520653158000
TIMER_END: 12890521011318000
TIMER_WAIT: 358160000
LOCK_TIME: 148000000
SQL_TEXT: select * from events_statements_current
DIGEST: f06ce227c4519dd9d9604a3f1cfe3ad9
DIGEST_TEXT: SELECT * FROM `events_statements_current`
CURRENT_SCHEMA: performance_schema
OBJECT_TYPE: NULL
OBJECT_SCHEMA: NULL
OBJECT_NAME: NULL
OBJECT_INSTANCE_BEGIN: NULL
MYSQL_ERRNO: 0
RETURNED_SQLSTATE: NULL
MESSAGE_TEXT: NULL
ERRORS: 0
WARNINGS: 0
ROWS_AFFECTED: 0
ROWS_SENT: 1
ROWS_EXAMINED: 1
CREATED_TMP_DISK_TABLES: 0
CREATED_TMP_TABLES: 0
SELECT_FULL_JOIN: 0
SELECT_FULL_RANGE_JOIN: 0
SELECT_RANGE: 0
SELECT_RANGE_CHECK: 0
SELECT_SCAN: 1
SORT_MERGE_PASSES: 0
SORT_RANGE: 0
SORT_ROWS: 0
SORT_SCAN: 0
NO_INDEX_USED: 1
NO_GOOD_INDEX_USED: 0
NESTING_EVENT_ID: NULL
NESTING_EVENT_TYPE: NULL
*************************** 5. row ***************************
THREAD_ID: 22
EVENT_ID: 76
END_EVENT_ID: 76
EVENT_NAME: statement/sql/select
SOURCE: mysqld.cc:903
TIMER_START: 12895480384972000
TIMER_END: 12895480736605000
TIMER_WAIT: 351633000
LOCK_TIME: 144000000
SQL_TEXT: select * from events_statements_history
DIGEST: 77d3399ea8360ffc7b8d584c0fac948a
DIGEST_TEXT: SELECT * FROM `events_statements_history`
CURRENT_SCHEMA: performance_schema
OBJECT_TYPE: NULL
OBJECT_SCHEMA: NULL
OBJECT_NAME: NULL
OBJECT_INSTANCE_BEGIN: NULL
MYSQL_ERRNO: 0
RETURNED_SQLSTATE: NULL
MESSAGE_TEXT: NULL
ERRORS: 0
WARNINGS: 0
ROWS_AFFECTED: 0
ROWS_SENT: 1
ROWS_EXAMINED: 1
CREATED_TMP_DISK_TABLES: 0
CREATED_TMP_TABLES: 0
SELECT_FULL_JOIN: 0
SELECT_FULL_RANGE_JOIN: 0
SELECT_RANGE: 0
SELECT_RANGE_CHECK: 0
SELECT_SCAN: 1
SORT_MERGE_PASSES: 0
SORT_RANGE: 0
SORT_ROWS: 0
SORT_SCAN: 0
NO_INDEX_USED: 1
NO_GOOD_INDEX_USED: 0
NESTING_EVENT_ID: NULL
NESTING_EVENT_TYPE: NULL
5 rows in set (0.00 sec)
Notice that the output for the events_statements_table shows only the last recorded statement executed, whereas the output for events_statements_history shows recent queries from those events enabled. We enabled both the statement/sql/select andstatement/sql/show_grants instruments in this example, so events of both types are shown.
While the example is rather simplistic, there is a wealth of information we can gain from using this technique. For example, we see the output includes timing information, such as when the query started and ended as well as lock time. We also see warning and error counts, information about how the query was optimized, and indications of whether indexes were used.
The steps in this example are representative of the steps you would use to enable other instruments and events. In summary, you should do the following to enable monitoring using the Performance Schema:
1. Set the timer (applies to instruments with a timing element).
2. Enable the instrument.
3. Enable the consumer.
FILTERING EVENTS
There are two techniques for filtering events: prefiltering and postfiltering.
Prefiltering is accomplished by modifying the Performance Schema setup configuration to turn on only those events you want to collect from certain producers and collected by certain consumers. Prefiltering reduces overhead and avoids filling the history tables with metrics that you don’t need, and avoid filling tables that are not needed (by not maintaining consumers). The drawback of prefiltering is that it requires you to predict which events you want to check before you run your test.
Postfiltering is typically done by enabling a host of producers and consumers to collect as much information as possible. Filtering is done after the data is collected by using WHERE clauses on the Performance Schema tables. Postfiltering is done on a per-user basis (in the WHERE clause). You would use postfiltering in cases where you are not certain which events you need to collect: for example, when there is no repeatable use case.
Which to use depends on your preference for the amount of data to collect. If you know what you are looking for (the metrics to measure) and you want only to record those events, prefiltering will be the technique to use. On the other hand, if you are unsure of what you are looking for or you need to generate data metrics over time, you may want to consider postfiltering and explore the Performance Schema tables using SELECT statements to narrow the scope of your search.
Using Performance Schema to Diagnose Performance Problems
This section presents an alternative to the methodology listed in the online reference manual for diagnosing problems using the Performance Schema. It includes a much improved process that ensures your server is returned to its original state.
Like the example in the reference manual, the methodology assumes you have a set of operations that exhibit a repeatable problem over several databases.
One word of caution: it is likely your use case will not be so cut and dry and you may need to be able to reproduce more than just the data and the queries. For example, if your diagnosis involves problems associated with load or certain other conditions (a number of connections, a certain application, etc.), you may need to be able to reproduce the load and similar conditions.
Another condition you should sort out before using Performance Schema is what parameters, variables, and options you will use to tune your server. It does little good to tinker with your server if you are not certain what you need to tune. You may not be able to know precisely what to tune, but you should have a good idea at this point. Also, be sure to record the current value before you change it. The normal course of tuning is to change one and only one thing at a time, and to compare the performance before and after the change. If no positive change occurs, you should restore the original value before moving on to another parameter or option.
The following lists the steps you can use to diagnose your performance problem with Performance Schema:
1. Query the setup_instruments table to identify all related instruments and enable them.
2. Set up the timers for the frequency that you need to record. Most times, the defaults are the correct timer values. If you change the timers, record their original values.
3. Identify the consumers (event tables) associated with the instruments and enable them. Be sure to enable the current, history, and history_long variants.
4. Truncate the *history and *history_long tables to ensure you start with a “clean” state.
5. Reproduce the problem.
6. Query the Performance Schema tables. If your server has multiple clients running, you can isolate the rows by thread ID.
7. Observe the values and record them.
8. Tune one option/parameter/variable set.
9. Return to step 5. Repeat until performance is improved.
10.Truncate the *history and history_long tables to ensure you end with a “clean” state.
11.Disable the events you enabled.
12.Disable the instruments you enabled.
13.Return the timers to their original state.
14.Truncate the *history and history_long tables once more to ensure you end with a “clean” state.
MySQL Monitoring Taxonomy
The previous sections have demonstrated a number of devices you can use to monitor MySQL. Some devices, such as system and status variables, have many metrics you can inspect for clues to uncover the cause of the performance, accessibility, or resource issue. Learning what can or should be used is crucial to solving the problem, and can save days of research.
What is needed is a map to the various devices, tools, and metrics for monitoring MySQL. The following table presents a classification of monitoring devices you can use to effectively monitor your MySQL servers. Table 11-1 organizes tasks by focus area, device, and metric. Examples are shown to give context for the metrics.
Table 11-1. MySQL monitoring taxonomy
|
Focus |
Device |
Metric |
Example |
|
Performance |
System Variables |
Query Cache |
SHOW VARIABLES LIKE '%query_cache%' |
|
Performance |
Status Variables |
Number of Inserts |
SHOW STATUS LIKE 'com_insert' |
|
Performance |
Status Variables |
Number of Deletes |
SHOW STATUS LIKE 'com_delete' |
|
Performance |
Status Variables |
Table Lock Collisions |
SHOW STATUS LIKE 'table_locks_waited' |
|
Performance |
Logging |
Slow Queries |
SELECT * FROM slow_log ORDER BY query_time DESC |
|
Performance |
Logging |
General |
SELECT * FROM general_log |
|
Performance |
Logging |
Errors |
--log-error=file name (startup variable) |
|
Performance |
Performance Schema |
Thread Information |
SELECT * FROM threads |
|
Performance |
Performance Schema |
Mutex Information |
SELECT * FROM events_wait_current |
|
Performance |
Performance Schema |
Mutex Information |
SELECT * FROM mutex_instances |
|
Performance |
Performance Schema |
File Use Summary |
SELECT * FROM file_summary_by_instance |
|
Performance |
Storage Engine Features |
InnoDB Status |
SHOW ENGINE innodb STATUS |
|
Performance |
Storage Engine Features |
InnoDB Statistics |
SHOW STATUS LIKE '%Innodb%' |
|
Performance |
External Tools |
Processlist |
mysqladmin -uroot --password processlist --sleep 3 |
|
Performance |
External Tools |
Connection Health (graph) |
MySQL Workbench |
|
Performance |
External Tools |
Memory Health (graph) |
MySQL Workbench |
|
Performance |
External Tools |
InnoDB Rows Read |
MySQL Workbench |
|
Performance |
External Tools |
Logs |
MySQL Workbench |
|
Performance |
External Tools |
All Variables |
MySQL Workbench |
|
Performance |
External Tools |
Query Plan/Execution[a] |
MySQL Workbench |
|
Performance |
External Tools |
Benchmarking |
MySQL Benchmark Suite |
|
Availability |
Status Variables |
Connected Threads |
SHOW STATUS LIKE 'threads_connected' |
|
Availability |
Operating System Tools |
Accessibility |
ping |
|
Availability |
External Tools |
Accessibility |
mysqladmin -uroot --password extended-status --relative --sleep 3 |
|
Resources |
Status Variables |
Storage Engines Supported |
SHOW ENGINES |
|
Resources |
Operating System Tools |
CPU Usage |
top -n 1 -pid mysqld_pid |
|
Resources |
Operating System Tools |
RAM Usage |
top -n 1 -pid mysqld_pid |
|
Resources |
MySQL Utilities |
Disk Usage |
mysqldiskusage |
|
Resources |
MySQL Utilities |
Server Information |
mysqlserverinfo |
|
Resources |
MySQL Utilities |
Replication Health |
mysqlepladmin |
|
[a] You can also use the EXPLAIN SQL command. |
|||
As you can see, the bulk of monitoring techniques are geared toward performance monitoring. This is no surprise, given that the database server is often the focus of many applications and potentially thousands of users. You can also see from this table that there are several devices you can use to help investigate performance problems. Often, several of these devices and the metrics they expose will lead you to the solution to your performance issue. However, now that you have a road map of how to approach MySQL monitoring, you can use it to help focus your efforts on the appropriate devices.
It is often the case that you need to investigate performance problems for a particular database (or several databases) or must improve the performance of a set of queries that are causing performance bottlenecks in your applications. We study the techniques and best practices for improving database and query performance in the following sections.
Database Performance
Monitoring the performance of an individual database is one of the few areas in the MySQL feature set where community and third-party developers have improved the MySQL experience. MySQL includes some basic tools you can use to improve performance, but they do not have the sophistication of some other system-tuning tools. Due to this limitation, most MySQL DBAs earn their pay through experience in relational query optimization techniques. We recognize there are several excellent references that cover database performance in great detail and many readers are likely to be well versed in basic database optimization. Here are a few resources for you to turn to:
§ Refactoring SQL Applications by Stephane Faroult and Pascal L’Hermite (O’Reilly)
§ SQL and Relational Theory: How to Write Accurate SQL Code by C.J. Date (O’Reilly)
§ SQL Cookbook by Anthony Mollinaro (O’Reilly)
Rather than reintroducing query optimization techniques, we will concentrate on how you can work with the tools available in MySQL to assist in optimizing databases. We will use a simple example and a known sample database to illustrate the use of the query performance command in MySQL. In the next section, we list best practices for improving database performance.
Measuring Database Performance
Traditionally, database management systems have provided profiling tools and indexing tools that report statistics you can use to fine-tune indexes. Although there are some basic elements that can help you improve database performance in MySQL, there is no advanced profiling tool available as open source.
Although the basic MySQL installation does not include formal tools for monitoring database improvement, the MySQL Enterprise Manager suite offers a host of performance monitoring features. We will discuss this tool in more detail in Chapter 16.
Fortunately, MySQL provides a few simple tools to help you determine whether your tables and queries are optimal. They are all SQL commands and include EXPLAIN, ANALYZE TABLE, and OPTIMIZE TABLE. The following sections describe each of these commands in greater detail.
Using EXPLAIN
The EXPLAIN command gives information about how a SELECT statement (EXPLAIN works only for SELECT statements) can be executed. Here is the syntax for EXPLAIN (note that EXPLAIN is a synonym for the DESCRIBE command found in other database systems):
[EXPLAIN | DESCRIBE] [EXTENDED] SELECT select options
You can also use the EXPLAIN and DESCRIBE commands to view details about the columns or partitions of a table. The syntax for this version of the command is:
[EXPLAIN | DESCRIBE] [PARTITIONS SELECT * FROM] table_name
NOTE
A synonym for EXPLAIN table_name is SHOW COLUMNS FROM table_name.
We will discuss the first use of the EXPLAIN command, examining a SELECT command to see how the MySQL optimizer executes the statement. The results of this contain a step-by-step list of join operations that the optimizer predicts it would require to execute the statement.
The best use of this command is to determine whether you have the best indexes on your tables to allow for more precise targeting of candidate rows. You can also use the results to test the various optimizer override options. While this is an advanced technique and generally discouraged, under the right circumstances you may encounter a query that runs faster with certain optimizer options. We will see an example of this later in this section.
Now let’s look at some examples of the EXPLAIN command in action. The following examples are queries executed on the sakila sample database provided for MySQL development and experimentation.
Let’s begin with a simple and seemingly harmless query. Let’s say we want to see all of the films rated higher than a PG rating. The result set contains a single row with the following columns:
id
Sequence number of the statement in order of execution
select_type
The type of statement executed
table
The table operated on for this step
type
The type of join to be used
possible_keys
A list of columns available if there are indexes that include the primary key
key
The key selected by the optimizer
key_len
The length of the key or portion of the key used
ref
Constraints or columns to be compared
rows
An estimate of the number of rows to process
extra
Additional information from the optimizer
NOTE
If the type column shows ALL, you are doing a full table scan. You should strive to avoid that by adding indexes or rewriting your query. Similarly, if this column shows INDEX, you are doing a full index scan, which is very inefficient. See the online MySQL Reference Manual for more details on the types of joins and their consequences.
Example 11-6 shows how the MySQL optimizer executes this statement. We use the \G to request a vertical display format for clarity.
The table we are using in the example contains a field (column) that is defined as an enumerated type. Enumerated types permit you to provide a list of possible values. If you did not use the enumerated type and defined a lookup table, you would have to perform a join to select results with the value of the field. Thus, enumerated values can replace small lookup tables and therefore enumerated values can be used to improve performance.
This is because the text for the enumerated values is stored only once—in the table header structures. What is saved in the rows is a numeric reference value that forms an index (array index) of the enumerated value. Enumerated value lists can save space and can make traversing the data a bit more efficient. An enumerated field type allows one and only one value.
In the following example, the film table in the sakila database has an enumerated field named rating taking the values G, PG, PG-13, R, and NC-17. In the examples that follow, we will see how this enumerated value field can be used (and misused) in queries.
Example 11-6. A simple SELECT statement
mysql> EXPLAIN SELECT * FROM film WHERE rating > 'PG' \G
*************************** 1. row ***************************
id: 1
select_type: SIMPLE
table: film
type: ALL
possible_keys: NULL
key: NULL
key_len: NULL
ref: NULL
rows: 892
Extra: Using where
1 row in set (0.01 sec)
You can see from this output that the optimizer has only one step to execute and that it is not using any indexes. This makes sense because we are not using any columns with indexes. Furthermore, even though there is a WHERE clause, the optimizer will still have to do a full table scan. This may be the right choice when you consider the columns used and the lack of indexes. However, if we ran this query hundreds of thousands of times, the full table scan would be a very poor use of time. In this case, we know from looking at the results that adding an index should improve execution (Example 11-7).
Example 11-7. Adding an index to improve query performance
mysql> ALTER TABLE film ADD INDEX film_rating (rating);
Query OK, 0 rows affected (0.42 sec)
Records: 0 Duplicates: 0 Warnings: 0
Let’s add an index to the table and try again. Example 11-8 shows the improved query plan.
Example 11-8. Improved query plan
mysql> EXPLAIN SELECT * FROM film WHERE rating > 'PG' \G
*************************** 1. row ***************************
id: 1
select_type: SIMPLE
table: film
type: ALL
possible_keys: film_rating
key: NULL
key_len: NULL
ref: NULL
rows: 892
Extra: Using where
1 row in set (0.00 sec)
NOTE
For those of you with sharp eyes who have already spotted the problem, bear with us as we work through it.
Here we see that the query has now identified an index (possible_keys) but is still not using the index, because the key field is NULL. So what can we do? For this simple example, you may note that only 892 rows are expected to be read. The actual row count is 1,000 rows and the result set would contain only 418 rows. Clearly, it would be a much faster query if it read only 42% of the rows!
Now let’s see whether we can get any additional information from the optimizer by using the EXTENDED keyword. This keyword allows us to see extra information via the SHOW WARNINGS command. You should issue the command immediately after the EXPLAIN command. The warning text describes how the optimizer identifies table and column names in the statement, the internal rewrite of the query, any optimizer rules applied, and any additional notes about the execution. Example 11-9 shows the results of using the EXTENDED keyword.
Example 11-9. Using the EXTENDED keyword for more information
mysql> EXPLAIN EXTENDED SELECT * FROM film WHERE rating > 'PG' \G
*************************** 1. row ***************************
id: 1
select_type: SIMPLE
table: film
type: ALL
possible_keys: film_rating
key: NULL
key_len: NULL
ref: NULL
rows: 892
filtered: 100.00
Extra: Using where
1 row in set, 1 warning (0.00 sec)
mysql> SHOW WARNINGS \G
*************************** 1. row ***************************
Level: Note
Code: 1003
Message: select `sakila`.`film`.`film_id` AS `film_id`,
`sakila`.`film`.`title` AS `title`,`sakila`.`film`.`description` AS `description`,
`sakila`.`film`.`release_year` AS `release_year`,
`sakila`.`film`.`language_id` AS `language_id`,
`sakila`.`film`.`original_language_id` AS `original_language_id`,
`sakila`.`film`.`rental_duration` AS `rental_duration`,
`sakila`.`film`.`rental_rate` AS `rental_rate`,
`sakila`.`film`.`length` AS `length`,
`sakila`.`film`.`replacement_cost` AS `replacement_cost`,
`sakila`.`film`.`rating` AS `rating`,
`sakila`.`film`.`special_features` AS `special_features`,
`sakila`.`film`.`last_update` AS `last_update`
from `sakila`.`film` where (`sakila`.`film`.`rating` > 'PG')
1 row in set (0.00 sec)
This time, there is one warning that contains information from the optimizer, displaying a rewritten form of the query to include all columns and explicitly reference the column in the WHERE clause. While this has told us the query can be written a bit better, it doesn’t suggest any performance improvements. Fortunately, we can make it more efficient.
Let’s see what happens when we issue a query for a specific rating rather than using a range query. We will see the optimization with the index and without. Example 11-10 shows the results.
Example 11-10. Removing the range query
mysql> EXPLAIN SELECT * FROM film WHERE rating = 'R' \G
*************************** 1. row ***************************
id: 1
select_type: SIMPLE
table: film
type: ref
possible_keys: film_rating
key: film_rating
key_len: 2
ref: const
rows: 195
Extra: Using where
1 row in set (0.00 sec)
mysql> ALTER TABLE film DROP INDEX film_rating;
Query OK, 0 rows affected (0.37 sec)
Records: 0 Duplicates: 0 Warnings: 0
mysql> EXPLAIN SELECT * FROM film WHERE rating = 'R' \G
*************************** 1. row ***************************
id: 1
select_type: SIMPLE
table: film
type: ALL
possible_keys: NULL
key: NULL
key_len: NULL
ref: NULL
rows: 892
Extra: Using where
1 row in set (0.00 sec)
Now we see a little improvement. Notice that the first query plan does indeed use the index and results in a much improved plan. The question then remains, why doesn’t the optimizer use the index? In this case, we’ve used a nonunique index on an enumerated field. What sounded like a really good idea is actually not much help at all for a range query of enumerated values. However, we could rewrite the query differently (in several ways, actually) to produce better performance. Let’s look at the query again.
We know we want all films rated higher than PG. We assumed that the rating is ordered and that the enumerated field reflects the order. Thus, it appears the order is maintained if we accept the enumeration index for each value that corresponds to the order (e.g., G = 1, PG = 2, etc.). But what if the order is incorrect or if (like in this example) the list of values is incomplete?
In the example we’ve chosen, where we want all of the films that have a rating higher than PG, we know from our list of ratings that this includes films with a rating of R or NC-17. Rather than using a range query, let’s examine what the optimizer would do if we listed these values.
Recall that we removed the index, so we will try the query first without the index, then add the index and see if we have an improvement. Example 11-11 shows the improved query.
Example 11-11. Improved query without range
mysql> EXPLAIN SELECT * FROM film WHERE rating = 'R' OR rating = 'NC-17' \G
*************************** 1. row ***************************
id: 1
select_type: SIMPLE
table: film
type: ALL
possible_keys: NULL
key: NULL
key_len: NULL
ref: NULL
rows: 892
Extra: Using where
1 row in set (0.00 sec)
mysql> ALTER TABLE film ADD INDEX film_rating (rating);
Query OK, 0 rows affected (0.40 sec)
Records: 0 Duplicates: 0 Warnings: 0
mysql> EXPLAIN SELECT * FROM film WHERE rating = 'R' OR rating = 'NC-17' \G
*************************** 1. row ***************************
id: 1
select_type: SIMPLE
table: film
type: ALL
possible_keys: film_rating
key: NULL
key_len: NULL
ref: NULL
rows: 892
Extra: Using where
1 row in set (0.00 sec)
Alas, that didn’t work either. Again, we have chosen to query on a column that has an index but is not an index the optimizer can use. However, the optimizer can use the index for a simple equality comparison because the values being compared are stored in the index. We can exploit this by rewriting the query as the union of two queries. Example 11-12 shows the rewritten query.
Example 11-12. Query rewritten using UNION
mysql> EXPLAIN SELECT * FROM film WHERE rating = 'R' UNION
SELECT * FROM film WHERE rating = 'NC-17' \G
*************************** 1. row ***************************
id: 1
select_type: PRIMARY
table: film
type: ref
possible_keys: film_rating
key: film_rating
key_len: 2
ref: const
rows: 195
Extra: Using where
*************************** 2. row ***************************
id: 2
select_type: UNION
table: film
type: ref
possible_keys: film_rating
key: film_rating
key_len: 2
ref: const
rows: 210
Extra: Using where
*************************** 3. row ***************************
id: NULL
select_type: UNION RESULT
table: <union1,2>
type: ALL
possible_keys: NULL
key: NULL
key_len: NULL
ref: NULL
rows: NULL
Extra:
3 rows in set (0.00 sec)
Success! Now we can see we have a query plan that is using the index and processing far fewer rows. We can see from the result of the EXPLAIN command that the optimizer is running each query individually (steps execute from row 1 down to row n) and combines the result in the last step.
NOTE
MySQL has a session status variable named last_query_cost that stores the cost of the most recent query executed. Use this variable to compare two query plans for the same query. For example, after each EXPLAIN, check the value of the variable. The query with the lowest cost value is considered the more efficient (less time-consuming) query. A value of 0 indicates that no query has been submitted for compilation.
While this exercise may seem to be a lot of work for a little gain, consider that there are many such queries being executed in applications without anyone noticing the inefficiency. Normally we encounter these types of queries only when the row count gets large enough to notice. In the sakiladatabase, there are only 1,000 rows, but what if there were a million or tens of millions of rows?
EXPLAIN is the only tool in a standard MySQL distribution that you can use by itself to profile a query in MySQL. The “Optimization” chapter in the online MySQL Reference Manual has a host of tips and tricks to help an experienced DBA improve the performance of various query forms.
Using ANALYZE TABLE
The MySQL optimizer, like most traditional optimizers, uses statistical information about tables to perform its analysis of the optimal query execution plan. These statistics include information about indexes, distribution of values, and table structure, among many items.
The ANALYZE TABLE command recalculates the key distribution for one or more tables. This information determines the table order for a join operation. The syntax for the ANALYZE TABLE command is:
ANALYZE [LOCAL | NO_WRITE_TO_BINLOG] TABLE table_list
You should run this command whenever there have been significant updates to the table (e.g., bulk-loaded data). The system must have a read lock on the table for the duration of the operation.
You can update the key distribution only for MyISAM and InnoDB tables. Other storage engines don’t support this tool, but all storage engines must report index cardinality statistics to the optimizer if they support indexes. Some storage engines, particularly third-party engines, have their own specific built-in statistics. A typical execution of the command is shown in Example 11-13. Running the command on a table with no indexes has no effect, but will not result in an error.
Example 11-13. Analyzing a table to update key distribution
mysql> ANALYZE TABLE film;
+-------------+---------+----------+----------+
| Table | Op | Msg_type | Msg_text |
+-------------+---------+----------+----------+
| sakila.film | analyze | status | OK |
+-------------+---------+----------+----------+
1 row in set (0.00 sec)
WARNING
If you are using InnoDB, there are some cases when you should not use this command. See innodb_stats_persistent in the online reference manual for more details.
In this example, we see that the analysis is complete and there are no unusual conditions. Should there be any unusual events during the execution of the command, the Msg_type field can indicate info, Error, or warning. In these cases, the Msg_text field will give you additional information about the event. You should always investigate the situation if you get any result other than status and OK.
For example, if the .frm file for your table is corrupt or missing, you could see the following messages. In other cases, the output may indicate the table is unreadable (e.g., permission/access issues). Also, the command performs checks specific to the storage engine. In the case of InnoDB, the checks are more thorough and when there are errors, you are likely to see InnoDB-specific errors.
Example 11-14. Analyze table errors
mysql> ANALYZE TABLE test.t1;
+---------+---------+----------+-------------------------------+
| Table | Op | Msg_type | Msg_text |
+---------+---------+----------+-------------------------------+
| test.t1 | analyze | Error | Table 'test.t1' doesn't exist |
| test.t1 | analyze | status | Operation failed |
+---------+---------+----------+-------------------------------+
2 rows in set (0.00 sec)
You can see the status of your indexes using the SHOW INDEX command. A sample of the output of the film table is shown in Example 11-15. In this case, we’re interested in the cardinality of each index, which is an estimate of the number of unique values in it. We omit the other columns from the display for brevity. For more information about SHOW INDEX, see the online MySQL Reference Manual.
Example 11-15. The indexes for the film table
mysql> SHOW INDEX FROM film \G
*************************** 1. row ***************************
Table: film
Non_unique: 0
Key_name: PRIMARY
Seq_in_index: 1
Column_name: film_id
Collation: A
Cardinality: 1028
…
*************************** 2. row ***************************
Table: film
Non_unique: 1
Key_name: idx_title
Seq_in_index: 1
Column_name: title
Collation: A
Cardinality: 1028
…
*************************** 3. row ***************************
Table: film
Non_unique: 1
Key_name: idx_fk_language_id
Seq_in_index: 1
Column_name: language_id
Collation: A
Cardinality: 2
…
*************************** 4. row ***************************
Table: film
Non_unique: 1
Key_name: idx_fk_original_language_id
Seq_in_index: 1
Column_name: original_language_id
Collation: A
Cardinality: 2
…
*************************** 5. row ***************************
Table: film
Non_unique: 1
Key_name: film_rating
Seq_in_index: 1
Column_name: rating
Collation: A
Cardinality: 11
Sub_part: NULL
Packed: NULL
Null: YES
Index_type: BTREE
Comment:
5 rows in set (0.00 sec)
Using OPTIMIZE TABLE
Tables that are updated frequently with new data and deletions can become fragmented quickly and, depending on the storage engine, can have gaps of unused space or suboptimal storage structures. A badly fragmented table can result in slower performance, especially during table scans.
The OPTIMIZE TABLE command restructures the data structures for one or more tables. This is especially beneficial for row formats with variable length fields (rows). It can be used only for MyISAM and InnoDB tables. The syntax is:
OPTIMIZE [LOCAL | NO_WRITE_TO_BINLOG] TABLE table_list
TIP
The LOCAL or NO_WRITE_TO_BINLOG keyword prevents the command from being written to the binary log (and thereby from being replicated in a replication topology). This can be very useful if you want to experiment or tune while replicating data or if you want to omit this step from your binary log and not replay it during PITR.
You should run this command whenever there have been significant updates to the table (e.g., a large number of deletes and inserts). This operation is designed to rearrange data elements into a more optimal structure and could run for quite a long time (holding write locks on the table). So this is one operation that is best run during times of low loads.
If the table cannot be reorganized (perhaps because there are no variable length records or there is no fragmentation), the command will recreate the table and update the statistics. A sample output from this operation is shown in Example 11-16.
Example 11-16. The optimize table command
mysql> OPTIMIZE TABLE film \G
*************************** 1. row ***************************
Table: sakila.film
Op: optimize
Msg_type: note
Msg_text: Table does not support optimize, doing recreate + analyze instead
*************************** 2. row ***************************
Table: sakila.film
Op: optimize
Msg_type: status
Msg_text: OK
2 rows in set (0.44 sec)
Here we see two rows in the result set. The first row tells us that the OPTIMIZE TABLE command could not be run and that the command will instead recreate the table and run the ANALYZE TABLE command. The second row is the result of the ANALYZE TABLE step.
Like the ANALYZE TABLE command, any unusual events during the execution of the command are indicated in the Msg_type field by info, Error, or warning. In these cases, the Msg_text field will give you additional information about the event. You should always investigate the situation if you get any result other than status and OK.
WARNING
When using InnoDB, especially when there are secondary indexes (which usually get fragmented), you may not see any improvement or may encounter long processing times for the operation unless you use the InnoDB “fast index create” option, but this depends on how the index was constructed. It may not apply to all indexes.
Best Practices for Database Optimization
As mentioned previously, there are many great examples, techniques, and practices concerning optimization that come highly recommended by the world’s best database performance experts. Because monitoring is used to detect and diagnose performance issues, we include these best practices as a summary for the lessons learned about monitoring MySQL.
For brevity, and to avoid controversial techniques, we will discuss a few commonly agreed-upon best practices for improving database performance. We encourage you to examine some of the texts referenced earlier for more detail on each of these practices.
Use indexes sparingly but effectively
Most database professionals understand the importance of indexes and how they improve performance. Using the EXPLAIN command is often the best way to determine which indexes are needed. While the problem of not having enough indexes is understood, having too much of a good thing can also cause a performance issue.
As you saw when exploring the EXPLAIN command, it is possible to create too many indexes or indexes that are of little or no use. Each index adds overhead for every insertion and deletion against the table. In some cases, having too many indexes with wide (as in many values) distributions can slow insert and delete performance considerably. It can also lead to slower replication and restore operations.
You should periodically check your indexes to ensure they are all meaningful and utilized. Remove any indexes that are not used, have limited use, or have wide distributions. You can often use normalization to overcome some of the problems with wide distributions.
Use normalization, but don’t overdo it
Many database experts who studied computer science or a related discipline may have fond memories (or nightmares) of learning the normal forms as described by C.J. Date and others. We won’t revisit the material here; rather, we will discuss the impacts of taking those lessons too far.
Normalization (at least to third normal form) is a well-understood and standard practice. However, there are situations in which you may want to violate these rules.
The use of lookup tables is often a by-product of normalization (i.e., you create a special table that contains a list of related information that is used frequently in other tables). However, you can impede performance when you use lookup tables with limited distributions (only a few rows or a limited number of rows with small values) that are accessed frequently. In this case, every time your users query information, they must use a join to get the complete data. Joins are expensive, and frequently accessed data can add up over time. To mitigate this potential performance problem, you can use enumerated fields to store the data rather than a lookup table. For example, rather than creating a table for hair color (despite what some subcultures may insist upon, there really are only a limited number of hair color types), you can use an enumerated field and avoid the join altogether.
For example, if you created a child table to contain the possible values of hair color, the master table would contain a field whose value is an index into the hair color table. When you execute a query to get results from the master table, you would have to do a join to get the values for the hair color field. If you used an enumerated field, you can eliminate the need for the join and thus improve performance.
Another potential issue concerns calculated fields. Typically, we do not store data that is formed from other data (such as sales tax or the sum of several columns). Rather, the calculated data is performed either during data retrieval via a view or in the application. This may not be a problem if the calculations are simple or are seldom performed, but what if the calculations are complex and are performed many times? In this case, you are potentially wasting a lot of time performing these calculations. One way to mitigate this problem is to use a trigger to calculate the value and store it in the table. While this technically duplicates data (a big no-no for normalization theorists), it can improve performance when a lot of calculations are being performed.
Use the right storage engine for the task
One of the most powerful features of MySQL is its support for different storage engines. Storage engines govern how data is stored and retrieved. MySQL supports a number of them, each with unique features and uses. This allows database designers to tune their database performance by selecting the storage engine that best meets their application needs. For example, if you have an environment that requires transaction control for highly active databases, choose a storage engine best suited for this task. You may also have identified a view or table that is often queried but almost never updated (e.g., a lookup table). In this case, you may want to use a storage engine that keeps the data in memory for faster access.
Recent changes to MySQL have permitted some storage engines to become plug-ins, and some distributions of MySQL have only certain storage engines enabled by default. To find out which storage engines are enabled, issue the SHOW ENGINES command. Example 11-17 shows the storage engines on a typical installation.
Example 11-17. Storage engines
mysql> SHOW ENGINES \G
*************************** 1. row ***************************
Engine: InnoDB
Support: YES
Comment: Supports transactions, row-level locking, and foreign keys
Transactions: YES
XA: YES
Savepoints: YES
*************************** 2. row ***************************
Engine: MyISAM
Support: DEFAULT
Comment: Default engine as of MySQL 3.23 with great performance
Transactions: NO
XA: NO
Savepoints: NO
*************************** 3. row ***************************
Engine: BLACKHOLE
Support: YES
Comment: /dev/null storage engine (anything you write to it disappears)
Transactions: NO
XA: NO
Savepoints: NO
*************************** 4. row ***************************
Engine: CSV
Support: YES
Comment: CSV storage engine
Transactions: NO
XA: NO
Savepoints: NO
*************************** 5. row ***************************
Engine: MEMORY
Support: YES
Comment: Hash based, stored in memory, useful for temporary tables
Transactions: NO
XA: NO
Savepoints: NO
*************************** 6. row ***************************
Engine: FEDERATED
Support: NO
Comment: Federated MySQL storage engine
Transactions: NULL
XA: NULL
Savepoints: NULL
*************************** 7. row ***************************
Engine: ARCHIVE
Support: YES
Comment: Archive storage engine
Transactions: NO
XA: NO
Savepoints: NO
*************************** 8. row ***************************
Engine: MRG_MYISAM
Support: YES
Comment: Collection of identical MyISAM tables
Transactions: NO
XA: NO
Savepoints: NO
8 rows in set (0.00 sec)
The result set includes all of the known storage engines; whether they are installed and configured (where Support = YES); a note about the engine’s features; and whether it supports transactions, distributed transactions (XA), or savepoints.
A savepoint is a named event that you can use like a transaction. You can establish a savepoint and either release (delete the savepoint) or roll back the changes since the savepoint. See the online MySQL Reference Manual for more details about savepoints.
With so many storage engines to choose from, it can be confusing when designing your database for performance. You can choose the storage engine for a table using the ENGINE parameter on the CREATE statement, and you can change the storage engine by issuing an ALTER TABLEcommand:
CREATE TABLE t1 (a int) ENGINE=InnoDB;
ALTER TABLE t1 ENGINE=MEMORY;
The following describes each of the storage engines briefly, including some of the uses for which they are best suited:
InnoDB
The premier transactional support storage engine, InnoDB is also the default engine.[8] This engine will be used if you omit the ENGINE option on the CREATE statement. You should always choose this storage engine when requiring transactional support; InnoDB and NDB are currently the only transactional engines in MySQL. There are third-party storage engines in various states of production that can support transactions, but the only “out-of-the-box” option is InnoDB. InnoDB is the storage engine of choice for high reliability and transaction-processing environments.
MyISAM
MyISAM is often used for data warehousing, ecommerce, and enterprise applications where most operations are reads (called read-mostly). MyISAM uses advanced caching and indexing mechanisms to improve data retrieval and indexing. MyISAM is an excellent choice when you need storage in a wide variety of applications requiring fast retrieval of data without the need for transactions.
Blackhole
This storage engine is very interesting. It doesn’t store anything at all. In fact, it is what its name suggests—data goes in but never returns. All jocularity aside, the Blackhole storage engine fills a very special need. If binary logging is enabled, SQL statements are written to the logs, and Blackhole is used as a relay agent (or proxy) in a replication topology. In this case, the relay agent processes data from the master and passes it on to its slaves but does not actually store any data. The Blackhole storage engine can be handy in situations where you want to test an application to ensure it is writing data, but you don’t want to store anything on disk.
CSV
This storage engine can create, read, and write comma-separated value (CSV) files as tables. The CSV storage engine is best used to rapidly export structured business data to spreadsheets. The CSV storage engine does not provide any indexing mechanisms and has certain issues in storing and converting date/time values (they do not obey locality during queries). The CSV storage engine is best used when you want to permit other applications to share or exchange data in a common format. Given that it is not as efficient for storing data, you should use the CSV storage engine sparingly.
NOTE
The CSV storage engine is used for writing logfiles. For example, the backup logs are CSV files and can be opened by other applications that use the CSV protocol (but not while the server is running).
Memory
This storage engine (sometimes called HEAP) is an in-memory storage that uses a hashing mechanism to retrieve frequently used data. This allows for much faster retrieval. Data is accessed in the same manner as with the other storage engines, but the data is stored in memory and is valid only during the MySQL session—the data is flushed and deleted on shutdown. Memory storage engines are typically good for situations in which static data is accessed frequently and rarely ever altered (e.g., lookup tables). Examples include zip code listings, state and county names, category listings, and other data that is accessed frequently and seldom updated. You can also use the Memory storage engine for databases that utilize snapshot techniques for distributed or historical data access.
Federated
Creates a single table reference from multiple database systems. The Federated storage engine allows you to link tables together across database servers. This mechanism is similar in purpose to the linked data tables available in other database systems. The Federated storage engine is best suited for distributed or data mart environments. The most interesting feature of the Federated storage engine is that it does not move data, nor does it require the remote tables to use the same storage engine.
CAUTION
The Federated storage engine is currently disabled in most distributions of MySQL. Consult the online MySQL Reference Manual for more details.
Archive
This storage engine can store large amounts of data in a compressed format. The Archive storage engine is best suited for storing and retrieving large amounts of seldom-accessed archival or historical data. Indexes are not supported and the only access method is via a table scan. Thus, you should not use the Archive storage engine for normal database storage and retrieval.
Merge
This storage engine (MRG_MYISAM) can encapsulate a set of MyISAM tables with the same structure (table layout or schema) referenced as a single table. Thus, the tables are partitioned by the location of the individual tables, but no additional partitioning mechanisms are used. All tables must reside on the same server (but not necessarily the same database).
NOTE
When a DROP command is issued on a merged table, only the Merge specification is removed. The original tables are not altered.
The best attribute of the Merge storage engine is speed. It permits you to split a large table into several smaller tables on different disks, combine them using a merge table specification, and access them simultaneously. Searches and sorts will execute more quickly, because there is less data in each table to manipulate. Also, repairs on tables are more efficient because it is faster and easier to repair several smaller individual tables than a single large table. Unfortunately, this configuration has several disadvantages:
§ You must use identical MyISAM tables to form a single merge table.
§ The replace operation is not allowed.
§ Indexes are less efficient than for a single table.
The Merge storage engine is best suited for very large database (VLDB) applications, like data warehousing, where data resides in more than one table in one or more databases. You can also use it to help solve some partitioning problems where you want to partition horizontally but do not want to add the complexity of setting up the partition table options.
Clearly, with so many choices of storage engines, it is possible to choose engines that can hamper performance or, in some cases, prohibit certain solutions. For example, if you never specify a storage engine when the table is created, MySQL uses the default storage engine. If not set manually, the default storage engine reverts to the platform-specific default, which may be MyISAM on some platforms. This may mean you are missing out on optimizing lookup tables or limiting features of your application by not having transactional support. It is well worth the extra time to include an analysis of storage engine choices when designing or tuning your databases.
Use views for faster results via the query cache
Views are a very handy way to encapsulate complex queries to make it easier to work with the data. You can use views to limit data both vertically (fewer columns) or horizontally (a WHERE clause on the underlying SELECT statement). Both uses are very handy, and of course, the more complex views use both practices to limit the result set returned to the user or to hide certain base tables or to ensure an efficient join is executed.
Using views to limit the columns returned can help you in ways you may not have considered. It not only reduces the amount of data processed, but can also help you avoid costly SELECT * operations that users tend to do without much thought. When many of these types of operations are run, your applications are processing far too much data and this can affect performance of not only the application, but also the server, and more important, can decrease available bandwidth on your network. It’s always a good idea to use views to limit data in this manner and hide access to the base table(s) to remove any temptation users may have to access the base table directly.
Views that limit the number of rows returned also help reduce network bandwidth and can improve the performance of your applications. These types of views also protect against proliferation of SELECT * queries. Using views in this manner requires a bit more planning, because your goal is to create meaningful subsets of the data. You will have to examine the requirements for your database and understand the queries issued to form the correct WHERE clauses for these queries.
With a little effort, you may find you can create combinations of vertically and horizontally restrictive views, thereby ensuring your applications operate on only the data that is needed. The less data moving around, the more data your applications can process in the same amount of time.
Perhaps the best way to use views is to eliminate poorly formed joins. This is especially true when you have a complex normalized schema. It may not be obvious to users how to combine the tables to form a meaningful result set. Indeed, most of the work done by DBAs when striving for better performance is focused on correcting poorly formed joins. Sometimes this can be trivial—for example, fewer rows processed during the join operation—but most of the time the improved response time is significant.
Views can also be helpful when using the query cache in MySQL. The query cache stores the results of frequently used (accessed) queries. Using views that provide a standardized result set can improve the likelihood that the results will be cached and, therefore, retrieved more efficiently.
You can improve performance with a little design work and the judicious use of views in your databases. Take the time to examine how much data is being moved around (both the number of columns and rows) and examine your application for any query that uses joins. Spend some time forming views that limit the data and identify the most efficient joins and wrap them in a view as well. Imagine how much easier you’ll rest knowing your users are executing efficient joins.
Use constraints
The use of constraints provides another tool in your arsenal for combating performance problems. Rather than proselytizing about limitations on using constraints, we encourage you to consider constraints a standard practice and not an afterthought.
There are several types of constraints available in MySQL, including the following:
§ Unique indexes
§ Primary keys
§ Enumerated values
§ Sets
§ Default values
§ NOT NULL option
We’ve discussed using indexes and overusing indexes. Indexes help improve data retrieval by allowing the system to store and find data more quickly.
NOTE
Foreign keys are another form of constraint but are not directly related to performance. Rather, foreign keys can be used to protect referential integrity. However, it should be noted that updating tables with a lot of foreign keys or executing cascade operations can have some affect on performance. Currently, only InnoDB supports foreign keys. For more information about foreign keys, see the online MySQL Reference Manual.
Sets in MySQL are similar to enumerated values, allowing you to constrain the values in a field. You can use sets to store information that represents attributes of the data, instead of using a master/detail relationship. This not only saves space in the table (set values are bitwise combinations), but also eliminates the need to access another table for the values.
The use of the DEFAULT option to supply default values is an excellent way to prohibit problems associated with poorly constructed data. For example, if you have a numeric field that represents values used for calculations, you may want to ensure that when the field is unknown, a default value is stored for it. You can set defaults on most data types. You can also use defaults for date and time fields to avoid problems processing invalid date and time values. More important, default values can save your application from having to supply the values (or using the less reliable method of asking the user to provide them), thereby reducing the amount of data sent to the server during data entry.
You should also consider using the NOT NULL option when specifying fields that must have a value. If an entry is attempted where there are NOT NULL columns and no data values are provided, the INSERT statement will fail. This prevents data integrity issues by ensuring all important fields have values. Null values can also make certain queries on these fields take longer.
Use EXPLAIN, ANALYZE, and OPTIMIZE
We have already discussed the benefits of these commands. We list them here as a best practice to remind you that these tools are vital for diagnostic and tuning efforts. Use them often and with impunity, but follow their use carefully. Specifically, use ANALYZE and OPTIMIZE when it makes sense and not as a regular, scheduled event. We have encountered administrators who run these commands nightly, and in some cases that may be warranted, but in the general case it is not warranted and can lead to unnecessary table copies (like we saw in the earlier examples). Thus, forcing the system to copy data regularly can be a waste of time and could lead to limited access during the operation.
Now that we’ve discussed how to monitor and improve MySQL query performance, let us look at some best practices that you can use to help focus your investigation of performance.
Best Practices for Improving Performance
The details of diagnosing and improving performance of databases are covered by works devoted to the subject and indeed, the information fills many pages.
For completeness and as a general reference, we include in this section a set of best practices for combating performance anomalies; this is meant to be a checklist for you to use as a guide. We have grouped the practices by common problems.
Everything Is Slow
When the system as a whole is performing poorly, you must focus your efforts on how the system is running, starting with the operating system. You can use one or more of the following techniques to identify and improve the performance of your system:
§ Check hardware for problems.
§ Improve hardware (e.g., add memory).
§ Consider moving data to isolated disks.
§ Check the operating system for proper configuration.
§ Consider moving some applications to other servers.
§ Consider replication for scale-out.
§ Tune the server for performance.
Slow Queries
Any query that appears in the slow query log or those identified as problematic by your users or developers can be improved using one or more of the following techniques:
§ Normalize your database schema.
§ Use EXPLAIN to identify missing or incorrect indexes.
§ Use the benchmark() function to test parts of queries.
§ Consider rewriting the query.
§ Use views to standardize queries.
§ Test using the query cache (this may not work for all queries or the frequency of your access patterns).
NOTE
A replication slave does not write replicated queries to the slow query log, regardless of whether the query was written to the slow query log on the master.
Slow Applications
If an application is showing signs of performance issues, you should examine the application components to determine where the problem is located. Perhaps you will find only one module is causing the problem, but sometimes it may be more serious. The following techniques can help you identify and solve application performance problems:
§ Turn on the query cache.
§ In cases where the query cache is already enabled, turning it off may improve some queries. Consider using the query cache on demand using DEMAND mode and SELECT SQL_CACHE.
§ Consider and optimize your storage engine choices.
§ Verify the problem isn’t in the server or operating system.
§ Define benchmarks for your applications and compare to known baselines.
§ Examine internalized (written in the application) queries and maximize their performance.
§ Divide and conquer—examine one part at a time.
§ Use partitioning to spread out the data.
§ Examine your indexes for fragmentation.
Slow Replication
The performance problems related to replication, as discussed earlier, are normally isolated to problems with the database and server performance. Use the following techniques when diagnosing performance issues for replication:
§ Ensure your network is operating at peak performance.
§ Ensure your servers are configured correctly.
§ Optimize your databases.
§ Limit updates to the master.
§ Divide reads across several slaves.
§ Check the slaves for replication lag.
§ Perform regular maintenance on your logs (binary and relay logs).
§ Use compression over your network if bandwidth is limited.
§ Use inclusive and exclusive logging options to minimize what is replicated.
Conclusion
There are a lot of things to monitor on a MySQL server. We’ve discussed the basic SQL commands available for monitoring the server, the mysqladmin command-line utility, the benchmark suite, and MySQL Workbench. We have also examined some best practices for improving database performance.
Now that you know the basics of operating system monitoring, database performance, MySQL monitoring, and benchmarking, you have the tools and knowledge to successfully tune your server for optimal performance.
Joel smiled as he compiled his report about Susan’s nested query problem. It had taken a few hours of digging through logfiles to find the problem, but after he explained the overhead of the query to the developers, they agreed to change the query to use a lookup table stored in a memory table. Joel felt his boss was going to be excited to learn about his ingenuity. He clicked Send just as his boss appeared in his door frame.
“Joel!”
Joel jumped, despite knowing Mr. Summerson was there. “I’ve got the marketing application problem solved, sir,” he said quickly.
“Great! I look forward to reading about your solution.”
Joel wasn’t sure his boss would understand the technical parts of his message, but he also knew his boss would keep asking if he didn’t explain everything.
Mr. Summerson nodded once and went on his way. Joel opened an email message from Phil in Seattle complaining about replication problems and soon realized the problems extended much further than the server he had been working with.
[8] The InnoDB storage became the default storage engine in version 5.5
All materials on the site are licensed Creative Commons Attribution-Sharealike 3.0 Unported CC BY-SA 3.0 & GNU Free Documentation License (GFDL)
If you are the copyright holder of any material contained on our site and intend to remove it, please contact our site administrator for approval.
© 2016-2026 All site design rights belong to S.Y.A.