Learning Highcharts 4 (2015)
Chapter 11. Highcharts Events
In the previous chapter, we learned about the Highcharts API. In this chapter, we will go through Highcharts events handling. We will start the chapter by introducing the set of events supported by Highcharts. Then, we will build two web applications to cover most of the events; each one explores a different set of events. Although the applications are far from perfect and there is plenty of room for improvement, the sole purpose is to demonstrate how Highcharts events work. In this chapter, we will cover the following topics:
· Launching an Ajax query with a chart load event
· Activating the user interface with a chart redraw event
· Selecting and unselecting a data point with the point select and unselect events
· Zooming the selected area with the chart selection event
· Hovering over a data point with the point mouseover and mouseout events
· Using the chart click event to create plot lines
· Launching a dialog with the series click event
· Launching a pie chart with the series checkboxClick event
· Editing the pie chart with the point click, update, and remove events
Introducing Highcharts events
By now, we have gone through most of the Highcharts configurations, but there is one area not yet covered: event handling. Highcharts offers a set of event options in several areas such as chart events, series events, and axis base events; they are triggered by API calls and user interactions with the chart.
Highcharts events can be specified through object configuration while creating a chart or through APIs that accept object configurations, such as Chart.addSeries, Axis.addPlotLine, and Axis.addPlotBand.
An event object is passed by an event handler that contains mouse information and specific action data related to the event action. For example, event.xAxis[0] and event.yAxis[0] are stored in the event parameter for the chart.events.click handler. Inside each event function, the 'this' keyword can be used and refers to a Highcharts component where the event function is based. For example, the 'this' keyword in chart.events.click refers to the chart object, and the 'this' keyword in plotOptions.series.events.clickrefers to the series object being clicked.
The following is a list of Highcharts events:
· chart.events: addSeries, click, load, redraw, selection, drilldown, and drillup
· plotOptions.<series-type>.events: click, checkboxClick, hide, mouseover, mouseout, show, afterAnimate, and legendItemClick
Note
Alternatively, we can specify event options specifically to a series in the series array, such as: series[ { events: click: function { ... }, .... } ].
· plotOptions.<series-type>.point.events: click, mouseover, mouseout, remove, select, unselect, update, and legendItemClick
Note
We can define point events for a specific series, as follows: series[ { point : { events: { click: function() { ... } }, ... } ].
As for defining events for a particular data point in a series, we can specify them as follows: series[ { data: [ { events: { click: function() { ... } } ], ... } ].
· x/yAxis.events: setExtremes, and afterSetExtremes
· x/yAxis.plotBands[x].events and x/yAxis.plotLines[x].events: click, mouseover, mousemove, and mouseout
The Highcharts online documentation provides a comprehensive reference and plenty of mini examples; you are strongly advised to refer to that. There is not much point in repeating the same exercise. Instead, we will build two slightly sizable examples to utilize most of the Highcharts events and demonstrate how these events can work together in an application. Since the complete example code is too long to list in this chapter, only the relevant parts are edited and shown.
The full demo and source code can be found at http://www.joekuan.org/Learning_Highcharts/Chapter_11/chart1.html.
Portfolio history example
This application extends the historical stock chart in the previous chapter with an additional investment portfolio feature. The frontend is implemented with jQuery and jQuery UI, and the following events are covered in this example:
· chart.events: click, load, redraw, and selection
· plotOptions.series.points.events: mouseover, mouseout, select, and unselect
· xAxis/yAxis.plotLines.events: mouseover and click
The following is the startup screen of the demo, with the components labeled:
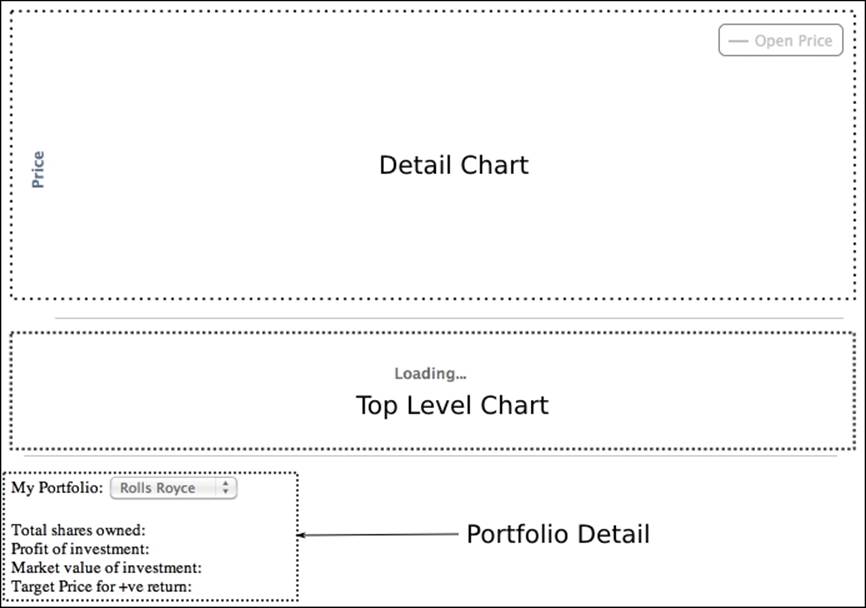
The application contains a pair of time series charts. The bottom chart is the top-level graph that shows the entire historic price movement and points to when company shares are bought and sold. The top chart is the detail chart that zooms in to the finer details when a selected area is made in the bottom graph.
As soon as the web application is loaded in a browser, both charts are created. The top-level chart is configured with a load event that automatically requests a stock historic price and portfolio history from the web server.
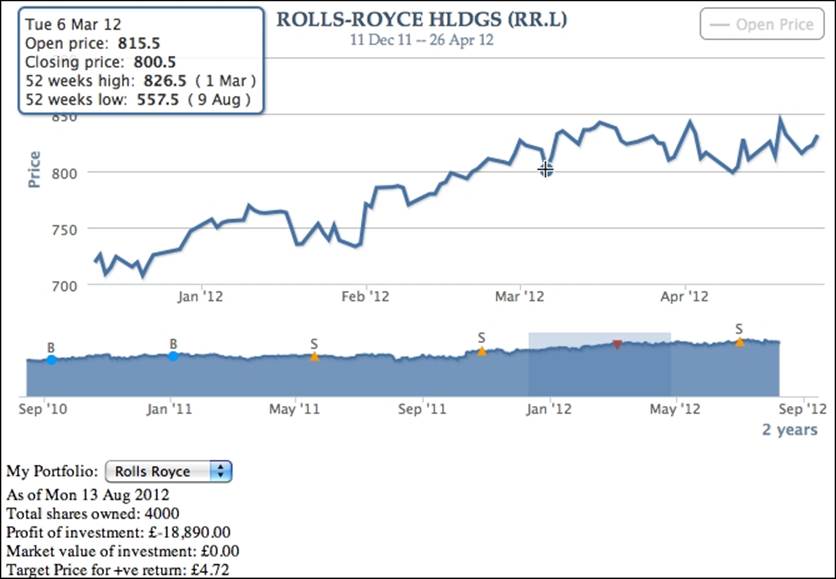
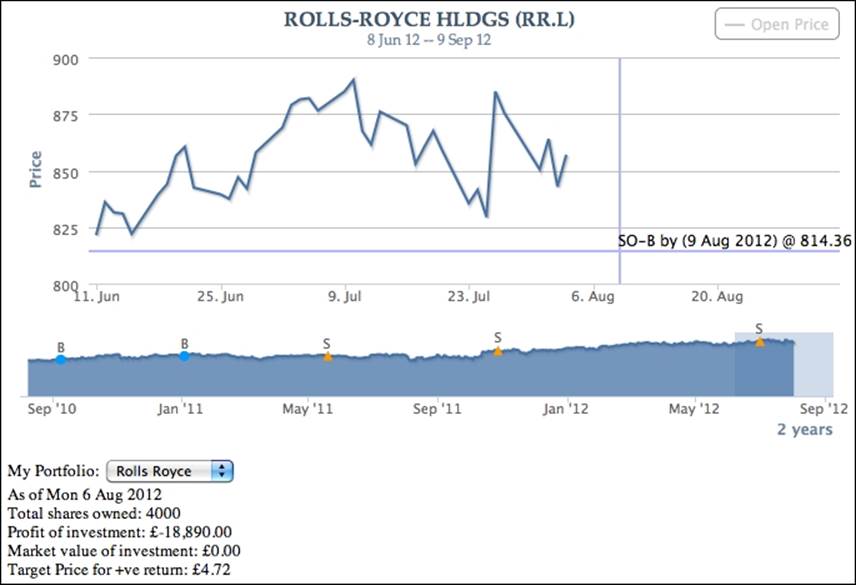
The following screenshot shows a graph after the top-level chart is auto-loaded:
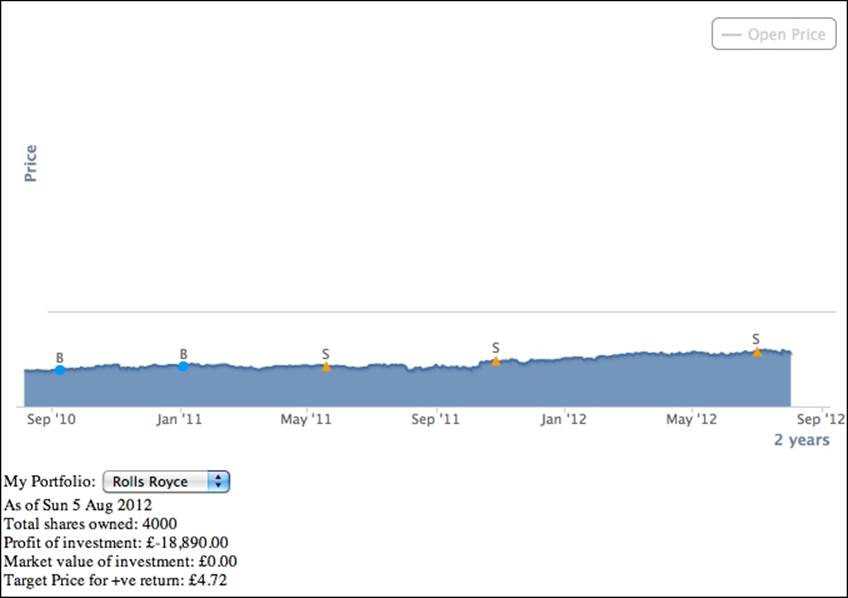
There are circular and triangular data points on top of the top-level chart. These denote the trade history. The B symbol indicates when the shares have been bought, whereas S signifies when they are sold. The information below the top-level chart is the portfolio detail for the stock as of the current date.
If we click on one of these trade history points, the portfolio detail section is updated to reflect the investment history as of the selected date. Moreover, when we select an area, it zooms in and displays the stock price movement in the detail chart. There are other features involved in event handling and we will discuss them in later sections.
The top-level chart
The following is the configuration code for the top-level chart (the bottom chart shows the entire historic price movement) and we store the chart object in the myApp namespace, as follows:
$.myApp.topChart = new Highcharts.Chart({
chart: {
zoomType: 'x',
spacingRight: 15,
renderTo: 'top-container',
events: {
// Load the default stock symbol of
// the portfolio
load: function() { .... },
// The top level time series have
// been redrawn, enable the portfolio
// select box
redraw: function() { .... },
// Selection - get all the data points from
// the selection and populate into the
// detail chart
selection: function(evt) { .... },
}
},
title: { text: null },
yAxis: {
title: { text: null },
gridLineWidth: 0,
labels: { enabled: false }
},
tooltip: { enabled: false },
xAxis: {
title: { text: null },
type: 'datetime'
},
series: [ ... ],
legend: { enabled: false },
credits: { enabled: false }
});
There is a lot going on in this configuration. The chart is defined with most of the features disabled, such as legend, title, tooltip, and y-axis label. More importantly, the chart is configured with a zoomType option, which enables the chart to be zoomable along the x-axis direction; hence, we can use the select event. The series array is composed of multiple series that also contain event configurations.
Constructing the series configuration for a top-level chart
In the series array, multiple series are defined with close and open price, bought and sold trade dates, and a hidden series for tracking mouse movement in the detail chart:
series: [{
// Past closed price series
type: 'areaspline',
marker: { enabled: false },
enableMouseTracking: false
}, {
// This is the open price series and never shown
// in the bottom chart. We use it to copy this
// to the detail chart
visible: false
}, {
// Series for date and price when shares
// are bought
type: 'scatter',
allowPointSelect: true,
color: $.myApp.boughtColor,
dataLabels: {
enabled: true,
formatter: function() { return 'B'; }
},
point: {
events: { .... }
}
}, {
// Series for date and price when shares are sold
type: 'scatter',
allowPointSelect: true,
color: $.myApp.soldColor,
dataLabels: {
enabled: true,
formatter: function() { return 'S'; }
},
point: {
events: { .... }
}
}, {
// This is the tracker series to show a single
// data point of where the mouse is hovered on
// the detail chart
type: 'scatter',
color: '#AA4643'
}]
The first series is the historic stock price series and is configured without data point markers. The second series is hidden and acts as a placeholder for historic open price data in the detail chart. The third (bought) and fourth (sold) series are the scatter series revealing the dates when shares have been traded. Both series are set with the allowPointSelect option, so that we can define the select and unselect events in the point.events option. The final series is also a scatter series to reflect the mouse movement in the detail chart using the mouseover and mouseout events; we will see how all these are implemented later on.
Launching an Ajax query with the chart load event
As mentioned earlier, once the top-level chart is created and loaded on to the browser, it is ready to fetch the data from the server. The following is the chart's load event handler definition:
chart: {
events: {
load: function() {
// Load the default stock symbol of
// the portfolio
var symbol = $('#symbol').val();
$('#symbol').attr('disabled', true);
loadPortfolio(symbol);
},
We first retrieve the value from the My Portfolio selection box and disable the selection box during the query time. Then, we call a predefined function, loadPortfolio. The method performs several tasks, as follows:
1. Launching an Ajax call, $.getJSON, to load the past stock price and portfolio data.
2. Setting up a handler for the returned Ajax result that further executes the following steps:
1. Hiding the chart loading mask.
2. Unpacking the returned data and populating series data with it using the Series.setData method.
3. Updating the data in the Portfolio Detail section to show how much the investment is worth as of the current date.
Activating the user interface with the chart redraw event
Once the top-level chart is populated with data, we can then enable the My Portfolio selection box on the page. To do that, we can rely on the redraw event, which is triggered by the Series.setData call in sub-step 2 inside step 2:
redraw: function() {
$('#symbol').attr('disabled', false);
},
Selecting and unselecting a data point with the point select and unselect events
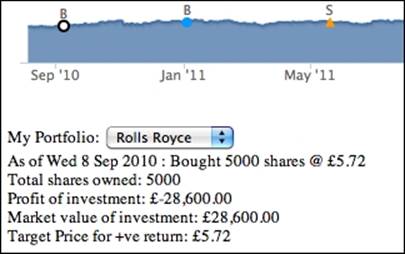
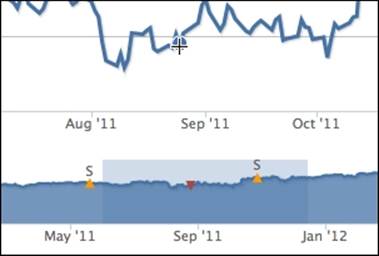
The bought and sold series share the same events handling; the only differences between them are the color and the point marker shape. The idea is that, when the user clicks on a data point in these series, the Portfolio Detail section is updated to show the investment detail for the stock as of the trade date. The following screenshot shows the effect after the first bought trade point is selected:
In order to keep the data point selected, we will use the allowPointSelect option, which allows us to define the select and unselect events. The following is the events configuration for the bought and sold series:
point: {
events: {
select: function() {
updatePortfolio(this.x);
},
unselect: function() {
// Only default back to current time
// portfolio detail when unselecting
// itself
var selectPt =
$.myApp.topChart.getSelectedPoints();
if (selectPt[0].x == this.x) {
updatePortfolio(new Date().getTime());
}
}
}
}
Basically, the select event handler calls a predefined function, updatePortfolio, that updates the Portfolio Detail section based on the selected data point time: this.x. The 'this' keyword in the handler refers to the selected point object, where x is the time value.
Unselecting the data point will call the unselect event handler. The preceding implementation means that, if the unselected data point (this.x) is the same as the previously selected point, then it indicates that the user has unselected the same point, so we want to show the portfolio detail as of the current date. Otherwise it will do nothing because it means the user has selected another trade data point; thus, another select event call is made with a different date.
Zooming the selected area with the chart selection event
The selection event forms the bridge between the top-level chart and the detail chart. When we select an area in the top-level chart, the selected area is highlighted and the data is zoomed in the detail chart. This action triggers the selection event and the following is the cut-down code of the event handler:
selection: function(evt) {
// Get the xAxis selection
var selectStart = Math.round(evt.xAxis[0].min);
var selectEnd = Math.round(evt.xAxis[0].max);
// We use plotBand to paint the selected area
// to simulate a selected area
this.xAxis[0].removePlotBand('selected');
this.xAxis[0].addPlotBand({
color: 'rgba(69, 114, 167, 0.25)',
id: 'selected',
from: selectStart,
to: selectEnd
});
for (var i = 0;
i < this.series[0].data.length; i++) {
var pt = this.series[0].data[i];
if (pt.x >= selectStart &&
pt.x <= selectEnd) {
selectedData.push([pt.x, pt.y]);
}
if (pt.x > selectEnd) {
break;
}
}
// Update the detail serie
var dSeries = $.myApp.detailChart.series[0];
dSeries.setData(selectedData, false);
....
// Update the detail chart title & subtitle
$.myApp.detailChart.setTitle({
text: $.myApp.stockName + " (" +
$.myApp.stockSymbol + ")",
style: { fontFamily: 'palatino, serif',
fontWeight: 'bold' }
}, {
text: Highcharts.dateFormat('%e %b %y',
selectStart) + ' -- ' +
Highcharts.dateFormat('%e %b %y',
selectEnd),
style: { fontFamily: 'palatino, serif' }
});
$.myApp.detailChart.redraw();
return false;
}
There are several steps taken in the handler code. First, we extract the selected range values from the handler parameters—evt.xAxis[0].min and evt.xAxis[0].max. The next step is to make the selected area stay highlighted in the top-level chart. To do that, we create a plot band using this.xAxis[0].addPlotBand over the same area to simulate the selection.
The 'this' keyword refers to the top-level chart object. The next task is to give a fixed id, so that we can remove the old selection and highlight a new selection. Additionally, the plot band should have the same color as the selection being dragged on the chart. All we need to do is to assign the plot band color to be the same as the default value of the chart.selectionMarkerFill option.
After that, we copy the data within the selected range into an array and pass it to the detail chart using Series.setData. Since we called the setData method a couple of times, it is worth setting the redraw option to false to save resources and then calling the redrawmethod.
Finally, the most important step is to return false at the end of the function. Returning the false Boolean value tells Highcharts not to take the default action after the selection has been made. Otherwise the whole top-level chart is redrawn and stretched (alternatively, we can call event.preventDefault()).
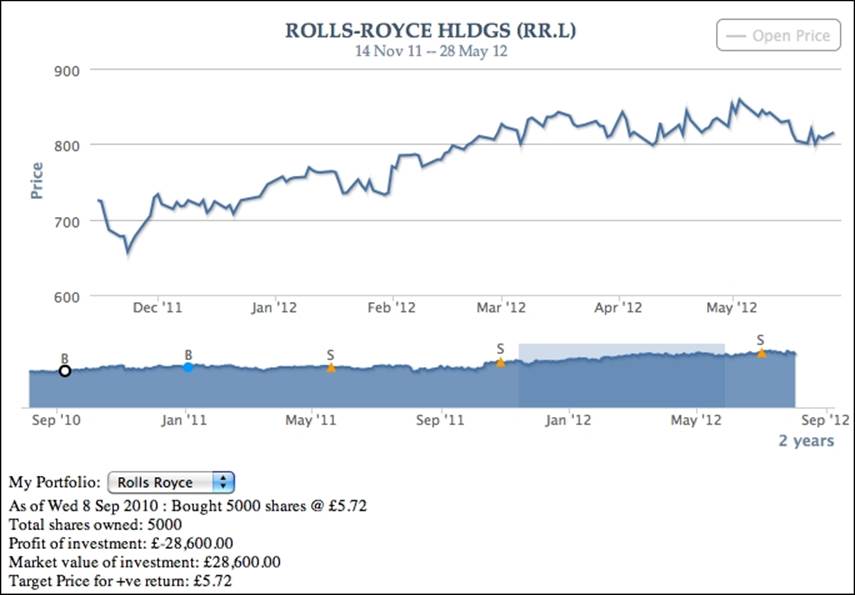
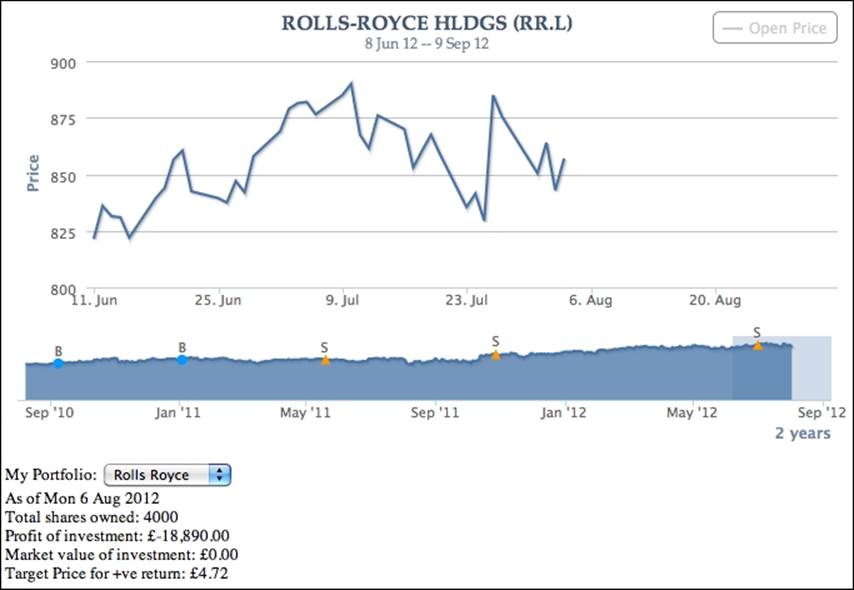
The following screenshot zooms and displays the detail in another chart:
The detail chart
The detail chart is simply a line chart showing the selected region from the top-level chart. The chart is configured with a tool tip fixed in the upper-left corner and a number of events that we will discuss later:
$.myApp.detailChart = new Highcharts.Chart({
chart: {
showAxes: true,
renderTo: 'detail-container',
events: {
click: function(evt) {
// Only allow to prompt stop order
// dialog if the chart contains future
// time
....
}
},
},
title: {
margin: 10,
text: null
},
credits: { enabled: false },
legend: {
enabled: true,
floating: true,
verticalAlign: 'top',
align: 'right'
},
series: [ ... ],
// Fixed location tooltip in the top left
tooltip: {
shared: true,
positioner: function() {
return { x: 10, y: 10 }
},
// Include 52 week high and low
formatter: function() { .... }
},
yAxis: {
title: { text: 'Price' }
},
xAxis: { type: 'datetime' }
});
The following is a screenshot showing a data point being hovered over and the tool tip shown in the upper-left corner:
Constructing the series configuration for the detail chart
There are two series configured in the detail chart. The main focus is the first series, which is the stock closed price. The series is defined without data point markers and has 'crosshair' as the cursor option, as we can see in the preceding screenshot. In addition, the mouseout and mouseover events are defined for the data points that create a marker to the tracker series in the top-level chart. We will go through these events in the next section. The series array is defined as follows:
series: [{
marker: {
enabled: false,
states: {
hover: { enabled: true }
}
},
cursor: 'crosshair',
point: {
events: {
mouseOver: function() { ... },
mouseOut: function() { ... }
}
},
stickyTracking: false,
showInLegend: false
}, {
name: 'Open Price',
marker: { enabled: false },
visible: false
}],
Hovering over a data point with the mouseover and mouseout point events
When we move the mouse pointer along the series in the detail chart, the movement is also reflected in the top-level chart within the selected area. The following screenshot shows the tracker point (the inverted triangle) displayed in the top-level chart:
The inverted triangle indicates where we are browsing in the top-level chart. To do that, we will set up the mouseOut and mouseOver point event options in the detail chart series, as follows:
point: {
events: {
mouseOver: function() {
var series = $.myApp.topChart.series[4];
series.setData([]);
series.addPoint([this.x, this.y]);
},
mouseOut: function() {
var series = $.myApp.topChart.series[4];
series.setData([]);
}
}
},
Inside the mouseOver handler, the 'this' keyword refers to the hovered data point object and the x and y properties refer to the time and price values. Since both the top-level and detail charts share the same data type along both x and y axes, we can simply add a data point into the tracker series in the top-level chart. As for the mouseOut event, we reset the series by emptying the data array.
Applying the chart click event
In this section, we will apply the chart click event to create a stop order for investment portfolios. Stop order is an investment term for selling or buying a stock when it reaches the price threshold within a specified date/time range in the future. It is generally used to limit a loss or protect a profit.
Notice that there is an empty space at the right-hand side of the top-level chart. In fact, this is deliberately created for the next 30-day range from the current date. Let's highlight that area, so that the future date appears in the detail chart:
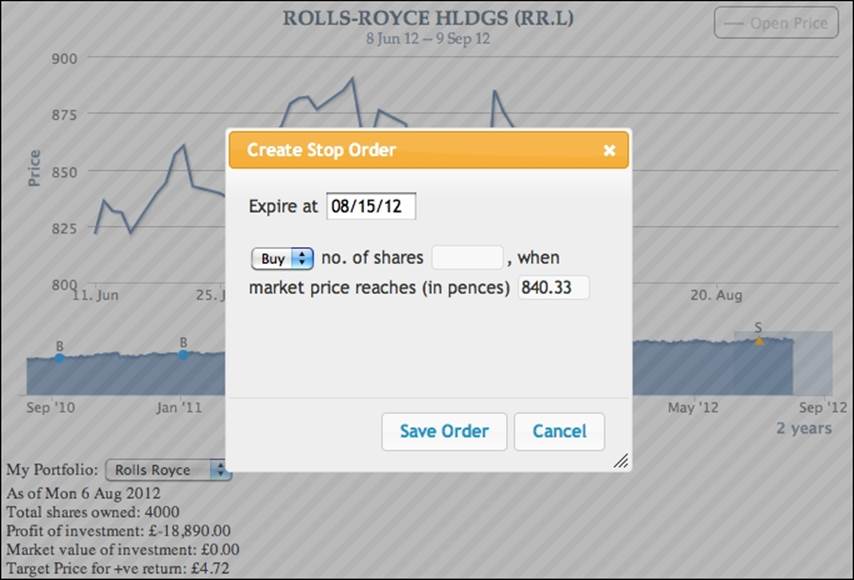
As we can see, the line series in the detail chart stops as soon as it hits the current date. If we click on the zone for future dates in the detail chart, a Create Stop Order dialog box appears. The x, y position of the click on the chart is then converted into date and price, which then populates the values into the dialog box. The following is the screenshot of the dialog box:
The expiry date and price fields can be further adjusted if necessary. Once the Save Order button is clicked, a stop order is created and a pair of x and y plot lines are generated to mark the chart. The following is a screenshot showing two stop orders on the chart:
Let's see how all these actions can be derived from the code. First, the jQuery UI dialog is created based on an HTML form declared on the page:
<div id='dialog'>
<form>
<fieldset>
<label for="expire">Expire at</label>
<input type=text name="expire" id="expire" size=9 ><br/><br/>
<select name='stopOrder' id='stopOrder'>
<option value='buy' selected>Buy</option>
<option value='sell'>Sell</option>
</select>
<label for="shares">no. of shares</label>
<input type="text" name="shares" id="shares" value="" size=7 class="text ui-widget-content ui-corner-all" />,
<label for="price">when market price reaches (in pences)</label>
<input type="text" name="price" id="price" value="" size=7 class="text ui-widget-content ui-corner-all" />
</fieldset>
</form>
</div>
The click event handler for the detail chart is then defined, as follows:
click: function(evt) {
// Only allow to prompt stop order dialog
// if the chart contains future time
if (!$.myApp.detailChart.futureDate) {
return;
}
// Based on what we click on the time, set
// input field inside the dialog
$('#expire').val(
Highcharts.dateFormat("%m/%d/%y",
evt.xAxis[0].value));
$('#price').val(
Highcharts.numberFormat(
evt.yAxis[0].value, 2));
// Display the form to setup stop order
$('#dialog').dialog("open");
}
The first guard condition is to see whether the detail chart contains any future dates. If a future date exists, then it extracts the x and y values from the click event and assigns them into the form input fields. After that, it calls the jQuery UI dialog method to lay out the HTML form in a dialog box and displays it.
The following code snippet shows how we define the jQuery UI dialog box and its action buttons. The code is edited for readability:
// Initiate stop order dialog
$( "#dialog" ).dialog({
// Dialog startup configuration –
// dimension, modal, title, etc
.... ,
buttons: [{
text: "Save Order",
click: function() {
// Check whether this dialog is called
// with a stop order id. If not, then
// assign a new stop order id
// Assign the dialog fields into an
// object - 'order'
....
// Store the stop order
$.myApp.stopOrders[id] = order;
// Remove plotlines if already exist.
// This can happen if we modify a stop
// order point
var xAxis = $.myApp.detailChart.xAxis[0];
xAxis.removePlotLine(id);
var yAxis = $.myApp.detailChart.yAxis[0];
yAxis.removePlotLine(id);
// Setup events handling for both
// x & y axis plotlines
var events = {
// Change the mouse cursor to pointer
// when the mouse is hovered above
// the plotlines
mouseover: function() { ... },
// Launch modify dialog when
// click on a plotline
click: function(evt) { ... }
};
// Create the plot lines for the stop
// order
xAxis.addPlotLine({
value: order.expire,
width: 2,
events: events,
color: (order.stopOrder == 'buy') ? $.myApp.boughtColor : $.myApp.soldColor,
id: id,
// Over both line series and
// plot line
zIndex: 3
});
yAxis.addPlotLine({
value: order.price,
width: 2,
color: (order.stopOrder == 'buy') ? $.myApp.boughtColor : $.myApp.soldColor,
id: id,
zIndex: 3,
events: events,
label: {
text: ((order.stopOrder == 'buy') ? 'SO-B by (' : 'SO-S by (') + Highcharts.dateFormat("%e %b %Y", parseInt(order.expire)) + ') @ ' + order.price,
align: 'right'
}
});
$('#dialog').dialog("close");
}
}, {
text: "Cancel",
click: function() {
$('#dialog').dialog("close");
}
}]
});
The dialog box setup code is slightly more complicated. In the Save Order button's handler, it performs several tasks, as follows:
1. It extracts the input values from the dialog box.
2. It checks whether the dialog box is opened with a specific stop order id. If not, then it assigns a new stop order id and stores the values with id into $.myApp.stopOrders.
3. It removes any existing plot lines that match with id, in case we modify an existing stop order.
4. It sets up the click and mouseover events handling for both x- and y-axis plot lines.
5. It creates x and y plot lines in the detail chart with the events definitions constructed in step 4.
One scenario with stop orders is that users may want to change or delete a stop order before the condition is fulfilled. Therefore, in step 4 the purpose of the click event on plot lines is to bring up a modify dialog box. Additionally, we want to change the mouse cursor to a pointer when hovering over the plot lines to show that it is clickable.
Changing the mouse cursor over plot lines with the mouseover event
To change the mouse cursor over the plot lines, we define the mouseover event handler, as follows:
mouseover: function() {
$.each(this.axis.plotLinesAndBands,
function(idx, plot) {
if (plot.id == id) {
plot.svgElem.element.style.cursor =
'pointer';
return false;
}
}
);
},
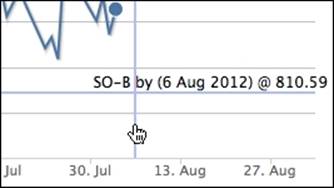
The 'this' keyword contains an axis object that the hovered plot line belongs to. Since there can be multiple plot lines in each axis, we need to loop through the array of plot lines and plot bands that can be found in the plotLinesAndBands property inside the axis object. Once we have found the target plot line by matching id, we will dig into the internal element and set the cursor style to 'pointer'. The following screenshot shows a mouse cursor hovered over the plot line:
Setting up a plot line action with the click event
The click event for plot lines launches the Modify Stop Order dialog box for a stop order:
// Click on the prompt line
click: function(evt) {
// Retrieves the stop order object stored in
// $.myApp.stopOrders
$('#dialog').dialog("option",
"stopOrderId", id);
var stopOrder = $.myApp.stopOrders[id];
// Put the settings into the stop order form
$('#dialog').dialog("option", "title",
"Modify Stop Order");
$('#price').val(
Highcharts.numberFormat(
stopOrder.price, 2));
$('#stopOrder').val(stopOrder.stopOrder);
$('#shares').val(stopOrder.shares);
$('#expire').val(
Highcharts.dateFormat("%m/%d/%y",
stopOrder.expire));
// Add a remove button inside the dialog
var buttons =
$('#dialog').dialog("option", "buttons");
buttons.push({
text: 'Remove Order',
click: function() {
// Remove plot line and stop order
// settings
delete $.myApp.stopOrders[id];
var xAxis =
$.myApp.detailChart.xAxis[0];
xAxis.removePlotLine(id);
var yAxis =
$.myApp.detailChart.yAxis[0];
yAxis.removePlotLine(id);
// Set the dialog to original state
resetDialog();
$('#dialog').dialog("close");
}
});
$('#dialog').dialog("option",
"buttons", buttons);
$('#dialog').dialog("open");
}
The click event handler simply retrieves the stop order settings and puts the values inside the Modify Stop Order dialog box. Before launching the dialog box, add a Remove Order button into the dialog box that the button handler calls removePlotLine, with the plot line id. The following is a screenshot of the Create Stop Order dialog box:
Stock growth chart example
Our next example (for the online demo, see http://joekuan.org/Learning_Highcharts/Chapter_11/chart2.html) is to demonstrate the following events:
· chart.events: addSeries
· plotOptions.series.events: click, checkboxClick, and legendItemClick
· plotOptions.series.point.events: update and remove
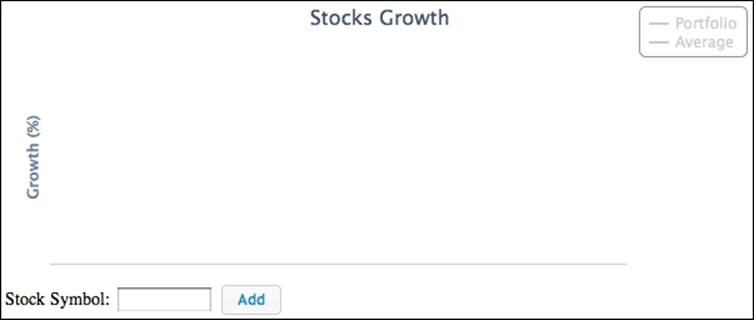
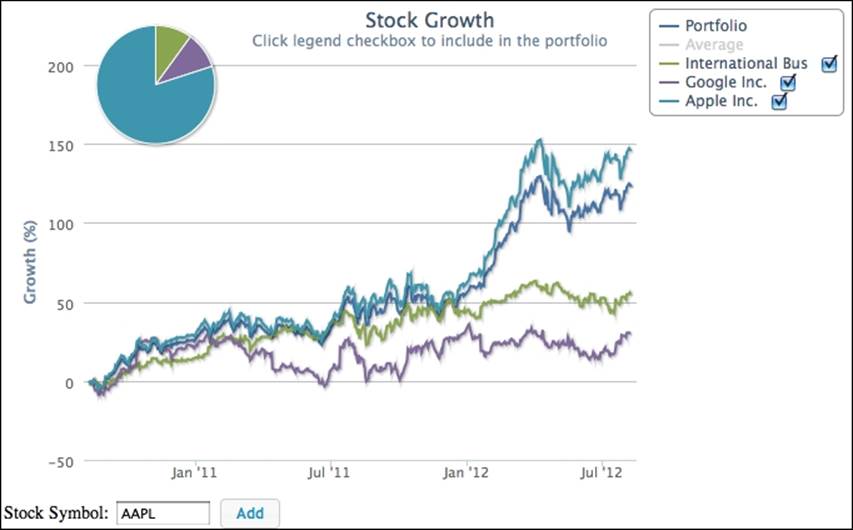
Suppose that we want to draft a long-term investment portfolio based on past stock growth performance as a reference. The demo contains a chart started with two series, Portfolio and Average growth, and a form to input stock symbols. Basically, we enter a stock symbol in this demo, and then a line series of stock growth is inserted into the chart.
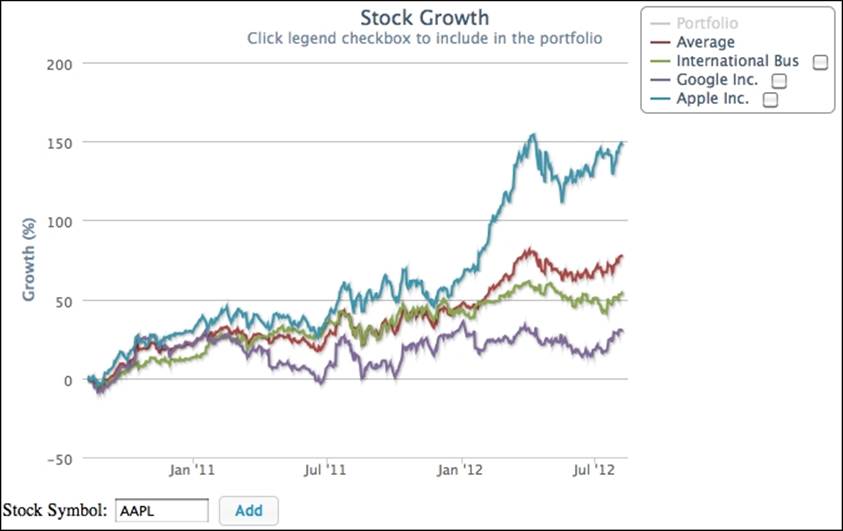
So we can plot multiple stock yield trends and tweak their proportion in our portfolio to observe how the Average and Portfolio lines perform. The following screenshot shows the initial screen:
Plotting averaging series from displayed stock series
Let's query for two stocks and click on the Average legend to enable the series:
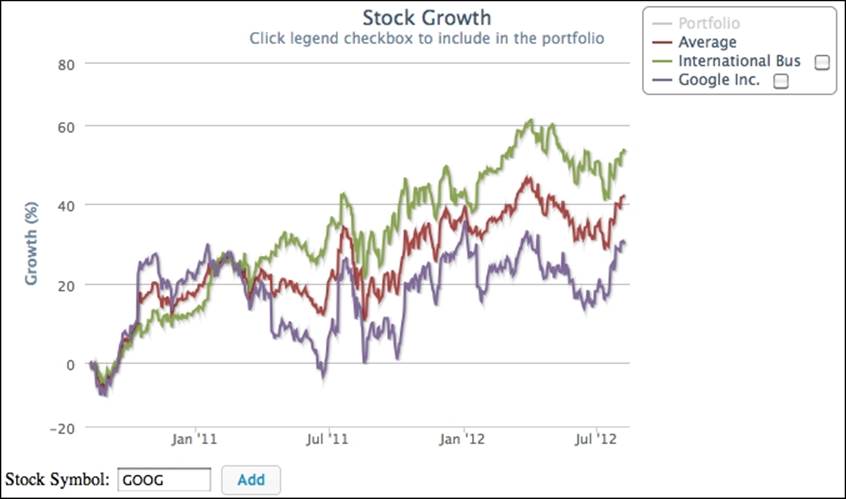
As expected, the Average line is plotted between the two stock lines. Assuming that future growth is similar to the past, this Average line projects future growth if we invest in both stocks equally for our portfolio. Let's add another stock symbol onto the chart:
The new growth line generates a higher yield so that the Average line automatically re-adjusts itself and shifts to become the second line from the top. Let's see how it is implemented. The following is the chart configuration code:
$.myChart = new Highcharts.Chart({
chart: {
renderTo: 'container',
showAxes: true,
events: {
addSeries: function() { ... }
}
},
series: [{
visible: false,
name: 'Portfolio',
color: $.colorRange.shift(),
marker: { enabled: false },
events: {
legendItemClick: function(evt) { ... }
}
}, {
name: 'Average',
events: {
legendItemClick: function(evt) { ... }
},
color: $.colorRange.shift(),
visible: false,
marker: { enabled: false }
}, {
visible: false,
type: 'pie',
point: {
events: {
click: function(evt) { ... },
update: function(evt) { ... },
remove: function(evt) { ... }
}
},
center: [ '13%', '5%' ],
size: '30%',
dataLabels: { enabled: false }
}],
title: { text: 'Stocks Growth' },
credits: { enabled: false },
legend: {
enabled: true,
align: 'right',
layout: 'vertical',
verticalAlign: 'top'
},
yAxis: {
title: { text: 'Growth (%)' }
},
xAxis: { type: 'datetime' }
});
The chart contains three series: Portfolio, Average, and a pie chart series to edit the portfolio distribution.
When we hit the Add button with a stock symbol, the showLoading method is called to put a loading mask in front of the chart, and then an Ajax connection is established with the server to query the stock yield data. We implement the Ajax handler by calling theaddSeries function to insert a new series into the chart.
Once the addSeries event is triggered, it means that the data has been returned and is ready to plot. In this case, we can disable the chart loading mask, as follows:
chart: {
.... ,
events: {
addSeries: function() {
this.hideLoading();
}
},
.... ,
The following is the implementation of the Add button action:
$('#add').button().on('click',
function() {
var symbol = $('#symbol').val().toLowerCase();
$.myChart.showLoading();
$.getJSON('./stockGrowth.php?symbol=' + symbol +
'&years=' + $.numOfYears,
function(stockData) {
// Build up the series data array
var seriesData = [];
if (!stockData.rows.length) {
return;
}
$.symbols.push({
symbol: symbol,
name: stockData.name
});
$.each(stockData.rows,
function(idx, data) {
seriesData.push([
data.date * 1000,
data.growth ]);
});
$.myChart.addSeries({
events: {
// Remove the stock series
click: { ... },
// Include the stock into portfolio
checkboxClick: { ... }
},
data: seriesData,
name: stockData.name,
marker: { enabled: false },
stickyTracking: false,
showCheckbox: true,
// Because we can add/remove series,
// we need to make sure the chosen
// color used in the visible series
color: $.colorRange.shift()
}, false);
updateAvg(false);
$.myChart.redraw();
} // function (stockData)
); //getJSON
});
We build a series configuration object from the Ajax returned data. Within this new series configuration, we set the showCheckbox option to true for a checkbox next to the legend item. A couple of events are also added into the configuration, click and checkboxClick, and are discussed later.
After the addSeries method call, we then call a predefined routine, updateAvg, that only recomputes and redraws the Average line if it is on display.
Recalling from the preceding Average series events definition, we use the legendItemClick event to capture when the Average series is clicked in the legend box:
series: [{
...
}, {
name: 'Average',
events: {
legendItemClick: function(evt) {
if (!this.visible) {
updateAvg();
}
}
},
.....
The preceding code means that, if the Average series is not currently in a visible state, then the series will be visible after this handler returns. Hence, it calculates the average values and shows the series.
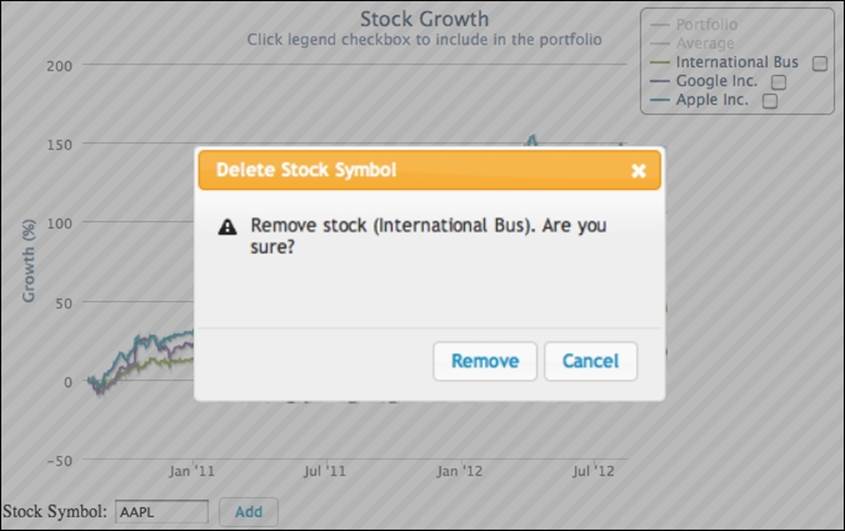
Launching a dialog with the series click event
Instead of enabling or disabling a stock yield line by clicking on the legend item, we may want to completely remove the series line. In this scenario, we use the click event to do that, as follows:
$.myChart.addSeries({
events: {
// Launch a confirm dialog box to delete
// the series
click: function() {
// Save the clicked series into the dialog
$("#dialog-confirm").dialog("option",
"seriesIdx", this.index);
$("#dialog-confirm").dialog("option",
"seriesName", this.name);
$("#removeName").text(this.name);
$("#dialog-confirm").dialog("open");
},
// Include the stock into portfolio
checkboxClick: function(evt) { ... }
},
....
});
The click action launches a confirmation dialog box for removing the series from the chart. We store the clicked series (the 'this' keyword) information inside the dialog box. The Remove button's button handler uses that data to remove the series and recalculate the average series if it is shown. The following is the screenshot:
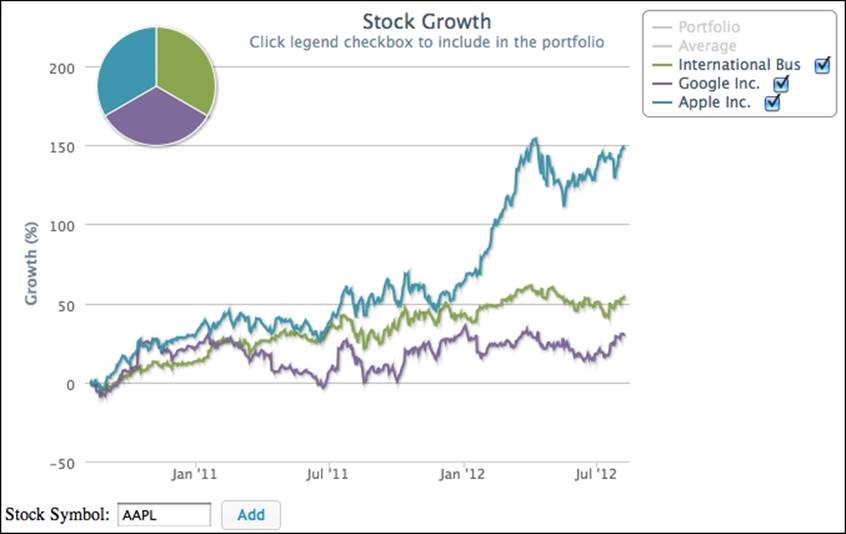
Launching a pie chart with the series checkboxClick event
Inside the legend box, each checkbox is used to include the stock in the portfolio. As soon as the checkbox is checked, a pie chart appears in the upper-left corner showing the distribution of the stock within the portfolio. Each slice in the pie chart shares the same color with the corresponding stock line. The following screenshot shows three growth lines and a portfolio pie chart equally distributed for each stock:
Since the growth line series is configured with the showCheckbox option, we can define the checkboxClick event to launch a pie chart when the checkbox is checked:
checkboxClick: function(evt) {
updatePie(this, evt.checked);
}
The updatePie function is called in several places in this demo, for example, to remove a series, when the legend checkbox is checked, and so on. The following is the shortened version of the code:
var updatePie = function(seriesObj, checked) {
var index = seriesObj.index;
// Loop through the stock series. If checkbox
// checked, then compute the equal distribution
// percentage for the pie series data
for (i = $.pfloIdx + 1;
i < $.myChart.series.length; i++) {
var insert = (i == index) ? checked : $.myChart.series[i].selected;
if (insert) {
data.push({
name: $.myChart.series[i].name,
y: parseFloat((100 / count).toFixed(2)),
color: $.myChart.series[i].color
});
}
}
// Update the pie chart series
$.myChart.series[$.pfloIdx].setData(data, false);
$.myChart.series[$.pfloIdx].show();
};
The preceding code snippet basically loops through the stock series array and checks whether it is selected. If so, then it includes stock in the pie series in an equally distributed manner. Then the pie chart is displayed if there are one or more entries.
Editing the pie chart's slice with the data point's click, update, and remove events
It is unlikely that an investment portfolio will have an equal distribution of all stocks. Therefore, we can enhance the example by modifying portions within the pie chart. When a slice of the pie chart is clicked, a dialog box pops up. This allows us to adjust or remove the portion within the portfolio. The following screenshot shows this:
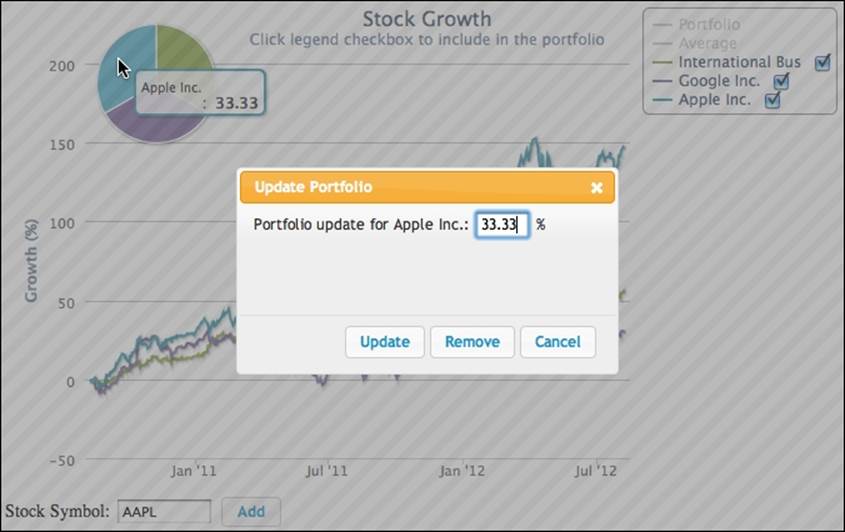
The Update button in the Update Portfolio dialog box updates the pie chart slice with the Point.update method, whereas the Remove button calls the Point.remove method. Both calls trigger the update and remove events respectively. Here, we define the data point'sclick, update, and remove events inside the pie chart:
series: [ {
....
},
visible: false,
type: 'pie',
point: {
events: {
// Bring up the modify dialog box
click: function(evt) {
// Store the clicked pie slice
// detail into the dialog box
$('#updateName').text(evt.point.name);
$('#percentage').val(evt.point.y);
$('#dialog-form').dialog("option",
"pieSlice", evt.point);
$('#dialog-form').dialog("open");
},
// Once the Update button is clicked,
// the pie slice portion is updated
// Hence, this event is triggered and the
// portfolio series is updated
update: function(evt) {
updatePortfolio();
},
// Pie slice is removed, unselect the series
// in the legend checkbox and update the
// portfolio series
remove: function(evt) {
var series = nameToSeries(this.name);
series && series.select(false);
updatePortfolio();
}
}
}
The click event function stores the clicked slice (the point object) inside the Modify dialog box and launches it. Inside the dialog box, the Update and Remove buttons' button handlers then extract these stored point object, call the pie chart, and use the objects' update or remove method to reflect the change in the displayed pie chart. This subsequently triggers point update or remove event handlers and calls the predefined function, updatePortfolio, that recalculates the Portfolio series, with the new distribution among the included stocks. So let's update the distribution for the best past performance stock to an 80 percent ratio and the other two stocks to 10 percent each. The Portfolio series automatically readjusts itself from the update event, as shown in the following screenshot:
As we can see, the Portfolio series (the second line from the top) has been weighted towards the higher growth trend rather than being in the middle of all the stocks, like the Average series.
Summary
In this chapter, we covered the last part of Highcharts configuration: events handling. We built two share portfolio applications using jQuery and jQuery UI to demonstrate most of the Highcharts events.
In the next chapter, we will bring Highcharts to mobile devices with jQuery Mobile.
All materials on the site are licensed Creative Commons Attribution-Sharealike 3.0 Unported CC BY-SA 3.0 & GNU Free Documentation License (GFDL)
If you are the copyright holder of any material contained on our site and intend to remove it, please contact our site administrator for approval.
© 2016-2026 All site design rights belong to S.Y.A.