Learning Highcharts 4 (2015)
Chapter 12. Highcharts and jQuery Mobile
Highcharts does not only work in desktop browsers; it also supports mobile platforms. In this chapter, we will explore how to deploy Highcharts to mobile platforms with a web mobile framework, jQuery Mobile, that is built on top of jQuery. A very brief introduction to jQuery Mobile is given. We will look into a couple of areas that are crucial to understanding the basics of the mobile framework. Then, we will integrate Highcharts and jQuery Mobile by building a mobile application using an Olympic 2012 medals table. We will demonstrate how to apply mobile events such as swipe, rotation, and pinch to navigate through the charts. In this chapter, we will cover the following topics:
· Introducing jQuery Mobile
· Understanding mobile page structure
· Understanding page initialization
· Linking between mobile pages
· Integrating Highcharts and jQuery Mobile
· Drilling down for data from one chart to another
· Changing chart displays with touch actions: swipe, rotate, and pinch
A short introduction to jQuery Mobile
This chapter is not a full tutorial for jQuery Mobile (jQM) by any means, but it is a quick-start guide for using it with Highcharts. JQuery Mobile is a web development framework for mobile devices built on top of jQuery. It is designed to be compatible across all mobile platforms, and the UI look and feel emulate native mobile applications. The benefit of this is low cost development in a single-source code, without the need for testing across all mobile platforms and browsers.
Before we drill down into how Highcharts can be integrated with jQM, a few important concepts need to be understood.
Understanding mobile page structure
The most important concept in jQM is to understand the structure of a mobile page, which is not the same as a normal HTML page. A mobile page is constructed inside an HTML <div> box with a jQM-specific attribute, data-role='page', marked as a boundary. In fact, the data-* syntax is Customer Data Attributes defined in HTML5 standard. This allows web developers to store custom data specific to the page or application, which can easily access the data attribute values. For more information on APIs for HTML visithttp://dev.w3.org/html5/spec/single-page.html#custom-data-attribute. Within a mobile page, normal HTML tags, such as input, hyperlinks, select, and so on, are used.
An HTML document can contain multiple mobile pages and links through an anchor and the id attribute. An anchor is the same as a normal HTML anchor (for example, #chart). The framework resolves the anchor reference and retrieves a mobile page with the matching id attribute, which has the following syntax:
<div data-role="page" id="chart">
The following is an example of a single mobile page in an HTML document:
<!DOCTYPE html>
<html>
<head>
<title>My Page</title>
<meta name="viewport"
content="width=device-width, initial-scale=1,
maximum-scale=1, user-scalable=0">
<!-- CDN loading of jQuery and jQM -->
<link rel="stylesheet"
href="https://code.jquery.com/mobile/1.4.3/jquery.mobile-1.4.3.min.css" />
<script
src="http://code.jquery.com/jquery-2.1.1.min.js"></script>
<script
src="http://code.jquery.com/mobile/1.4.3/jquery.mobile-1.4.3.min.js"></script>
</head>
<body>
<div data-role="page">
<div data-role="header">
<h1>jQuery Mobile</h1>
</div><!-- /header -->
<div data-role="content">
....
</div>
</div><!-- /page -->
</body>
</html>
Depending on the purpose of the mobile application, all the pages can be built into a single HTML document or they can exist in separate documents. One important aspect is that, if multiple mobile pages are defined within a document, the first page in the <body>tag is always loaded on the screen. In jQM, a page is generally composed of the head and content, optionally a footer and navigation bar. Each component also has a <div> box with data-role to indicate the type of component within a mobile page. The following code shows how multiple mobile pages in a document are loaded:
<div data-role="page" >
<div data-role="header">
<h1>jQuery Mobile</h1>
<a href="#config" data-rel='dialog'
data-icon="gear">Options</a>
</div><!-- /header -->
<div data-role="content">
....
</div>
</div><!-- /page -->
<!-- Page for the option dialog -->
<div data-role="page" id='config'>
<div data-role="header">
<h1>Config</h1>
</div><!-- /header -->
<div data-role="content">
<a href="#" data-role="button"
data-rel="back" >Cancel</a>
</div>
</div><!-- /page -->
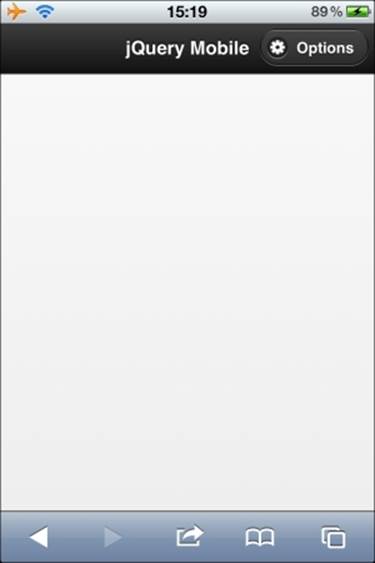
As we can see, there are two <div> boxes with the data-role='page' attribute. The first <div> box is the same as the previous example with an additional Options link button that redirects to the second mobile page, id='config'. The data-icon="gear" attribute decorates the button with a gear icon provided by the framework.
For the full list of icons visit http://demos.jquerymobile.com/1.4.3/icons. When the button is pressed, it will open the second page as a modal dialog box due to the data-rel='dialog' attribute. The following screenshot shows the view of the first mobile page as it appears on an iPhone:
Understanding page initialization
In this section, we will look at why we don't use the traditional DOM-ready method to run initialization code for mobile pages. Suppose a page's content requires some sort of initialization, then using the traditional DOM-ready method $.ready can have a negative effect. This is because the $.ready method runs as soon as all the DOMs inside the document are loaded. In other words, we have no control over when to run the jQM page initialization code if it is inside the DOM ready handler.
However, jQM provides a specific event, pageinit, that caters for this scenario. All we need to do is to assign an id value inside the <div data-role='page'> markup, then define the pageinit event handler for that id value. Whenever a page is going to be initialized for display, this event is triggered. Note that the $.ready method is still going to be called, but we just don't use it in jQM. To demonstrate this concept, let us use the previous multipage example with an additional $.ready call:
<script type="text/javascript">
$(document).on('pageinit', '#main_page', function() {
alert('jQuery Mobile: pageinit for Main page');
});
$(document).on('pageinit', '#config', function() {
alert('jQuery Mobile: pageinit for Config page');
});
$(document).ready(function() {
alert('jQuery ready');
});
</script>
</head>
<body>
<!-- MAIN PAGE -->
<div data-role="page" id='main_page'>
<div data-role="header">
<h1>jQuery Mobile</h1>
<a href="#config" data-rel='dialog'
data-icon="gear"
class='ui-btn-right'>Options</a>
</div><!-- /header -->
<div data-role="content" id=''>
</div>
</div><!-- /page -->
<!-- CONFIG PAGE -->
<div data-role="page" id='config' >
<div data-role="header">
<h1>Config</h1>
</div><!-- /header -->
<div data-role="content">
<a href="" data-role="button"
data-rel="back" >Cancel</a>
</div>
</div><!-- /page -->
There are two mobile pages defined in this example: main_page and config. Each mobile page is tied to its pageinit event handler. With the $.ready method, we can observe the call sequence with other pageinit events. When we first load the document to the browser, we see the following screenshot:
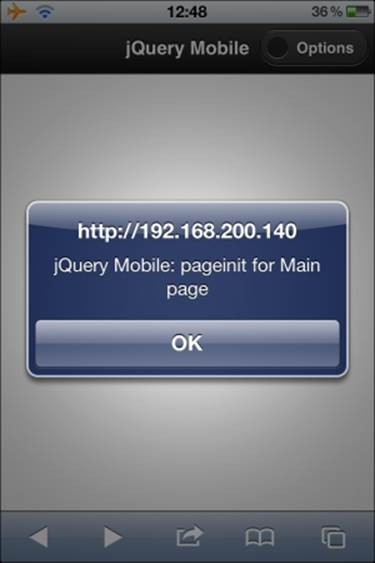
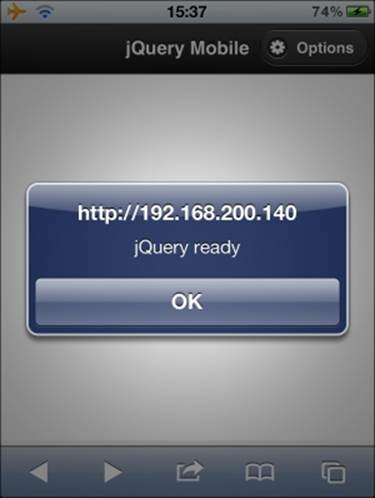
Remember that jQM always displays the first page in the HTML body. That means the pageinit event for main_page is fired as soon as the DOM for main_page is fully loaded and initialized for the display. It is also important to understand that, at the point of execution, the DOM for the subsequent config page is not loaded yet. When we touch the OK button, the execution resumes and the DOM for the config page is then loaded. Hence all the DOMs in the document are loaded and the $.ready method is then called; it shows the second alert message as shown in the following screenshot:
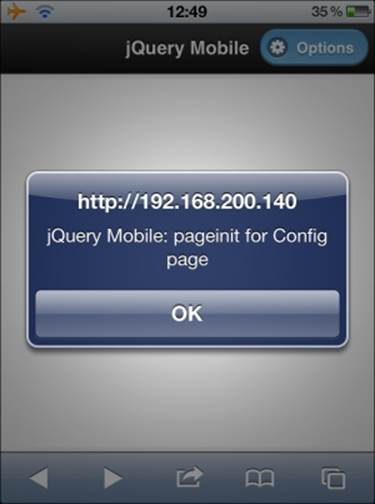
When we touch the OK button, the alert box disappears and the control returns back to the browser. Now, if we touch the Options button in the top right-hand corner, the config dialog page is initialized and displayed on the screen. Hence the pageinit handler for the config page is called:
Linking between mobile pages
The second important concept in jQM is how the mobile pages are linked together. Understanding this concept can help us to design a web mobile application with a fluid user experience. In jQM, there are two ways to load an external mobile page: HTTP and Ajax. Depending on how we set the data- attribute, it interprets the href value and decides which way to load a mobile page. By default, apart from the first document load that is a normal HTTP transfer, the mobile page is loaded through Ajax.
The following block diagram explains how multiple mobile page blocks are managed within a document:
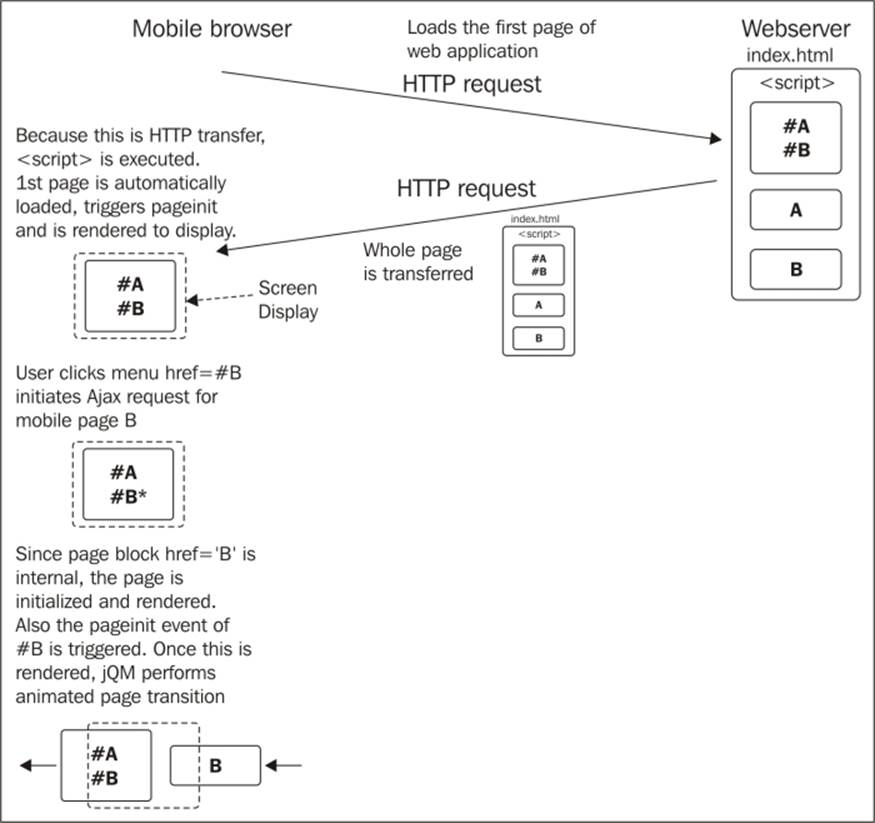
When a mobile page invokes another mobile page, the jQM framework basically parses the href value. Since this is an anchor reference, it indicates that this is an internal mobile page block. The framework locates the page block from the current DOM by matching the id value. It then initializes and renders the page, which also triggers the pageinit event for page B as shown in the previous block diagram.
Suppose we have two separate HTML documents in which a button on one page is referring to the other document. The following block diagram describes the scenario:
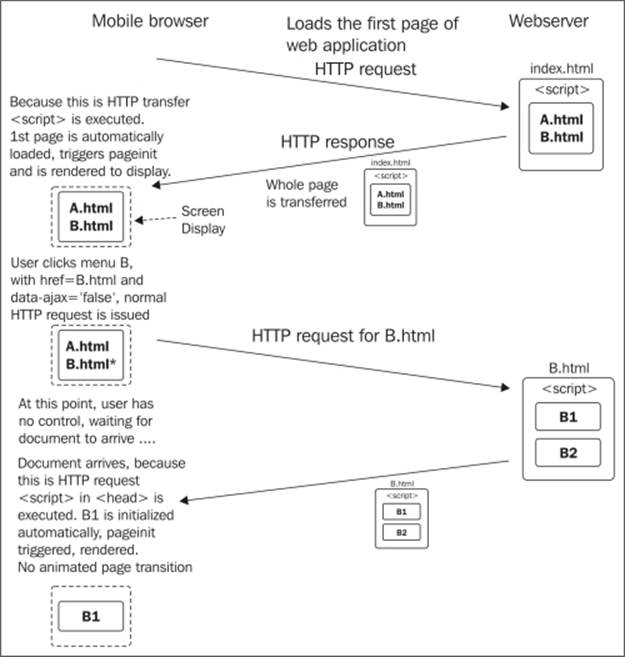
In this case, we add an attribute, data-ajax="false" (for the sake of a simpler approach to managing the JavaScript code), to tell jQM that this button requires a document load instead of a background Ajax load. This is important because otherwise the pageinithandler code (or any JavaScript file) inside the <script> tag will not be loaded for the new mobile page, B.html.
Note
JavaScript code can be embedded inside a <script> tag within a mobile page block and executed. The downside of this approach is that it requires more code management, as each page block has its own pageinit handler code.
There is an alternative way to load Ajax in multiple documents, but we will leave it here. This is more than sufficient to implement a simple mobile web application. Readers can learn more from the jQuery Mobile documentation.
Highcharts in touch-screen environments
The good thing about Highcharts is that it works perfectly well on both desktop browsers and web mobile environments without requiring any change of code. The only part that needs some consideration is events handling, because mobile devices are all touch-screen based and that means the mouse cursor is invisible.
In Highcharts, all the mouse hover events can still be triggered in touch devices, even though the mouse cursor is not shown. For instance, suppose we define a series with the mouseOut, mouseOver, and click events handling. If we touch the series, both the mouseOverand click events are triggered. However, if we touch another series causing the previous selected series to be unselected, a mouseOut event for the first series is fired. Needless to say, the sequence of events would be different with a real pointing device. In general, we should refrain from using any mouse hover events in touch-screen based devices.
In the next section, we will learn how to integrate jQM with Highcharts, including how to apply touch events to charts, how to use the chart click events to launch another chart and mobile page, and so on.
Integrating Highcharts and jQuery Mobile using an Olympic medals table application
In this section, we will build a mobile application for browsing the results of the Olympic 2012 medals table. This application is only tested on iPhone and iPad. The startup screen provides four menus for looking up the results, as shown in the following screenshot:
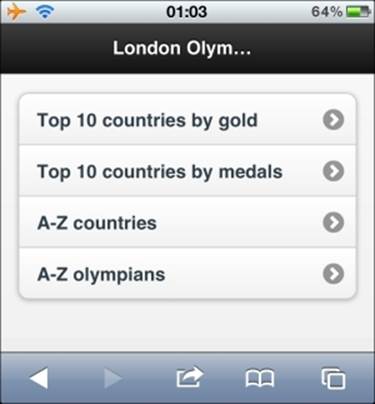
The initial page is made up of a list of four hyperlinks referring to other pages, as shown in the following code:
<head>
<!-- CDN load of Highcharts, jQuery and jQM -->
....
</head>
<body>
<div data-role="page">
<div data-role="header">
<h1>London Olympic 2012 </h1>
</div><!-- /header -->
<div data-role="content">
<ul data-role="listview" data-inset="true">
<li><a href="./gold.html"
data-ajax="false" >Top 10 countries by gold</a></li>
<li><a href="./medals.html"
data-ajax="false" >Top 10 countries by medals</a></li>
<li><a href="#">A-Z countries</a></li>
<li><a href="#">A-Z olympians</a></li>
</ul>
</div>
</div><!-- /page -->
</body>
So, when the Top 10 countries by gold button is clicked, the gold.html file is HTTP-loaded (not Ajax) because we define data-ajax="false". Since it is an HTTP load, the whole page, gold.html, is loaded onto the browser as well as everything within the <script>tags that are being executed.
Loading up the gold medals page
The following is the content of the gold.html file:
<head>
<!-- CDN load of Highcharts, jQuery and jQM -->
....
<script type="text/javascript" src="common.js"></script>
<script type="text/javascript" src="gold.js"></script>
</head>
<body>
<div data-role="page" id='gold_chart'>
<div data-role="header">
<a href="olympic.html" data-icon="home"
data-iconpos="notext">Home</a>
<h1>London Olympic 2012 - Top 10 countries by gold</h1>
<a href="#options" data-rel='dialog'
data-icon="gear" id='options'>Options</a>
</div><!-- /header -->
<div data-role="content">
<div id='chart_container'></div>
</div>
</div><!-- /page -->
<!-- options dialog -->
<div data-role="page" id='options' >
....
</div>
</body>
Since this whole HTML document is HTTP-loaded onto the browser, the common.js and gold.js files are also loaded (See http://joekuan.org/Learning_Highcharts/Chapter_12/). The file common.js contains common routine code shared in the demo, such as device detection, orientation detection, chart creation, and so on. The gold.js file contains the pageinit handler code for all the mobile pages in the gold.html file. As the mobile page block, gold_chart, is the first defined block in the document, it is automatically loaded and rendered to the display; thus, the pageinit event for the gold_chart page block is triggered.
Detecting device properties
For detecting mobile devices, the techniques range from string matching of the navigator.userAgent option, jQuery.support, jQuery.browser (deprecated), CSS media queries, to a third-party plugin such as Modernizer (see http://modernizr.com/ for details). However, there is no standard way of doing this. Perhaps it is due to the diverse requirements for compatibility checks. It is beyond the scope of this book to debate the merits of each technique. For this demo, all we are interested in is the difference in screen size; that is, if there is more space in the display (such as with tablet devices), then we display the full country name in the charts instead of the country code, which is used for smaller devices (touch phones). We assume the following technique is sufficient to differentiate between phone and tablet devices:
function getDevice() {
return ($(window).width() > 320) ? "tablet" : "phone";
}
The $(window).width property returns the width of the device in pixels, regardless of the device orientation. As for getting the current device orientation, we have the following method:
function getOrientation() {
return (window.innerHeight/window.innerWidth) > 1 ?
'portrait' : 'landscape';
}
Plotting a Highcharts chart on a mobile device
The following is the pageinit handler code for the gold_chart mobile page:
$(document).on('pageinit', '#gold_chart',
function() {
var device = getDevice();
// current orientation
var orientation = getOrientation();
$.olympicApp = $.olympicApp || {};
// Setup the point click events for all the
// country medal charts – used by plotGoldChart method
var pointEvt = {
events: {
click: function(evt) { ... }
}
};
// Switch between column and pie chart
$('#chart_container').on('swipeleft',
function(evt) { ... } );
$('#chart_container').on('swiperight',
function(evt) { ... } );
// Switch between column and bar chart on
// smaller display
$(document).on('orientationchange',
function(evt) { ... } );
// General method for plotting gold medal chart
// Used by dialog box also to toggle chart options
// such as column stacking, labels etc
$.olympicApp.plotGoldChart = function(chart, options) {
.....
};
// Create and display Highcharts for gold medal chart
$.olympicApp.goldChart = createChart({
device: device,
orientation: orientation,
load: $.olympicApp.plotGoldChart,
type: (orientation == 'landscape') ?
'bar' : 'column',
// legend and title settings specific
....
});
}
);
The touch events such as swipeleft, swiperight, and orientationchange will be discussed later on. The event handler, pointEvt, drills down further to another chart when the user taps on a country bar in the gold medal chart. We will also explore this interaction later on. Let's first focus on the last part of the code, which creates the chart. The createChart method is a general routine to create a Highcharts graph that has the common options shared by all the chart mobile pages. For example, the renderTo option is always set tochart_container, which is inside the data-role='content' attribute. The following code shows the createChart implementation:
// Main routine for creating chart
function createChart(options) {
// Based on the device display and current orientation
// Work out the spacing options, labels orientation
return new Highcharts.Chart({
chart: {
renderTo: 'chart_container',
type: options.type,
events: {
load: function(chart) {
// Execute the page general plot routine
options.load &&
options.load(chart, options);
}
},
spacingLeft: ....,
....
},
title: { text: options.title },
xAxis: {
labels: ....
},
....
});
}
Note that there is no series defined in the options parameter and the options.load property is set up to call the plotGoldChart function once the chart is created and loaded into the browser. The following code snippet is part of the plotGoldChart function:
// chart is the target chart object to apply new settings,
// options is an object containing the new settings
$.olympicApp.plotGoldChart =
function(chart, options) {
// Get the top 10 countries with the
// most gold medals
$.getJSON('./gold_10.json',
function(result) {
var device = getDevice();
// Remove any series in the chart if exists
....
// If display pie chart,
// then we only plot the gold medals series
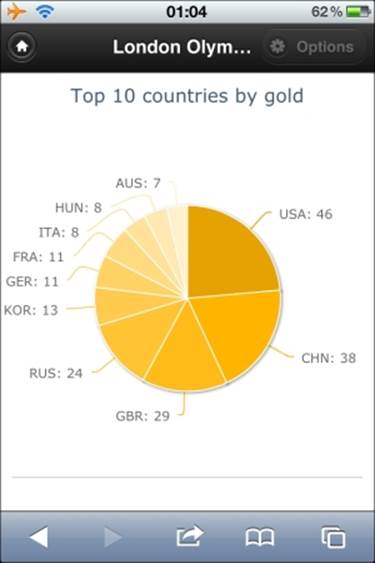
if (options && options.type == 'pie') {
var goldOpt = {
data: [],
point: pointEvt,
type: 'pie',
dataLabels: { ... }
};
$.each(result.rows,
function(idx, data) {
goldOpt.data.push({
// If device is phone,
// set short country labels
// otherwise full names
name: (device === 'phone') ?
data.code : data.country,
y: data.gold,
color: pieGoldColors[idx]
});
});
chart.addSeries(goldOpt, false);
// Disable option button for pie chart
$('#options').addClass('ui-disabled');
} else {
// Sorting out chart option - stacking,
// dataLabels if specified in the option
// parameters
var dataLabel = (options &&
options.dataLabel) ? {
enabled: true,
rotation:
(getOrientation() == 'landscape') ?
0 : -45,
color: '#404040'
} : {
enabled: false
} ;
var stacking = (options &&
options.stacking) || null;
var bronzeOpt = {
data: [], name: 'Bronze',
color: '#BE9275',
stacking: stacking,
dataLabels: dataLabel,
point: pointEvt
};
var silverOpt = {
data: [], name: 'Silver',
color: '#B5B5B5',
stacking: stacking,
dataLabels: dataLabel,
point: pointEvt
};
var goldOpt = {
data: [],
name: 'Gold',
color: '#FFB400',
point: pointEvt,
stacking: stacking,
dataLabels: dataLabel
};
var category = [];
$.each(result.rows,
function(idx, data) {
// Display country code on phone
// otherwise name
category.push((device === 'phone') ?
data.code : data.country);
goldOpt.data.push(data.gold);
silverOpt.data.push(data.silver);
bronzeOpt.data.push(data.bronze);
});
chart.xAxis[0].setCategories(category);
chart.addSeries(bronzeOpt, false);
chart.addSeries(silverOpt, false);
chart.addSeries(goldOpt, false);
// Enable the option button for the
// column chart
$('#options').removeClass('ui-disabled');
}
chart.redraw();
}); // function(result)
}; // function(chart, …
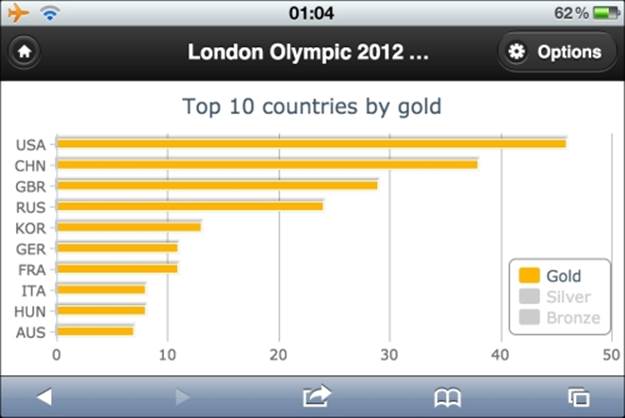
The plotGoldChart method is a general routine to plot a series into an existing chart. The options parameter is a configuration object with new settings to be applied to the chart. First, the function invokes an Ajax call, gold_10.json, to get the top 10 countries with the most gold medals. Here is what the result looks like in JSON format:
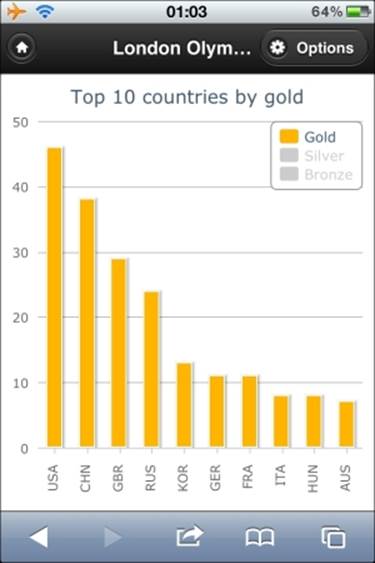
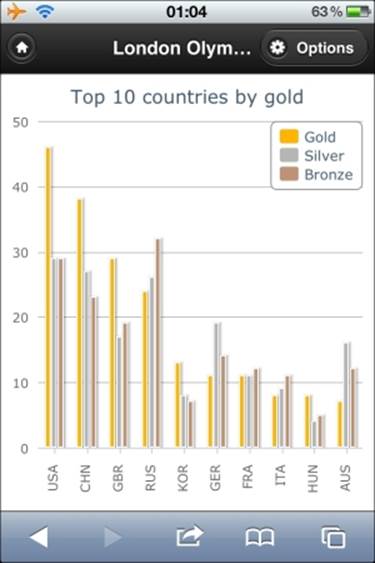
{"rows": [{
"country":"United States","gold":46,"silver":29,"bronze":29,
"total":104,"code":"USA"
},{
"country":"China","gold":38,"silver":27,"bronze":23,
"total":88,"code":"CHN"
},{
"country":"Great Britain & N.Ireland",
"gold":29,"silver":17,"bronze":19, "total":65,"code":"GBR"
},{
"country":"Russia Federation",
"gold":24,"silver":26,"bronze":32,"total":82,"code":"RUS"
}, { ....
}]
Upon the results being returned, the handler function examines the options parameter for series type, device orientation, and other fields (stacking and data labels from the config dialog, which we will discuss later). Then, it creates the chart based on the settings. If the type property is column, then we create three column series called Gold, Silver, and Bronze with the point click event configured. If the type value is pie, then it creates a single pie series of gold medals with a gradual change of colors and data labels.
So, when the gold_chart page is first loaded, a column chart is created and displayed. The following screenshot shows the initial column chart in portrait mode:
If we touch the legend items to display the number of silver and bronze medals, the chart looks like the following screenshot:
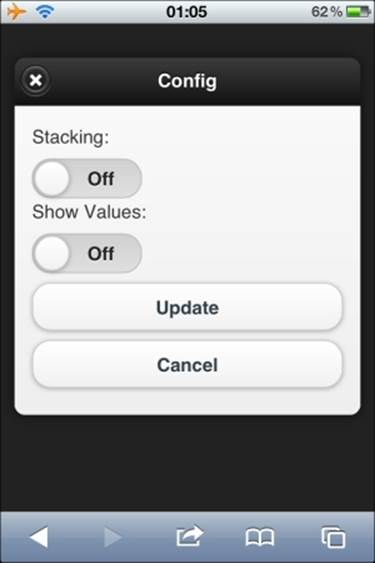
Switching graph options with the jQuery Mobile dialog box
The Options button in the top right-hand corner is only enabled if the current display chart is a column chart. It launches an option dialog box for switching stack columns and data labels. The following code is for the mobile page for the dialog box:
<div data-role="page" id='options' >
<div data-role="header">
<h1>Config</h1>
</div><!-- /header -->
<div data-role="content">
<label for="stacking">Stacking:</label>
<select name="stacking" id="stacking"
data-role="slider">
<option selected="selected">Off</option>
<option>On</option>
</select>
<label for="dataLabel">Show Values:</label>
<select name="dataLabel" id="dataLabel"
data-role="slider">
<option selected="selected">Off</option>
<option>On</option>
</select>
<a href="#" data-role="button"
data-rel="back" id='updateChart' >Update</a>
<a href="#" data-role="button"
data-rel="back" >Cancel</a>
</div>
</div><!-- /page -->
The <select> markups in jQM are rendered as slider switches with the data-role='slider' attribute and the hyperlinks are rendered as dialog buttons with the data-role='button' attribute. The following screenshot shows the dialog page:
Likewise, we program the pageinit handler for the dialog page to initialize the Update button action:
$(document).on('pageinit', '#options',
function() {
var myApp = $.olympicApp;
$('#updateChart').click(function() {
var stacking =
($('#stacking').val() === 'Off') ?
null: 'normal';
var dataLabel =
!($('#dataLabel').val() == 'off');
myApp.plotGoldChart(myApp.goldChart, {
stacking: stacking,
dataLabel: dataLabel
});
});
});
Actually, the action code for the button is very simple. Since we define the Update button with the data-rel='back' attribute, as soon as we tap the button, the dialog box is closed and we go back to the previous page. The option values from the <select> inputs are passed to the plotGoldChart routine to redraw the current chart. The following is a screenshot with only Show Values switched on:
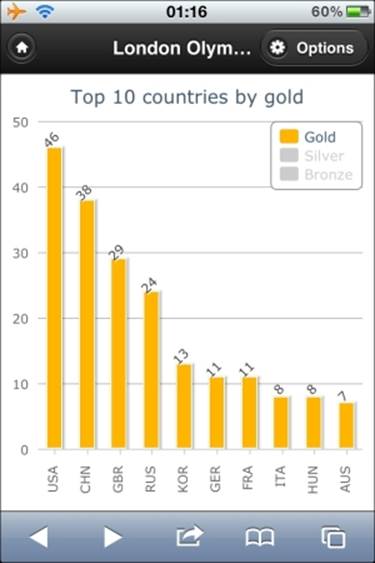
The following screenshot shows a column chart with both stacking and data labeling switched on:
Changing the graph presentation with a swipeleft motion event
Here, we enhance the experience by adding a swipeleft event to a chart. What we try to achieve is to apply a swipe motion from the right-hand side to the left-hand side on an existing column chart. This action switches the column chart to a pie chart with the same dataset, and vice versa with the swiperight motion:
// Switch to pie chart
$('#chart_container').on('swipeleft',
function(evt) {
var myApp = $.olympicApp;
if (myApp.goldChart.series[0].type == 'column') {
myApp.plotGoldChart(myApp.goldChart, {
type: 'pie'
});
}
});
// Switch back to default column chart
$('#chart_container').on('swiperight',
function(evt) {
var myApp = $.olympicApp;
if (myApp.goldChart.series[0].type == 'pie') {
myApp.plotGoldChart(myApp.goldChart);
}
});
The guard condition inside the handler is to stop redrawing the chart with the same presentation. The following is the view after the swipeleft action:
Switching the graph orientation with the orientationchange event
Assume that we are viewing the column chart on a touch-phone device in the portrait position. If we rotate the device, the chart will resize itself but the scale along the y axis is squashed. As a result, there is less clarity when comparing how well each country did. To overcome that, we use another jQuery Mobile event, orientationchange, that triggers when the mobile device is rotated. Here is the implementation for the handler:
var device = ($(window).width() > 750) ? 'tablet' : 'phone';
// Switch between vertical and horizontal bar
$(document).on('orientationchange',
function(evt) {
// We only do this for phone device because
// the display is narrow
// Tablet device have enough space, the
// chart will look fine in both orientations
if (device == 'phone') {
var myApp = $.olympicApp;
var orientation = getOrientation();
// I have to destroy the chart and recreate
// to get the inverted axes and legend box
// relocated
myApp.goldChart.destroy();
// create the chart optimized for horizontal
// view and invert the axis.
myApp.goldChart = createChart({
device: device,
orientation: orientation,
inverted: (orientation === 'landscape'),
load: myApp.plotGoldChart,
legend: ....,
});
// Hide the address bar
window.scrollTo(0,1);
}
}
);
We recreate the chart with the inverted option set to true to swap both x and y axes, as well as positioning the legend in the lower-right corner instead. A method for the chart load event is also set up in the configuration. In the end, an inverted chart is produced, as shown in the following screenshot:
The following is a screenshot from a tablet device showing the gold and silver medals' chart:
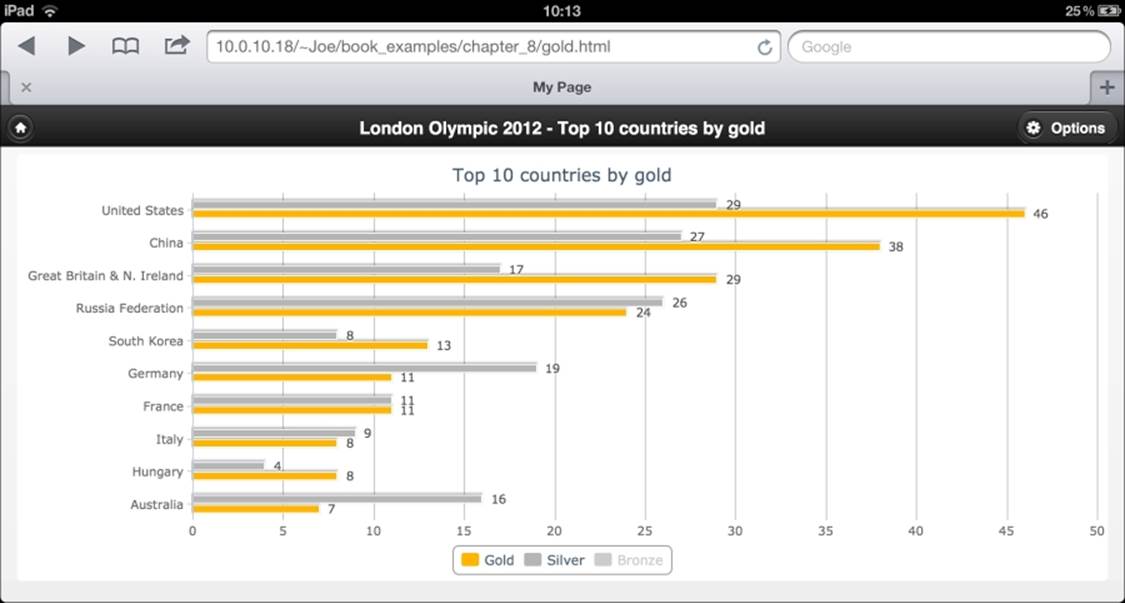
The plotGoldChart method detects a larger display and renders the chart (using the setCategories method) with full country names instead of the country code from the JSON result.
Drilling down for data with the point click event
So far we have only fiddled with the top countries ordered by gold medals. Let's see how we can use a Highcharts event to navigate around other charts in jQuery Mobile. Back with the pageinit handler code for chart_page, we declared the pointEvt variable, which is a click event handler shared by all the series in gold medal charts. The following code is for the event:
var pointEvt = {
events: {
click: function(evt) {
document.location.href = './sport.html?country='
// Country code or name
+ encodeURIComponent(this.category) +
// Medal color
'&color=' + this.series.name;
}
}
};
This event is triggered by touching a bar in a column chart or a slice in a pie chart. As a result, it loads a new document page (sport.html) with a bar chart. The URL for the document page is built inside the handler with the selected country code and the medal color as parameters. The HTML content of the page is listed in the next section. The this keyword refers to the data point (that is, the country bar) being clicked. The bar chart displays the list of sports in which the selected country won medals, along with the medal color. The following screenshot shows a chart for a list of sports in which Great Britain and Northern Ireland won gold medals:
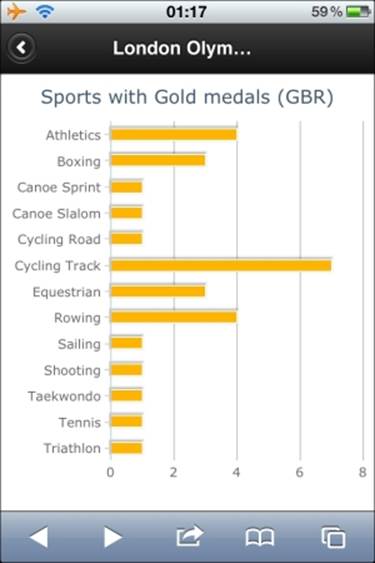
Inside the new page, it uses similar code to the gold medal countries chart to produce the graph shown in the preceding screenshot. The only difference is that it is embedded with the point click callbacks. We will see that in the next section.
Building a dynamic content dialog with the point click event
Now we know which sports have achieved gold medals in the Olympics, but we want to further find out who the medalists are. Let's touch the Athletics bar in the chart. A dialog box appears and presents a list of athletes in thumbnails along with their names, photos, and their event information, as shown in the following screenshot:
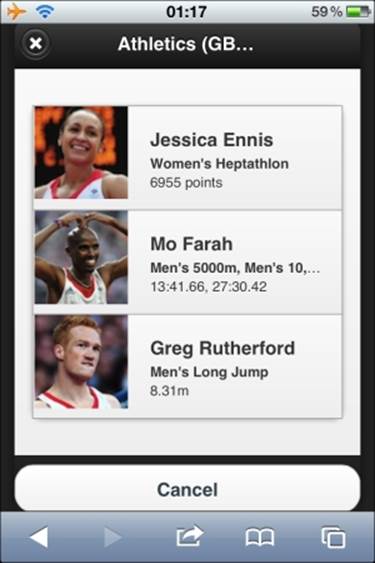
Notice that the dialog box shown in the preceding screenshot is not a static HTML page. This is constructed via a point click event and builds the dialog box content dynamically from the result. The problem is that, in order to launch a dialog page in jQM, we need to have a button somewhere on the page to start from. The trick is to create a jQM hidden button and a program to invoke the click action from inside the event handler. The following code is the HTML (sport.html) for both the hidden button and dialog page:
<!-- hidden dialog -->
<a id='hiddenDialog' href="#atheletes_dialog"
data-rel="dialog" data-transition="pop"
style='display:none;'></a>
<!-- medalists page -->
<div data-role="page" id='atheletes_dialog' >
<div data-role="header">
<h1></h1>
</div><!-- /header -->
<div data-role="content">
<ul data-role="listview" data-inset="true"
id='atheletes_list' >
</ul>
</div>
<a href="" data-role="button" data-rel="back">Cancel</a>
</div><!-- /page -->
The following is the implementation of the click handler for the sports chart:
point: {
events: {
click: function(evt) {
var params = {
country : urlParams.country,
color : urlParams.color.toLowerCase(),
sport : this.category
};
// Set the title for dialog
$('#atheletes_dialog h1').text(this.category +
" (" + urlParams.country + ") - " +
urlParams.color + " medalists");
// Simulate a button click to launch the
// list view dialog
$('#hiddenDialog').click();
// Launch ajax query, append the result into
// a list and launch the dialog
$.getJSON('./olympic.php', params,
function(result) {
$("#atheletes_list").empty();
$.each(result.rows,
function(idx, athelete) {
// Formatting the image, name, and
// the sport event
var content = "<li><img src='" +
athelete.image + "' />" + "<h3>" +
athelete.name + "</h3><p><strong>"
+ athelete.event +
"</strong></p><p>" +
athelete.desc + "</p></li>";
$("#atheletes_list").append(content);
});
// Need this to apply the format to
// the new entry
$('#atheletes_list').listview('refresh');
}); // getJSON
}
}
First, we assemble the title for the dialog page ready to launch. Then, we trigger an action click to the hidden button with the call as follows:
$('#hiddenDialog').click();
This in turn generates a click event to launch the dialog page. Then, we issue an Ajax query for the list of medalists with the current selected country, medal color, and sport as the filters. The server page, olympic.php, contains the Olympic result of each nation. It sorts the result according to the URL parameters and formats the ordered list in JSON format. We then convert each item from the JSON result and insert them into the <ul> list, atheletes_list.
Applying the gesturechange (pinch actions) event to a pie chart
So far, we have only explored actions involving a single touch point. Our next goal is to learn how to apply more advanced action events with multi-touch. One of the most common actions is the pinch-in/out for zooming out/in respectively. The Safari browser for iOS supports this motion with the gesturestart, gesturechange, and gestureend events. Whenever there are two or more fingers touching the screen, the gesturestart event is fired. Then, the gesturechange event is triggered when the fingers are moved on the screen. When the fingers leave the screen, the gestureend event is generated. In returning control to the event handler, if the action is recognized, a certain property in the event object is updated. For instance, the scale property in the event object is set to larger than 1.0 for pinch-out and less than 1.0 for pinch-in. For the GestureEvent class reference, please see https://developer.apple.com/library/mac/documentation/AppleApplications/Reference/SafariWebContent/HandlingEvents/HandlingEvents.html.
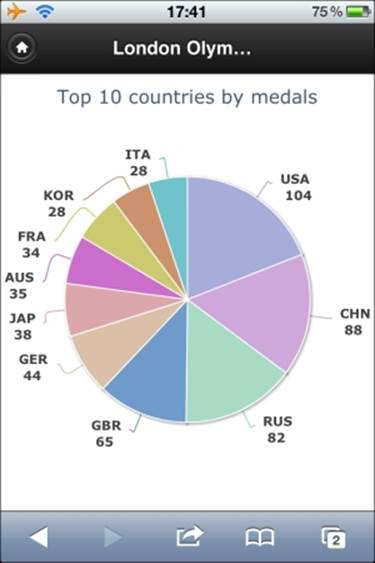
In this section, we will apply the pinch motions to a pie chart. For the pinch-out action, we turn the pie chart into a doughnut chart with extra information on the outer ring—and vice versa for pinch-in, turning the doughnut chart back to a pie chart. First of all, let's launch a new chart, Top 10 countries by medals, the second item from the front menu. The following screenshot is the output of the chart:
When we perform a pinch-out action, the chart is redrawn as shown in the following screenshot:
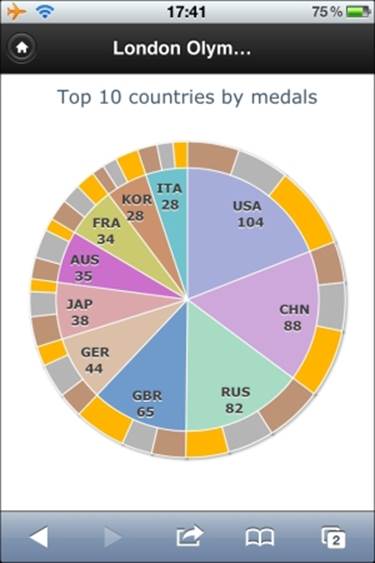
The outer ring shows the ratio of each color medal for each country. Moreover, the original pie chart data labels move inwards to make space for the outer ring. Let's see how the gesturechange event is implemented. The following is the code inside the pageinithandler:
$('#chart_container').on('gesturechange',
function(evt) {
evt = evt.originalEvent || evt;
var myApp = $.olympicApp;
if (evt.scale > 1) {
// Pinch open - from pie chart to
// donut chart
if (!myApp.medalChart.series[1].visible) {
myApp.medalChart.destroy();
myApp.medalChart = createChart({
orientation: getOrientation(),
device: device,
outerRing: true,
load: myApp.plotMedalChart
});
}
} else if (myApp.medalChart.series[1].visible) {
// Pinch close
myApp.medalChart.destroy();
myApp.medalChart = createChart({
orientation: getOrientation(),
device: device,
load: myApp.plotMedalChart
});
}
});
We bind the gesture event to the chart container. This event handler is called whenever there is a multi-touch gesture made on the screen, such as a pinch or rotate motion. In order to make sure this is a pinch action, we need to look into the original event generated by the browser that is wrapped by the jQuery layer. We will examine whether the scale property has been set and decide whether it is pinch-in or pinch-out, then we will recreate the pie or doughnut chart if necessary.
Summary
The goal of this chapter was to deploy Highcharts graphs on mobile touch devices. To do that, we used a mobile web development framework, jQuery Mobile. We worked through a very brief introduction and the concepts of the framework. We then examined how to integrate Highcharts with jQuery Mobile.
Then, we demonstrated a mobile application to show the results of the Olympic 2012 medals table. A menu of charts was built using the jQuery Mobile dialog page, and then we showed how to use the single-touch, multi-touch, and orientation events to navigate between charts. We also showed how to use the Highcharts click event to build a dialog page dynamically.
In the next chapter, we will learn how to apply Highcharts with ExtJs, a very powerful and popular Rich Internet Application (RIA) framework for building a desktop-style application.
All materials on the site are licensed Creative Commons Attribution-Sharealike 3.0 Unported CC BY-SA 3.0 & GNU Free Documentation License (GFDL)
If you are the copyright holder of any material contained on our site and intend to remove it, please contact our site administrator for approval.
© 2016-2026 All site design rights belong to S.Y.A.