Learning Highcharts 4 (2015)
Chapter 13. Highcharts and Ext JS
This chapter starts with an introduction of Sencha's Ext JS. Since the Ext JS framework covers a broad range of features, it comprises a large collection of classes. Therefore, a quick guide on a small set will be given, especially for the user interface components likely to be used with Highcharts. Then, we will learn which Highcharts extension we have for Ext JS and how to create a Highcharts graph within Ext JS. We will also learn about a small set of APIs provided by the extension. After that, we will use network data to build a simple application to demonstrate how the Ext JS components can interact with Highcharts. Finally, we will have a brief look at a commercial Ext JS application working together with Highcharts. In this chapter, we will cover the following topics:
· Introducing and giving a quick tutorial on Sencha Ext JS classes
· Introducing the Highcharts extension for Ext JS
· Demonstrating how to convert a working Highcharts configuration for the extension
· Preparing the Ext JS JsonStore object for the extension
· Describing APIs provided by the extension module
· Illustrating how to create an Ext JS application with the Highcharts extension
A short introduction to Sencha Ext JS
Sencha's Ext JS is one of the most comprehensive Rich Internet Application (RIA) frameworks on the market. An RIA framework can produce a web frontend that behaves like a desktop application. Ext JS supports many features such as proxy storage, charting, managing SVG, tabs, toolbars, a myriad of different form inputs, and many, many others. There are other popular RIA frameworks, such as the Java-based Google Web Toolkit (GWT) and Python-based Dojo. Both frameworks can be integrated with Highcharts via third-party contributed software.
Note
See http://www.highcharts.com/download under the section Third Party Implementation for the full list of software contributed by other developers.
The Highcharts extension was originally written by Daniel Kloosterman for Ext JS 2+ as an adapter, as it didn't support any charts. In Ext JS 3, it started adopting the YUI charting library as the charting solution. However, the charts lacked features and style, and the main drawback was that they required Flash to run. Since Ext JS 3.1, I have been maintaining the Highcharts extension and added features, such as support for donut charts and enhancements for some of the APIs.
Although Ext JS 4 comes with its own chart library, some users still prefer Highcharts over Ext JS 4 charts for style and flexibility. Moreover, Ext JS 4 can run alongside version 3 codes, so it is desirable to enhance the extension to natively support Ext JS 4, which I have done. The extension implementation has always been to follow the original approach, which is to preserve the use of Highcharts configurations as much as possible.
At the time of writing, Ext JS 5 has just been released and the changes from Ext JS 4 to Ext JS 5 are not as drastic as from Ext JS 3 to Ext JS 4. The Highcharts extension has been updated to be fully compatible with both Ext JS 4 and 5. In this chapter, we will focus on working with Ext JS 5. All the examples are simply from the previous edition, which is based on Ext JS 4, and they are updated to work with Ext JS 5.
There are demos online at http://joekuan.org/demos/Highcharts_Sencha/desktop.extjs5/ and the extension can be downloaded from http://github.com/JoeKuan/Highcharts_Sencha/.
Unlike jQuery UI, an Ext JS application is programmed in pure JavaScript, without the need to collaborate with HTML markup or fiddle with particular CSS classes (strictly speaking, there are times when it is necessary to interface with HTML and CSS, but it is not common and is only in small doses). This empowers programmers to focus on developing the entire web application in a single language and to concentrate on application logic. That also pushes the server-side development to reside in data operations only, unlike some approaches that use server-side language with HTML and CSS to serve client pages.
Technically, JavaScript does not have classes: function itself is an object. The Ext JS framework provides access to its components through the class approach, organized in a hierarchical manner. In this chapter, we will use the word "class" to refer to Ext JS classes.
A quick tour of Ext JS components
There are a myriad of classes in Ext JS, and it is beyond the scope of this book to introduce them. Sencha provides three types of online documentation in terms of both quality and quantity: a reference manual, tutorials (written and video), and working demos. You are strongly advised to spend ample time reviewing these materials. In this section, a very brief introduction is given about some components, especially those that are likely to interface with Highcharts. This chapter is by no means enough to get you started with programming in Ext JS, but should be enough to give you an idea.
Implementing and loading Ext JS code
An Ext JS application can always be divided into multiple JavaScript files, but they should always start from one HTML file. The following code snippet demonstrates how to start up Ext JS from an HTML file:
<html>
<head>
<meta http-equiv="Content-Type"
content="text/html; charset=UTF-8">
<title>Highcharts for Ext JS 5</title>
// At the time of writing, there is no CDN for ExtJs 5
// Download http://www.sencha.com/products/extjs/download/ext-js-5.0.0/3164
<link rel="stylesheet" type="text/css"
href="/extjs5/packages/ext-theme-classic/build/resources/ext-theme-classic-all.css" />
</head>
<body></body>
<script type="text/javascript" src="/extjs5/ext-all.js"></script>
<script type='text/javascript'>
Ext.require('Ext.window.Window');
Ext.onReady(function() {
// application startup code goes here
....
});
</script>
</html>
Ext JS 5 is packaged with various themes. The preceding example demonstrates how to load one of the available themes. We will apply different themes in the examples to show the look and feel of Ext JS 5. The script file, ext-all.js, contains all the Ext JS classes in a compressed format.
Note
Ext JS has the facility to build a custom class file to cut down loading for production deployments. We are leaving that for you to explore.
Ext.require is to load specific classes used in the application. Ext.onReady is the DOM-ready method, the same as the $.ready jQuery method that the application startup code starts running inside this function.
Creating and accessing Ext JS components
Out of all the classes in Ext JS, we should start by discussing Ext.Component, which is the base class for Ext JS user interface components. Depending on the characteristics of the component, some of them such as Panel, Window, FieldSet, and RadioGroup can contain multiple components, because they are inherited through another class: Container. We will look at Container in more detail later.
To create an Ext JS object, we use the Ext.create method, which takes two parameters. The first parameter is the string presentation of a class path, for example 'Ext.window.Window', or an alias name such as 'widget.window'. The second parameter is the object specifier, containing the initial values to instantiate a class:
var win = Ext.create('Ext.window.Window', {
title: 'Ext JS Window',
layout: 'fit',
items: [{
xtype: 'textarea',
id: 'textbox',
value: 'Lorem ipsum dolor sit amet, ... '
}]
});
win.show();
The preceding code snippet is used to create a window widget and its content is defined through the items option. Window is a class derived from the Container class, which inherits the items option for containing other components. When the window is finally created and ready to render, it goes through each object specifier in the items array and creates each component.
The xtype option is the Ext-specific type, which has a short unique name to symbolize the component's class path. In Ext JS, all interface components have their own xtype names (this refers to the Ext.Component manual). The xtype option is commonly used for convenience to create components within the container, as opposed to Ext.create with a full pathname.
The id field is to give a unique ID name to a component. The purpose is to gain direct access to a component at any point inside a program. To retrieve the component with an ID value, we can execute the following line of code:
var tb = Ext.getCmp('textbox');
Alternatively, we can use the itemId option to assign a unique name. The difference is that the ID has to be globally unique to the application, whereas itemId only has to be unique within the parent container, to avoid name conflict elsewhere in the application. To access a component with the itemId value, we need to call getComponent from the immediate parent container, as follows:
var tb = win.getComponent('textbox');
Moreover, we can chain the call all the way from the top level to the desired component, as follows:
var val =
win.getComponent('panel').getComponent('textbox').getValue();
The 'textbox' (with itemId defined) component is constructed inside the parent container, 'panel', which resides inside the window object. Although the getCmp method provides direct, easy access to a component, it should generally be avoided as part of best practices, due to slower performance and undesired effects if a duplicate ID is accidentally used.
Note
For the sake of avoiding long sample code, we use the getCmp call in some of the demos.
Note that Sencha also provides convenient component navigation, up and down methods which search for target component with CSS style selector. Here is an example:
var val = win.down('#textbox').getValue();
As we can see the preceding expression is much more simplified and direct. The down method basically traverses down to its children components and so on until come across the first component with the matching criteria. In this case, the matching expression'#textbox' means a component with itemId specified as a textbox. Many different search expression can be used, another example is down('textarea') which means searching for the first child component with xtype value of textarea.
Using layout and viewport
As we mentioned earlier, some types of components have the ability to contain other components, because they are extended from the Container class. Another feature of the Container class is to arrange the layout between the contained components; the layout policy is specified via the layout option. There are about a dozen layout policies: among them 'anchor', 'border', and 'fit' are most commonly used (the card layout is also used often, but through the tab panel). The border layout is widely used in GUI programming. The layout is finely divided into the 'north', 'east', 'south', 'west', and 'center' regions.
When developing an application that requires utilizing the whole browser space, we generally use a Viewport class coupled with a border layout. Viewport is a special type of container whose size automatically binds to the browser. The following is a simple example of using a viewport:
var viewport = Ext.create('Ext.container.Viewport', {
layout: 'border',
defaults: {
frame: true
},
items: [{
region: 'north',
html: '<h1>North</h1>'
}, {
region: 'east',
html: '<h1>East</h1>',
width: '15%'
}, {
region: 'south',
html: '<h1>South</h1>'
}, {
region: 'west',
html: '<h1>West</h1>',
width: '20%'
}, {
region: 'center',
html: '<h1>Center</h1>'
}]
});
The following screenshot shows the border layout in a gray theme:

Panel
Panel is a basic container component, and is generally used as a building block with the layout format and then combined with more panels or components. Another general use is to extend the Panel class to a special purpose type of panel, for example PortalPanelin the online portal demo. The most widely used panel types are GridPanel, FormPanel, and TabPanel.
GridPanel
GridPanel is used for displaying data in table format and it comes with lots of useful features, such as drag-and-drop column ordering, column sorting, flexible data rendering, enable or disable column display functions, and many others. GridPanel can also be used with different plugins such as row editor, allowing a user to edit field values on the fly. The class comes with a large set of events settings that can establish smooth coordination with other components. Nonetheless, the most tightly coupled component is the store object, which we will demonstrate in a later section.
FormPanel
FormPanel is a panel for accommodating field input components in form style, that is, labels on the left-hand side, inputs on the right-hand side, and the buttons array. Ext JS provides a great selection of form inputs, such as date time fields, comboboxes, number fields, sliders, and many others. Underneath the FormPanel layer, there is a BasicForm component, which contributes to field validations, form submission, and loading services with the store's Record class for adding and editing entries.
The following is a screenshot of FormPanel with various inputs:
TabPanel
TabPanel, as its name implies, is a panel associated with tabs. It supports creating and removing tabs on the fly and scrolling between tabs. The following code snippet shows how to create a tab panel:
items:[{
xtype: 'tabpanel',
items: [{
title: 'Tab 1',
xtype: 'form',
items: [{
.....
}]
}, {
title: 'Tab 2',
....
}]
}]
The following is a screenshot of tabs within the tab panel, with a scrolling feature:
Window
Window is a special type of panel that is not bound to any parent container and is free-floating within the application. It offers many features found in normal desktop windows, such as resize and maximize/minimize, and also comes with options for adding a toolbar, footer bar, and buttons. Later, we will see the Window panel in action in an example.
Ajax
The Ext JS framework provides its own method, Ajax.request, for issuing Ajax queries. This is used when the returned JSON data is not required to be converted into table rows and field columns. The method is generally coupled with Ext.decode to convert the returned JSON format string into a JavaScript object and directly access individual fields inside the object.
The following code snippet shows a sample of issuing an Ajax query:
Ext.Ajax.request({
url: 'getData.php ',
params: { id: 1 },
success: function(response) {
// Decode JSON response from the server
var result = Ext.decode(response.responseText);
if (result && result.success) {
....
} else {
....
}
}
});
Store and JsonStore
Store is a general purpose storage class for modeled data. There are several classes derived from Store, but the most important one for Highcharts is JsonStore. It is a proxy-cached storage class responsible for issuing an Ajax query and unpacks the returned JSON data into modeled data. The JsonStore class is often used for accessing database data that resides on the server side. A store object can bind with more than one component, for example a JsonStore object can bind to a grid panel and a column chart. Clicking on a column order direction in the grid panel can change the row sequence in JsonStore, affecting the order of the columns displayed in the chart. In other words, the Store class acts as a skeleton to hold several components working together effortlessly and systematically.
It is important to note that the load method in the Store class is asynchronous. An event handler should be assigned to the load event if we want to tie an action after the data is loaded. The action can be specified through listeners.click via either the object specifier or store.on method.
Example of using JsonStore and GridPanel
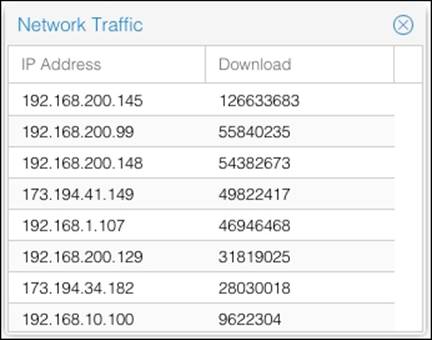
So far, a number of Ext JS components have been introduced; we should see how they work together. Let's build a simple window application that contains a table (GridPanel) showing a list of hosts with their download usage that are returned from the server. Let's assume that we have rows of data returned in JSON format from the server:
{ "data": [
{ "host" : "192.168.200.145", "download" : 126633683 },
{ "host" : "192.168.200.99" , "download" : 55840235 },
{ "host" : "192.168.200.148", "download" : 54382673 },
...
] }
First we define the data model to correspond with the JSON data. For the sake of simplicity, we can put all our demo code inside Ext.onReady rather than in a separate JavaScript file:
Ext.onReady(function() {
Ext.define('NetworkData', {
extend: 'Ext.data.Model',
fields: [
{name: 'host', type: 'string'},
{name: 'download', type: 'int'}
]
});
});
Note
It is not mandatory to accept field names returned by the server. Ext.data.Model offers the mapping option to map an alternative field name to use on the client side.
The next step is to define a JsonStore object with the URL, connection type, and the data format type. We will bind the JsonStore object with the NetworkData data model defined in the preceding code snippet:
var netStore = Ext.create('Ext.data.JsonStore', {
autoLoad: true,
model: 'NetworkData',
proxy: {
type: 'ajax',
url: './getNetTraffic.php',
reader: {
type: 'json',
idProperty: 'host',
rootProperty: 'data'
}
}
});
idProperty is used to define which field is regarded as an ID if the default 'id' fieldname is not provided, so that methods such as Store.getById can function properly. The root option tells the reader (JsonReader) which property name holds the array of row data in the JSON response from the server. The next task is to build a Window panel with a GridPanel class, as follows:
var win = Ext.create('Ext.window.Window', {
title: 'Network Traffic',
layout: 'fit',
items: [{
xtype: 'grid',
height: 170,
width: 270,
store: netStore,
columns: [{
header: 'IP Address',
dataIndex: 'host',
width: 150
}, {
header: 'Download',
dataIndex: 'download'
}]
}]
}).show();
We instruct the grid panel to bind with the netStore object and define a list of columns to display. We then match each column to the store's data field through the dataIndex option. The following is a screenshot showing part of a window (crisp theme) with a grid panel inside it:
The Highcharts extension
In this section, we will examine how simple it is to create a Highcharts component in Ext JS. We do this by importing from an existing Highcharts configuration. Let's continue from the previous JsonStore example and incorporate it within the extension.
Step 1 – removing some of the Highcharts options
Let's assume that we already have a working independent Highcharts configuration, as follows:
var myConfig = {
chart: {
renderTo: 'container',
width: 350,
height: 300,
....
},
series: [{
type: 'column',
data: [ 126633683, 55840235, .... ]
}],
xAxis: {
categories: [ "192.168.200.145",
"192.168.200.99", ... ],
....
},
yAxis: { .... },
title: { .... },
....
};
The first step is to remove all the fields that the extension will handle internally and pass them to Highcharts. For this reason, we need to remove chart.renderTo and the dimension options. We also need to remove the chart.series array, because eventually JsonStorewill be the source of graph data. We also want to remove chart.xAxis.categories as it contains graph data.
Step 2 – converting to a Highcharts extension configuration
The next step is to construct a new configuration for the extension derived from the old Highcharts configuration. Let's start a new configuration object, myNewConfig, with the size properties:
var myNewConfig = {
width: 350,
height: 300
};
The next step is to create a new option, chartConfig, which is required by the extension. We put the rest of the properties left in the myConfig object towards chartConfig. The following code snippet shows what the new config should look like:
// ExtJS component config for Highcharts extension
var myNewConfig = {
width: 450,
height: 350,
chartConfig: {
// Trimmed Highcharts configuration here
chart: { .... },
xAxis: { .... },
yAxis: { .... },
title: { .... },
....
}
};
Step 3 – constructing a series option by mapping the JsonStore data model
Recalling the data model of the store object, we have the following code snippet:
fields: [
{ name: 'host', type: 'string' },
{ name: 'download', type: 'int' }
]
The next task is to build a series array with options matching the data model of JsonStore. The new series array has a similar structure to the one in Highcharts options. We also need to link the store object inside the object configuration. Eventually, the options object should become like the following code snippet:
var myNewConfig = {
width: 450,
height: 350,
store: netStore,
series: [{
name: 'Network Traffic',
type: 'column',
// construct the series data out of the
// 'download' field from the return Json data
dataIndex: 'download'
}],
// construct the x-axis categories data from
// 'host' field from the return Json data
xField: 'host',
chartConfig: {
....
}
};
The dataIndex option is used for mapping the y value from JsonStore into the series data array. As the 'host' field is string-type data, it is used as categories. Therefore, we specify the xField option outside the series array shared by the series.
Step 4 – creating the Highcharts extension
The final step is to put everything together to display a chart in Ext JS. We can create a Highcharts component first and put it inside an Ext JS container object, as follows:
var hcChart = Ext.create('Chart.ux.Highcharts', myNewConfig);
var win = Ext.create('widget.window', {
title: 'Network Traffic',
layout: 'fit',
items: [ hcChart ]
}).show();
Or alternatively, we can create the whole thing through one configuration using xtype, as follows:
var win = Ext.create('widget.window', {
title: 'Network Traffic',
layout: 'fit',
items: [{
xtype: 'highchart',
itemId: 'highchart',
height: 350,
width: 450,
store: netStore,
series: [{ .... }],
xField: 'host',
chartConfig: {
chart: { .... },
xAxis: { .... },
yAxis: { .... },
....
}]
}).show();
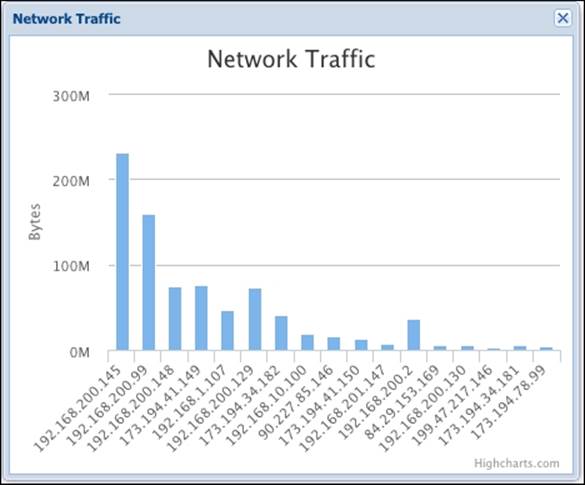
The following screenshot shows a Highcharts graph inside an Ext JS window (classic theme):
Note
In order to display data at startup, the JsonStore must be instantiated by setting the autoLoad option to true or calling the Store.load method manually at the start of the program.
Passing series-specific options in the Highcharts extension
If we need to pass series-specific options, for example color, data point decorations, and so on, then we simply put them into the series configuration in the same way we normally do in Highcharts:
.....
store: netStore,
series: [{
name: 'Network Traffic',
type: 'column',
dataIndex: 'download',
color: '#A47D7C'
}],
The extension will copy these options across at the same time as creating the series.
Converting a data model into a Highcharts series
In the previous example, we learned how to map a simple data model from the Ext JS store into Highcharts. However, there are several ways to declare the data mapping, and each way has different implications depending on the scenarios, especially in multiple series.
X-axis category data and y-axis numerical values
This is the simplest and probably the most common scenario. Each series has numerical values along the y axis and shares data between the categories. For historical reasons, the dataIndex option can also be replaced with another option name, yField, which has a higher priority, and both behave in exactly the same way:
series: [{
name: 'Upload',
type: 'column',
yField: 'upload'
}, {
name: 'Download',
type: 'column',
yField: 'download'
}],
// 'Monday', 'Tuesday', 'Wednesday' ....
xField: 'day'
Numerical values for both x and y axes
Another scenario is where both the x and y axes are made up of numerical values. There are two different ways to specify the data mapping. First, each series holds the y axis values and shares common x axis values. In this case, the series are specified in the same way as the previous example:
series: [{
name: 'Upload',
type: 'line',
yField: 'upload'
}, {
name: 'Download',
type: 'line',
yField: 'download'
}],
// Time in UTC
xField: 'time'
Another situation is that each series holds its own pairs of x and y values, as follows:
series: [{
name: 'Upload',
type: 'line',
yField: 'upload',
xField: 'upload_time'
}, {
name: 'Download',
type: 'line',
yField: 'download',
xField: 'download_time'
}]
The difference between the two settings is that the first configuration ends up with two line series in the graph with data points aligning along the x axis, whereas the latter one doesn't, and the store data model is different as well.
Performing preprocessing from store data
Suppose that we need to perform a preprocessing task on the server data before we can plot the chart. We can do this by overriding a template method in the series configuration.
Inside the extension code, each series is actually instantiated from a Serie class. This class has a standard method defined, getData, which is for retrieving data from the store. Let's visit the original implementation of getData:
getData : function(record, index) {
var yField = this.yField || this.dataIndex,
xField = this.xField,
point = {
data : record.data,
y : record.data[yField]
};
if (xField)
point.x = record.data[xField];
return point;
},
Note
The classes and methods in this extension are named that way with the word "Serie" by the original author.
Basically, getData is called for every row returned from JsonStore. The method is passed with two parameters. The first one is an Ext JS Record object, which is an object representation of a row of data. The second parameter is the index value of the record inside the store. Inside the Record object, the data option holds the values according to the model definition when the store object is created.
As we can see, the simple implementation of getData is to access record.data based on the values of xField, yField, and dataIndex and format it into a Highcharts Point configuration. We can override this method as we declare a series to suit our need for data conversion. Let's continue the example: suppose the server is returning the data in a JSON string:
{"data":[
{"host":"192.168.200.145","download":126633683,
"upload":104069233},
{"host":"192.168.200.99","download":55840235,
"upload":104069233},
{"host":"192.168.200.148","download":54382673,
"upload":19565468},
....
JsonStore interprets the preceding data as rows with the following model definition:
fields: [
{name: 'host', type: 'string'},
{name: 'download', type: 'int'},
{name: 'upload', type: 'int'}
]
We need to plot a column chart with each bar as the total of the upload and download fields, so we define the getData method for the series as shown next. Note that we don't need to declare yField or dataIndex anymore, because the getData method for this particular series has already taken care of the field mappings:
series: [{
name: 'Total Usage',
type: 'column',
getData: function(record, index) {
return {
data: record.data,
y: record.data.upload +
record.data.download
};
}
}],
xField: 'host',
....
Plotting pie charts
Plotting pie charts is slightly different to line, column, and scatter charts. A pie series is composed of data values where each value is from a category. Therefore, the module has two specific option names, categorieField and dataField, for category and data, respectively. To plot a pie chart, the series is needed to specify the following:
series: [{
type: 'pie',
categorieField: 'host',
dataField: 'upload'
}]
The getData method of the PieSeries class subsequently converts the mapped data from the store into the Point object, with values assigned to the name and y fields.
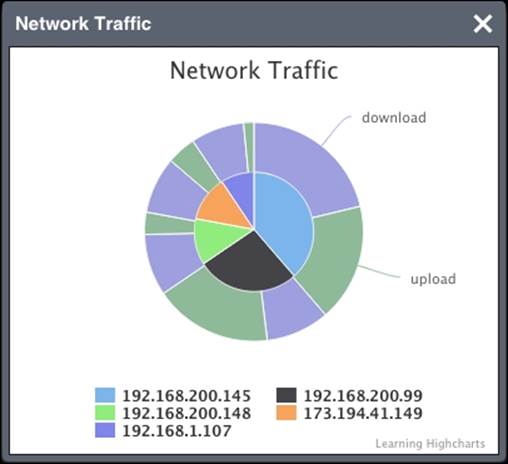
Plotting donut charts
Let's remind ourselves that a donut chart is actually a two-series pie chart in which the data in the inner pie is a subcategory of the outer pie. In other words, each slice in the inner series is always the total of its outer portions. Therefore, the data returned fromJsonStore has to be designed in such a way that these can be grouped into subcategories by field name. In this case, the JSON data should be returned, as follows:
{ "data": [
{ "host" : "192.168.200.145", "bytes" : 126633683,
"direction" : "download"},
{ "host" : "192.168.200.145", "bytes" : 104069233,
"direction" : "upload"},
{ "host" : "192.168.200.99", "bytes" : 55840235,
"direction" : "download"},
{ "host" : "192.168.200.99", "bytes" : 104069233,
"direction" : "upload"},
....
] }
Then, we use an extra Boolean option, totalDataField, for the inner pie series to indicate that we want to use dataField to scan for the total value for each "host" category. As for the outer series, we just define it as a normal pie series, but with "direction" and"bytes" as categorieField and dataField, respectively. The following is the series definition for the donut chart:
series: [{
// Inner pie
type: 'pie',
categorieField: 'host',
dataField: 'bytes',
totalDataField: true,
size: '60%',
....
}, {
// Outer pie
type: 'pie',
categorieField: 'direction',
dataField: 'bytes',
innerSize: '60%',
....
}]
The following screenshot shows what a donut chart looks like in Ext JS (aria theme):
Inside the extension, the implementation of the getData method for the PieSeries class is significantly different from other series types, in order to handle both pie and donut series data. Therefore, it is not advisable to overwrite this method. Later on, we will see how pie and donut charts are plotted with this module.
Module APIs
The Highcharts extension comes with a small set of APIs. Most of them are helper functions to modify series in the Ext JS layer. As for the Highcharts native APIs, they can be invoked through the chart property inside the extension component, for example:
win.down('#highchart').chart.getSVG({ ... });
In the preceding line of code, 'highchart' is the itemId value when the chart component is created. The down method is Ext JS's convenient way of using the CSS selection style to navigate through the hierarchical components.
As mentioned earlier, the chartConfig option contains all the Highcharts configurations. Once the chart component is created, it saves chartConfig inside the component. Hence, the chartConfig property possesses all the initial configurations that have created the chart. Later, we will see how this chartConfig property plays a role with regards to API calls.
addSeries
The addSeries method adds one or more series into the chart. The added series is/are also stored inside the chartConfig.series array, as follows:
addSeries : function(Array series, [Boolean append])
The series parameter is an array of series configuration objects. addSeries not only allows series configuration with the xField, yField, and dataIndex options, but also supports series configuration with the data array, so it won't go via the store object to extract the data. The following are examples of using addSeries in different ways:
Ext.getComponent('highchart').addSeries([{
name: 'Upload',
yField: 'upload'
}], true);
Ext.getComponent('highchart').addSeries([{
name: 'Random',
type: 'column',
data: [ 524524435, 434324423, 43436454, 47376432 ]
}], true);
The optional append parameter sets the series parameter to either replace the currently displayed series or append the series to the chart. The default is false.
removeSerie and removeAllSeries
The removeSerie method removes a single series in the chart and the removeAllSeries method removes all the series defined for the chart. Both methods also remove the series configuration in chartConfig.series, as follows:
removeSerie : function(Number idx, [Boolean redraw])
removeAllSeries : function()
The idx parameter is the index value in the series array. The optional redraw parameter sets whether to redraw the chart after the series is removed. The default is true.
setTitle and setSubTitle
Both setTitle and setSubTitle change the current chart title as well as the title settings in chartConfig, as follows:
setSubTitle : function(String title)
setTitle: function(String title)
draw
So far, we have mentioned chartConfig but haven't really explained what it does in the module. The draw method actually destroys the internal Highcharts object and recreates the chart based on the settings inside the current chartConfig. Suppose we have already created a chart component but we want to change some of the display properties. We modify properties inside chartConfig (Highcharts configurations) and call this method to recreate the internal Highcharts object:
draw: function()
Although we can call Highcharts' native APIs via the internal chart option without destroying and recreating the chart, not all Highcharts elements can be changed with API calls, for example series color, legend layout, the column stacking option, invert chart axes, and so on.
As a result, this method enables the extension component to refresh the internal chart with any configuration change, without the need to recreate the component itself. Hence, this empowers the Ext JS application by not removing it from the parent container and reinserting a new one. Also, the layout in the parent container is not disrupted.
Event handling and export modules
Specifying chart event handlers for the extension is exactly the same as how we normally declare event handlers in Highcharts. Since this is now under both the Ext JS and jQuery environments, the implementation can use both Ext JS and jQuery methods.
The Highcharts exporting chart module is unaffected by the extension. The export settings simply bypass this extension and work straightaway.
Extending the example with Highcharts
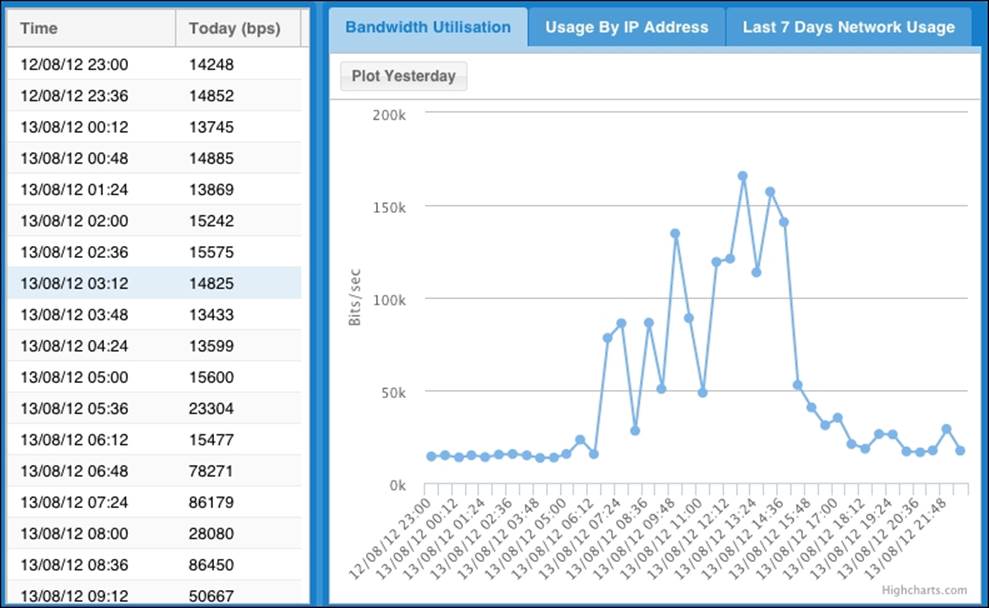
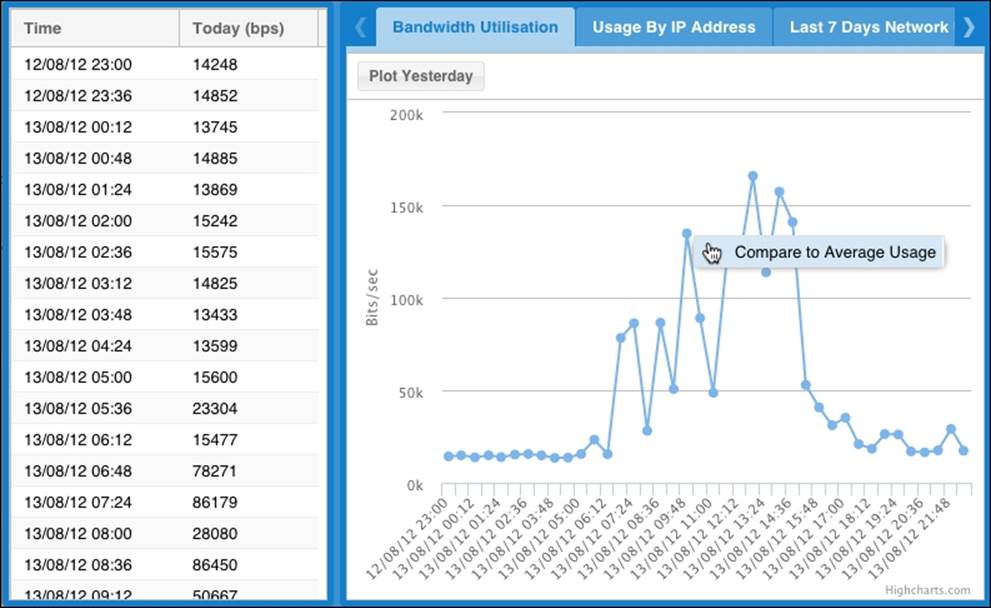
In this section, we will build a larger example that includes other types of panels and charts. The application is built with a viewport showing two regions—the 'center' region is a tab panel containing three tabs for each different type of network data graph, and the'west' region shows the table data of the current graph on display. The graph in the first tab is Bandwidth Utilisation, which indicates the data rate passing through the network.
The following screenshot shows the front screen of the application (neptune theme):
Plot Yesterday in the toolbar is a toggle button that triggers an additional series, Yesterday, to be plotted on the same chart. An extra column of data called Yesterday is also displayed in the left-hand side table, as shown in the following screenshot:
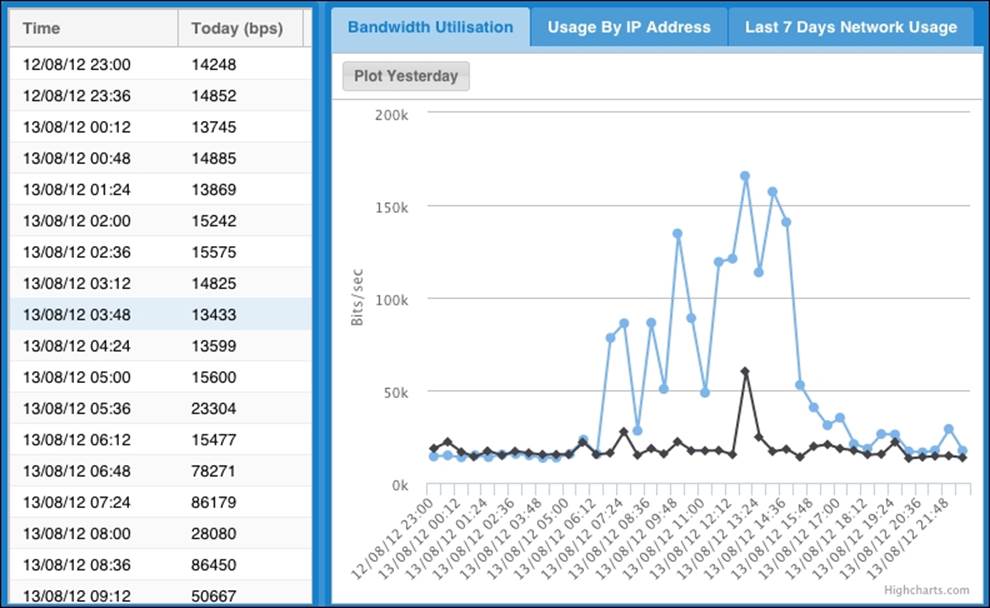
The Plot Yesterday button handler uses the addSeries and removeSeries methods internally to toggle the Yesterday series. The following is the implementation:
toggleHandler: function(item, pressed) {
// Retrieve the chart extension component
var chart = Ext.getCmp('chart1').chart;
if (pressed && chart.series.length == 1) {
Ext.getCmp('chart1').addSeries([{
name: 'Yesterday',
yField: 'yesterday'
}], true);
// Display yesterday column in the grid panel
....
} else if (!pressed && chart.series.length == 2) {
Ext.getCmp('chart1').removeSerie(1);
// Hide yesterday column in the grid panel
....
}
}
Let's move on to the second tab, which is a column chart showing a list of hosts with their network usage in uplink and downlink directions, as follows:
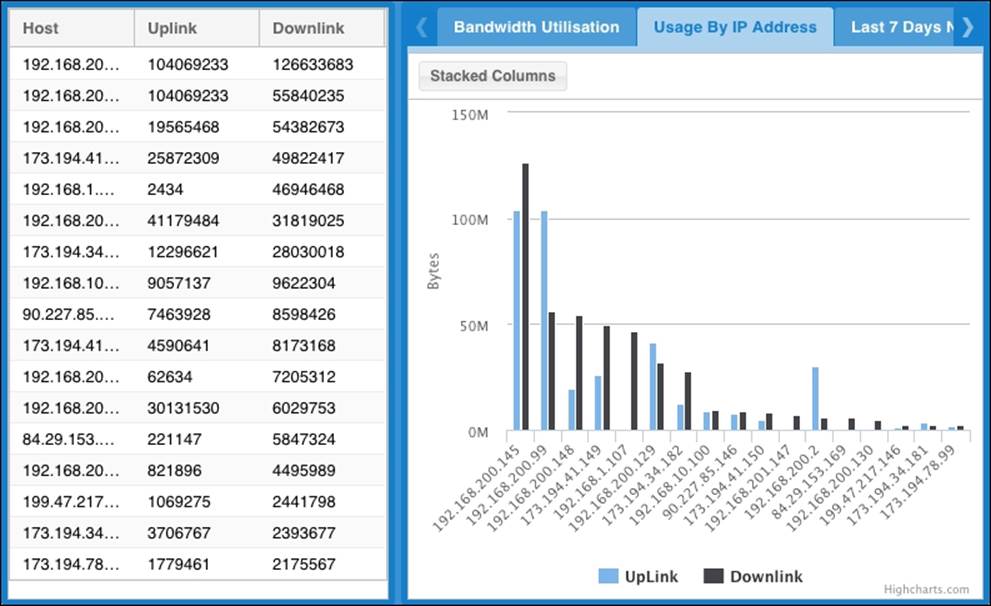
When we click on the Stacked Columns button, the bars of both series are stacked together instead of aligned adjacent to each other, as follows:
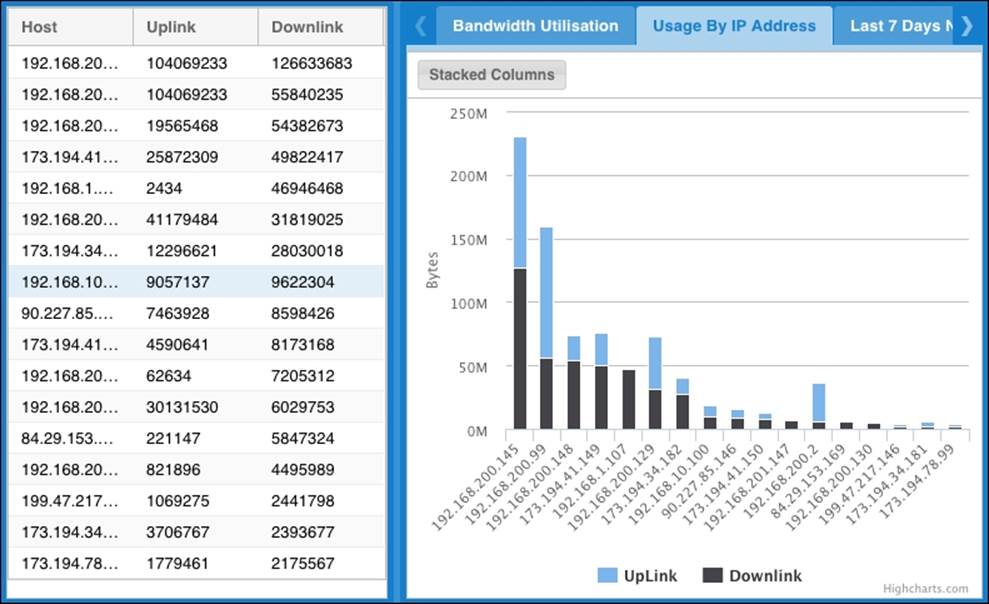
This is achieved by modifying the column stacking option inside the extension chartConfig property and recreating the whole chart with the module's draw method:
toggleHandler: function(item, pressed) {
var chart2 = Ext.getCmp('chart2');
chart2.chartConfig.plotOptions.column.stacking =
(pressed) ? 'normal' : null;
chart2.draw();
}
Note that we declare the default stacking option inside chartConfig when we create the chart, so that we can directly modify the property in the handler code later:
chartConfig: {
.... ,
plotOptions: {
column: { stacking: null }
},
......
The final tab is Last 7 Days Network Usage, which has a pie chart showing the network usage for each of the last seven days, as shown in the following screenshot:
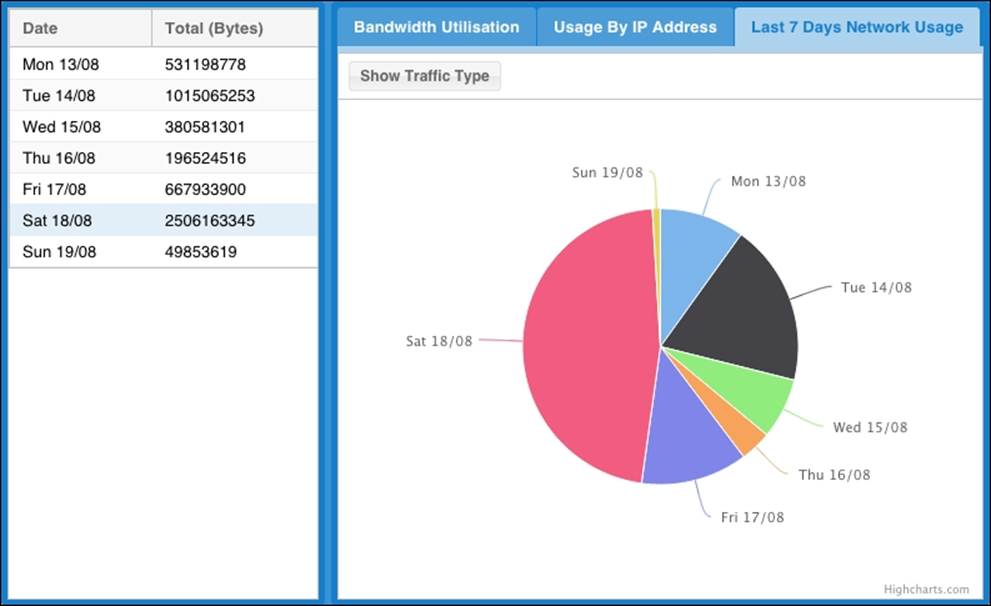
Let's see how this pie chart is implemented in detail. JsonStore is adjusted to return data in the following format:
{"data": [
{"date": "Mon 13/08", "type": "wan",
"bytes": 92959786, "color": "#8187ff" },
{"date": "Mon 13/08", "type": "lan",
"bytes": 438238992, "color": "#E066A3" },
{"date": "Tue 14/08", "type": "wan",
"bytes": 241585530, "color": "#8187ff" },
{"date":"Tue 14/08", "type": "lan",
"bytes": 773479723, "color": "#E066A3" },
.....
Then, we define the tab panel content, as follows:
items:[{
xtype: 'highchart',
id: 'chart3',
store: summStore,
series: [{
type: 'pie',
name: 'Total',
categorieField: 'date',
dataField: 'bytes',
totalDataField: true,
size: '60%',
showInLegend: true,
dataLabels: { enabled: true }
}],
chartConfig: {
chart: {...},
title: { text: null },
legend: { enabled: false }
}
}]
The series is set up as an inner series, hence the use of the totalDataField and dataField options to get the total bytes of "lan" and "wan" as the slice value for each 'host'. If we click on the Show Traffic Type button, then the pie chart is changed to a donut chart, as shown in the following screenshot:
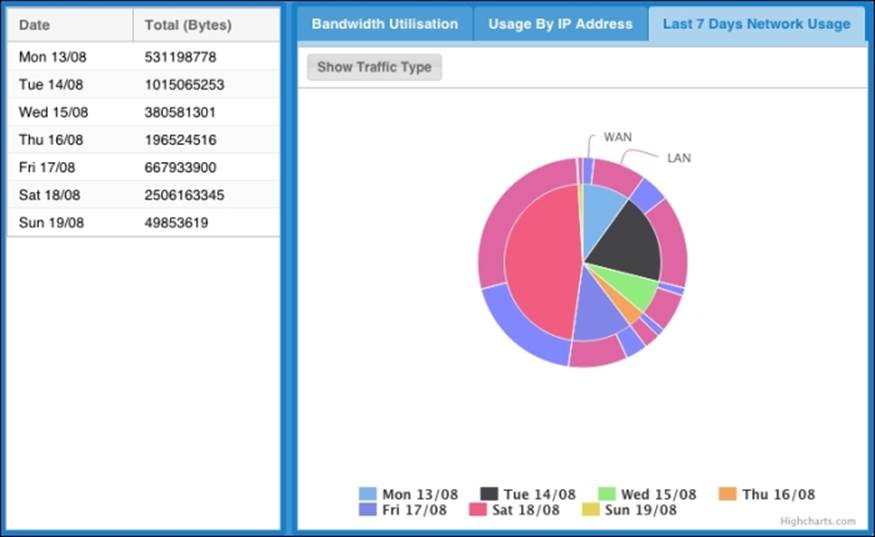
The original data labels in the first pie chart are replaced with items inside the legend box. An outer series is displayed with a fixed color scheme to show the LAN and WAN portions of traffic. The following is the Show Traffic Type button's button handler code:
toggleHandler: function(item, pressed) {
var config = Ext.getCmp('chart3').chartConfig;
if (pressed) {
Ext.getCmp('chart3').addSeries([{
type: 'pie',
center: [ '50%', '45%' ],
categorieField: 'type',
dataField: 'bytes',
colorField: 'color',
innerSize: '50%',
dataLabels: {
distance: 20,
formatter: function() {
if (this.point.x <= 1) {
return this.point.name.toUpperCase();
}
return null;
}
},
size: '60%'
}], true);
config.legend.enabled = true;
config.series[0].dataLabels.enabled = false;
config.series[0].size = '50%';
config.series[0].center = [ '50%', '45%' ];
} else {
Ext.getCmp('chart3').removeSerie(1);
config.legend.enabled = false;
config.series[0].dataLabels.enabled = true;
config.series[0].size = '60%';
config.series[0].center = [ '50%', '50%' ];
}
Ext.getCmp('chart3').draw();
}
If the toggle button is enabled, then we add an outer pie series (with the innerSize option) via the addSeries method. Moreover, we align the outer series accordingly with the traffic 'type', and so categorieField and dataField are assigned to 'type' and 'bytes'. Since more information is needed to display the second series, we set the inner series to a smaller size for more space. In order to only show the first two data labels in the outer series, we implement dataLabels.formatter to print the label when this.point.x is 0 and 1. After that, we disable the data labels by returning null in the formatter function. Finally, the draw method is used to reflect all the changes.
Displaying a context menu by clicking on a data point
For interactive applications, it would be handy to allow users to launch specific actions by clicking on a data point. To do that, we need to handle Highcharts' click events. Here, we create a simple menu for showing the difference between the selected point and the average value of the series. The following is the sample code:
point: {
events: {
click: function(evt) {
var menu =
Ext.create('Ext.menu.Menu', {
items: [{
text: 'Compare to Average Usage',
scope: this,
handler: function() {
var series = this.series,
yVal = this, avg = 0, msg = '';
Ext.each(this.series.data, function(point) {
avg += point.y;
});
avg /= this.series.data.length;
if (yVal > avg) {
msg =
Highcharts.numberFormat(yVal - avg) +
" above average (" +
Highcharts.numberFormat(avg) + ")";
} else {
msg =
Highcharts.numberFormat(avg - yVal) +
" below average (" +
Highcharts.numberFormat(avg) + ")";
}
Ext.Msg.alert('Info', msg);
}
}] // items:
});
menu.showAt(evt.point.pageX, evt.point.pageY);
}
}
}
First we create a simple Ext JS Menu object with the menu item Compare to Average Usage. The click handler is called with the mouse event parameter, evt, and then we obtain the mouse pointer location, pageX and pageY, and pass it to the menu object. As a result, the Ext JS menu appears next to the pointer after clicking on a data point.
The 'this' keyword in the click event handler refers to the selected point object. We then use the scope option to pass the Highcharts point object to the menu handler layer. Inside the handler, the 'this' keyword becomes the data point object instead of the Ext JS menu item. We extract the series data to calculate the average and compute the difference with the selected point value. Then, we display the message with the value. The following is the screenshot of the menu:
A commercial RIA with Highcharts – Profiler
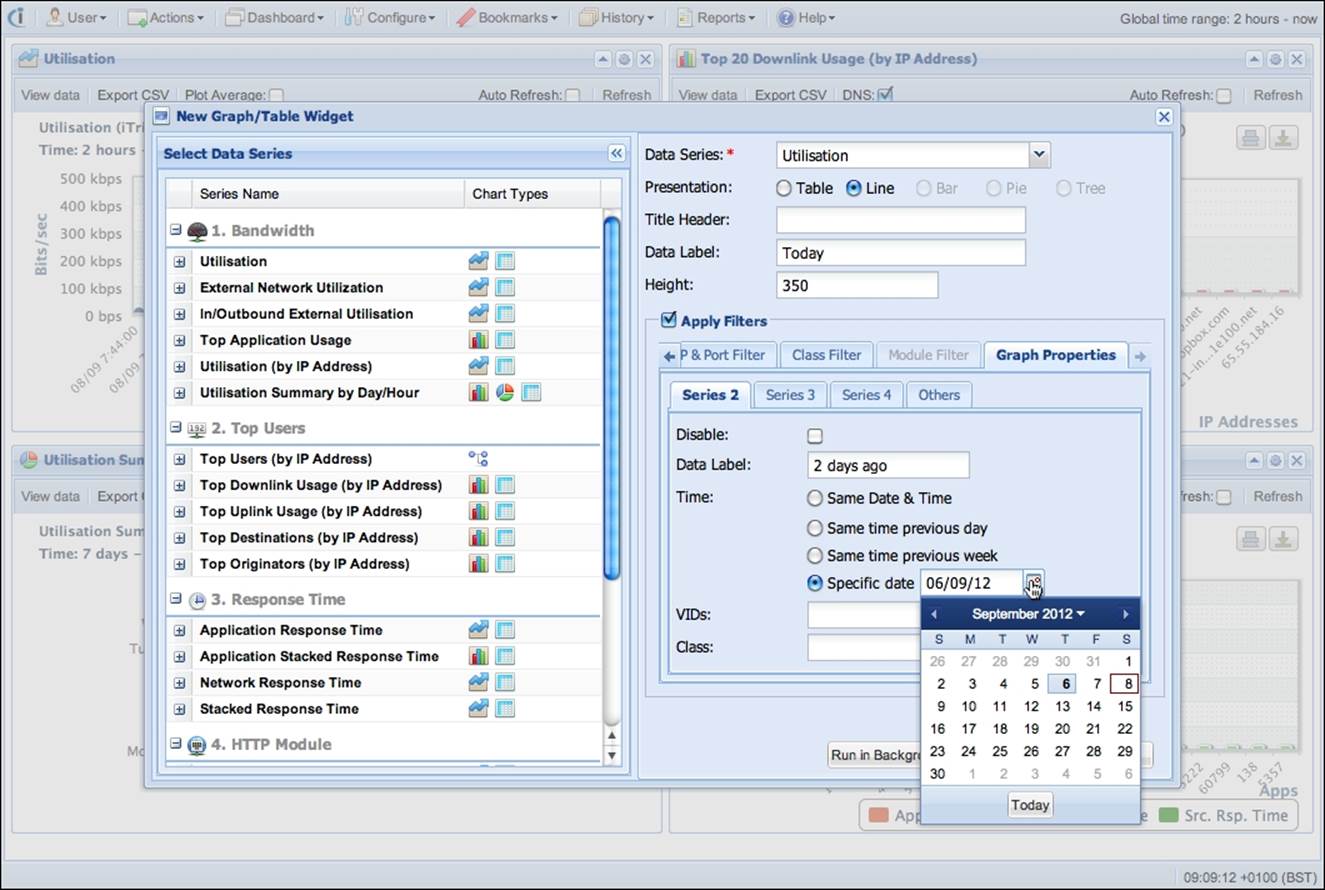
So far, we have demonstrated how Highcharts can be applied within the Ext JS framework. However, the demo itself seems rather shrink-wrapped for an RIA product. In this section, we will have a quick glance at a commercial application, Profiler, a tool for profiling companies network scenario developed by iTrinegy. Due to the nature of its business, a stack of diagnostic graphs is required for this type of application. The whole application is designed as a collection of portals for monitoring network traffic from multiple sites. Users can drill down from utilization graph to top downlink usage by IP address graph, modify filter properties to display relative data in multiple series, and so on.
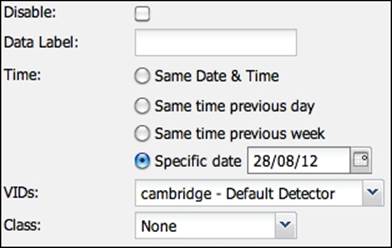
In order to fine-tune the profiling parameters and provide a portal interface, a framework offering dynamic and calibrated user interfaces is needed. For this reason, Ext JS is a suitable candidate, as it offers a rich set of professional looking widget components, and its cross-browser support makes building complicated RIA software manageable. The following is the interface for launching a bandwidth utilization report graph with specific parameters:
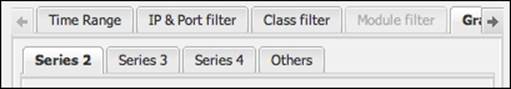
The Highcharts events are easily bound with Ext JS components so that a fully interactive navigation style becomes possible. For instance, if a peak appears on the Utilisation graph, the users can either click on the peak data point or highlight a region for a specific time range, then a context menu with a selection of network graphs pops up. This action means that we can append the selected time region to be part of the accumulated filters and navigate towards a specific graph. The following is a screenshot of the context menu, which shows up in one of the graphs:
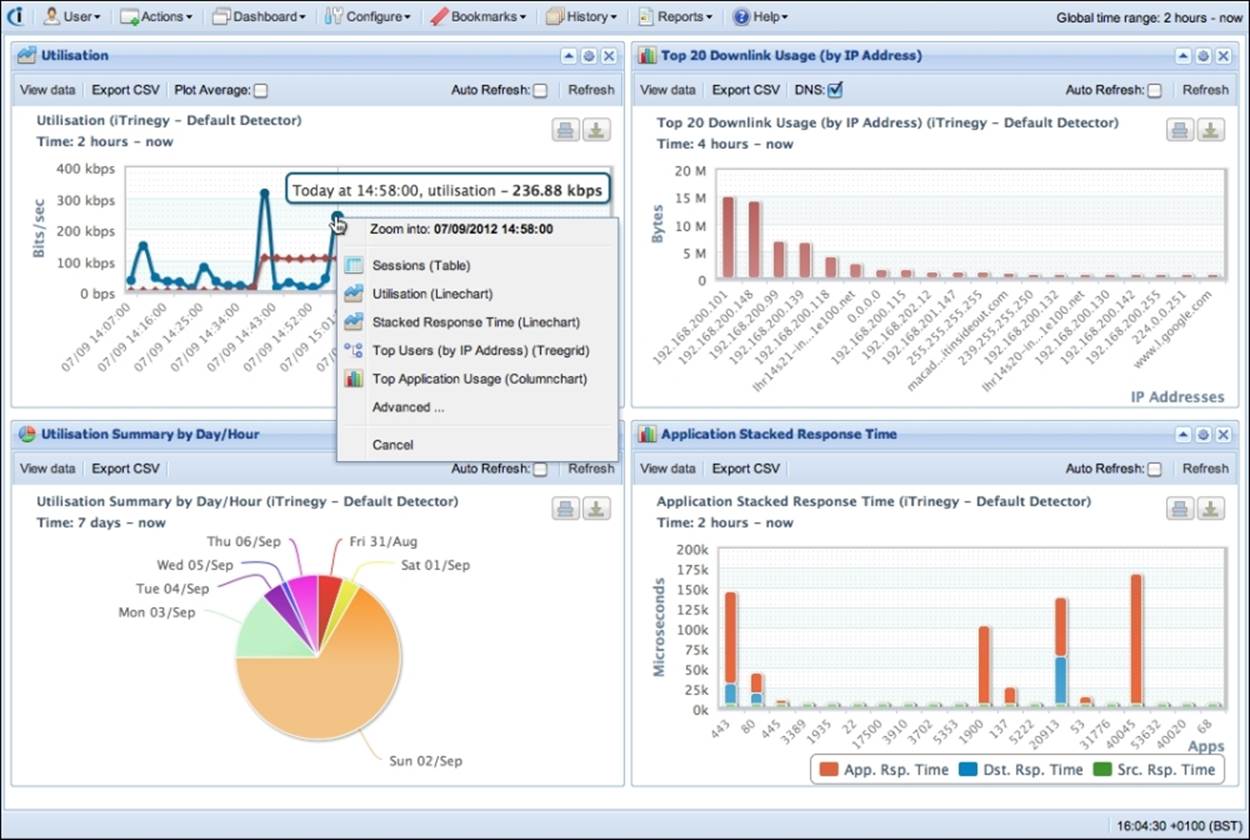
If we proceed by selecting the same graph again, Utilisation, it means we want to zoom into greater detail within the selected time region. This doesn't use the Highcharts default zoom action, which just stretches the graph series and redraws the axes. In fact, it launches another Ajax query with the selected time and returns graph data in finer granularity, so the peak in the graph can be diagnosed further. In other words, the application enables the user to visually filter through a sequence of different graphs. At the same time, the user gradually refines the filters in different dimensions. This process dissects the problem into the root cause in a prompt, intuitive, and effective fashion.
Summary
In this chapter, we learned the very basics of Ext JS, which is a framework for building Rich Internet Applications (RIAs). We looked at a quick introduction of a dozen Ext JS components that are likely to be used with the Highcharts extension for Ext JS. Then, we explored how to create a Highcharts component from an existing Highcharts configuration in a step-by-step approach. We looked into the small set of APIs that are provided by the extension module and built a simple application with network usage data. Finally, we took a brief look at Highcharts and Ext JS applied to a commercial network profiling application.
In the next chapter, we will explore how to run Highcharts on the server side.
All materials on the site are licensed Creative Commons Attribution-Sharealike 3.0 Unported CC BY-SA 3.0 & GNU Free Documentation License (GFDL)
If you are the copyright holder of any material contained on our site and intend to remove it, please contact our site administrator for approval.
© 2016-2026 All site design rights belong to S.Y.A.