Using JMP 12 (2015)
Chapter 12. JMP Preferences
The Preferences Window
JMP preferences enable you to specify general and specific settings and save the settings.
To change preferences
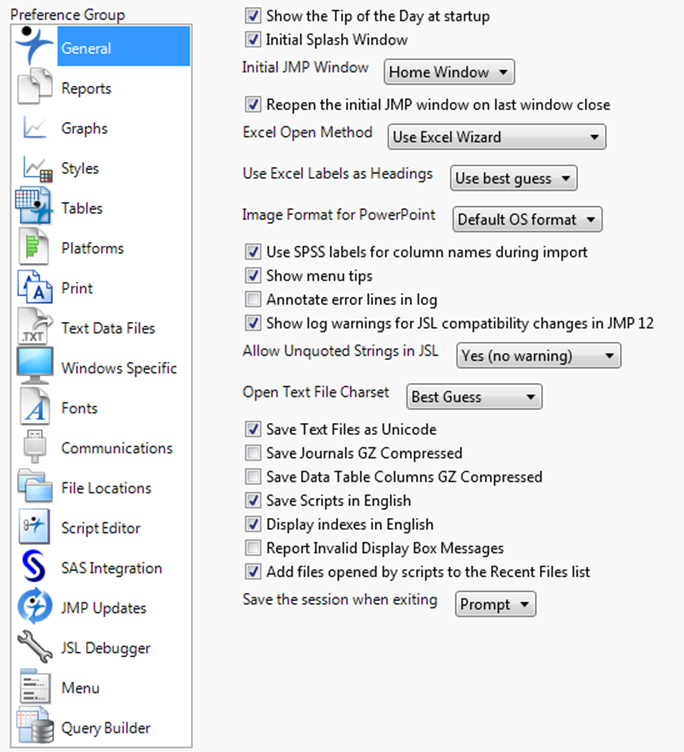
1.Select File > Preferences (Windows) or JMP > Preferences (Macintosh). The window in Figure 12.2 appears with the General preferences category showing.
2.Click a category and make selections. ClickApplyto see the results, and then clickOK.
Figure 12.1 The General Preferences Window (Windows)
Contents
Overview
General
Reports
Graphs
Styles
Tables
Platforms
Text Data Files
Windows Specific
Mac OS Settings
Fonts
Communications
File Locations
Script Editor
SAS Integration
JMP Updates
JSL Debugger
Menu Preferences
Query Builder
Overview
The Preferences command on the File menu (on the JMP menu on Macintosh) displays the Preferences window. See Figure 12.2. Each category is described in this chapter.
Changes that you make to preferences are stored in a version-specific JMP.PFS file located in one of the following folders:
C:\Users\<user name>\AppData\Roaming\SAS\JMP\<version number>
C:\Users\<user name>\AppData\Roaming\SAS\JMPPro\<version number>
C:\Users\<user name>\AppData\Roaming\SAS\JMPSW\<version number>
JMP looks for this file when you open the program and considers your changes to be the factory defaults. And all subsequent changes are stored in this file.
Note: The Reset to Defaults button is on every page of the preferences. Clicking the button on the General, Graphs, Reports, or Styles pages resets preferences on all of those pages. On the remaining pages, clicking the button resets preferences only on the current page.
General
The General page is initially displayed when you open Preferences. Most General preferences customize your JMP session at start-up. Others set preferences for file-handling and the general appearance of the JMP workspace.
Figure 12.2 General Preferences
|
Table 12.1 Preferences on the General Page |
|
|
Preference |
Description |
|
Show Tip of the Day at startup |
Select this option to show the Tip of the Day window at start-up. This option is selected by default. Clear this option to prevent the Tip of the Day window from appearing at start-up. |
|
Initial Splash Window |
Select this option to show the initial splash window at start-up. This option is selected by default. Clear this option to prevent the initial splash window from appearing at start-up. |
|
Initial JMP Starter Window |
(Macintosh only) Select this option to show the JMP Starter window every time you start JMP. This option is on by default. |
|
Initial JMP Window |
(Windows only) Select one of the listed windows as the default window. When JMP starts, this window appears. |
|
Home Window |
(Macintosh) Select this option to show the JMP Home window when you start JMP on Macintosh. |
|
Reopen the initial JMP window on last window close |
(Windows only) Select this option to open whichever window you have set as the Initial JMP Window when you close the last JMP window. If this option is turned off, closing the last JMP window also quits JMP. This option is on by default. |
|
Excel Open Method |
Select one of the options to determine how JMP imports Microsoft Excel worksheets. Excel Wizard Lets you preview a Microsoft Excel worksheet and modify the settings before importing the data. This is the default setting on Windows. On Macintosh, all .xlsx files open in the Excel Wizard. Open All Sheets Opens all worksheets in the workbook. On Macintosh, this preference is only for .xls files. Select Individual Worksheets Lets you select the worksheets that you want to open from a workbook. On Macintosh, this preference is only for .xls files. On Windows, you can also select File > Open, select the workbook, click the Open button arrow, and select Open Selected Worksheets or Use Excel Wizard. Note that when you open an Excel (.xls) file on Macintosh, an option to select worksheets is always available. |
|
Use Excel Labels as Headings |
Select this option to allow JMP to use Excel label names as column headings when importing Excel files. Available settings include: •Use best guess (default) •Always •Never |
|
Image Format for PowerPoint |
Select the file format for images exported from Microsoft PowerPoint. Windows does not support the native PDF graphics produced on Macintosh. Macintosh does not support the native EMF graphics produced on Windows. For cross-platform compatibility, specify the PNG or JPEG graphic format. Additional file formats are available through scripting. See the JSL Syntax Reference for details. |
|
Use SPSS Labels for column names during import |
Select this option to allow JMP to use SPSS label names as column headings when importing SPSS files. |
|
Show menu tips |
(Windows only) Select this option to see tooltips on main menu options and options in red triangle menus. This option is selected by default. |
|
Annotate error lines in log |
Select this option to print more informative error messages to the log. This option is deselected by default. |
|
Show log warnings for JSL compatibility changes in JMP 12 |
Select this option to print warnings about JSL compatibility to the log. |
|
Allow Unquoted Strings in JSL |
Select this option to print a warning to the log when a string value in a platform message is unquoted. Quoted string values are preferred over literal names. Yes (no warning) Allows unquoted string values and does not print a warning to the log. This option is selected by default. Yes (warning) Allows unquoted string values and prints a warning to the log. No Ignores the unquoted string value and does not print a warning to the log. |
|
Open Text File Charset |
Select one of the options from the menu to determine what character encoding JMP uses to open files. Best Guess is the default. |
|
Save Text Files as Unicode |
JMP uses the Unicode character set, which supports special characters such as é and ½. It saves files without special Unicode characters as plain text automatically. This option is selected by default. Clear this check box to save all your files as plain text. Note that versions of JMP earlier than 5.1.2 cannot read Unicode files. |
|
Save Journals GZ Compressed |
Select this option to save JMP journals in a compressed format to save disk space. Clear this option to save journals normally. This option is not selected by default. |
|
Save Data Table Columns GZ Compressed |
Select this option to allow JMP to save data tables using GZ compression. For backward compatibility, JMP 10 can read the compressed files but not save them. This option is not selected by default. |
|
Save Scripts in English |
Non-English versions of JMP can save scripts in either English or your local language. User-specified values (such as column names and text strings) in these scripts appear as they do in the data table. However, command words (such as Distribution and Set Value) appear in English rather than the local language in order for the script to run on JMP in English. JMP properly displays non-Roman characters (such as Japanese variable names) in JMP in English when the fonts support the necessary characters. Select this option to save scripts in English no matter what language JMP is using. Clear this option to save scripts in your local language. Note that these scripts run correctly only if JMP is running in the same language. This option is selected by default. |
|
Display indexes in English |
Shows sections of the JMP Indexes in English or the current locale’s language. The preference is selected by default. When you deselect it, the following items are displayed in the current locale’s language: •The message list for objects •The message list for display boxes. •The category list for JSL functions. Note: The description of each index item is always displayed in the current locale’s language. Examples are always in English. |
|
Report Invalid Display Box Messages |
Sends information about invalid display box messages to the log. This option is off by default. This option can be useful during script development, but can cause unwanted log messages for existing scripts. |
|
Add files opened by scripts to the Recent Files list |
(Windows only) Select this option to include files opened by the JSL Open() command in the Home Window Recent Files pane and the File > Recent Files list. |
|
Save the session when exiting |
This option enables you to save the state of the JMP window when existing JMP. When opening JMP, the saved state is restored including any open files and windows. |
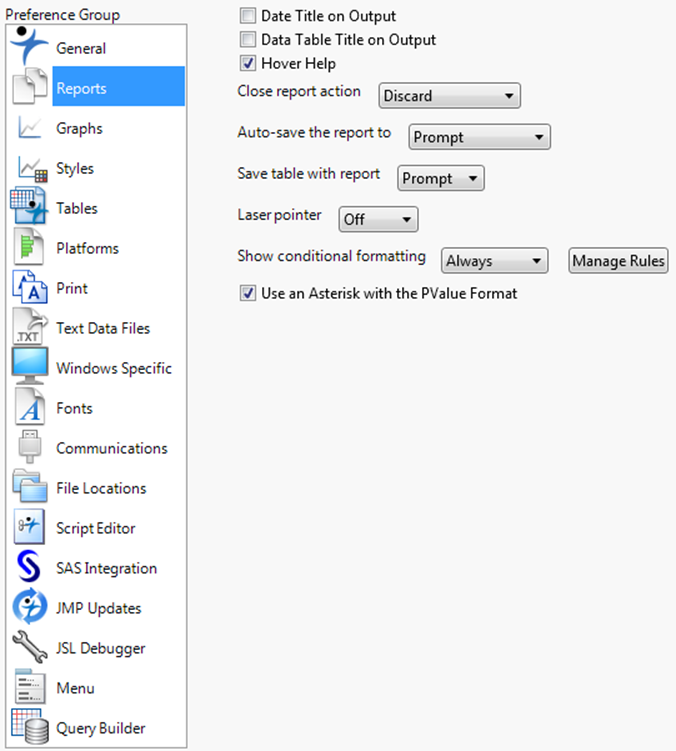
Reports
Report preferences customize the appearance of reports.
Figure 12.3 Reports Preferences
|
Table 12.2 Preferences on the Reports Page |
|
|
Preference |
Description |
|
Date Title on Output |
Select this option to display the date and time the analysis occurred in your report windows. This option is cleared by default. |
|
Data Table Title on Output |
Select this option to display the name of the data table and notes, if there are any, at the top of the report. This option is cleared by default. |
|
Hover Help |
On some numeric output, JMP provides tooltip-style help when you circle the mouse over a result. Select this option to see a tooltip where it is available. This option is selected by default. |
|
Close report action |
Select one of the options from the menu to determine what happens when you close a report: Prompt When you close a report, you are prompted to save it. Discard When you close a report, you are not prompted to save it, and the report is not saved. This is the default selection. Save / Auto-save When you close a report, it is automatically saved using the preference selected in the “Auto-save the report to” menu. |
|
Auto-save the report to |
Select one of the options from the menu to determine where a report is saved: Prompt When you close a report, you are prompted for a location to save it. This is the default selection. Data Table Script When you close a report, it is saved as a script in the open data table. Journal Script When you close a report, it is saved to a journal window. Log Window When you close a report, its script is written to the log window. |
|
Save table with report |
Select one of the options from the menu to determine how a table is saved to a report: Embed When you save a report, the table is embedded into the report. Choose this option if you want to share the report with others. The data table that is stored in the report is reopened (unchanged) each time the report is opened. If you make changes to the table, they are not saved into the report unless you re-save the report. Separate When you save a report, the table is referenced in the report. Prompt When you save a report, you are prompted to specify how to save the report: either to embed the table within the report, or to add a reference to the table in the report. Prompt is selected by default. |
|
Laser pointer |
JMP has a built-in laser pointer that enables you to visually emphasize parts of a report. It is off by default. To turn it on, select a color for the laser pointer from the menu. |
|
Show conditional formatting |
Conditionally formats the color of the text that represents the values. Available for correlation values, p-values, and factor pattern values. Select one of the options from the menu: Always Conditional formatting is always applied to correlation values, p-values, and factor pattern values. Screen Only Conditional formatting is always applied to correlation values, p-values, and factor pattern values. However, the conditional formatting does not show when the report is printed. Never Conditional formatting is never applied to correlation values, p-values, and factor pattern values. |
|
Manage Rules |
Creates custom conditional formatting rules that can be applied to numeric columns or matrices. See “Use Conditional Formatting” in the “JMP Platforms” chapter. Note: Verify the Use an Asterisk with the PValue Format preference to ensure asterisk (*) is or is not used for any p-value conditions. |
|
Use an Asterisk with the PValue Format |
Select this option to display an asterisk (*) next to significant p-values. This option is on by default. Note: Verify any conditional formatting rules for PValue to ensure asterisk (*) is not used for any defined conditions. |
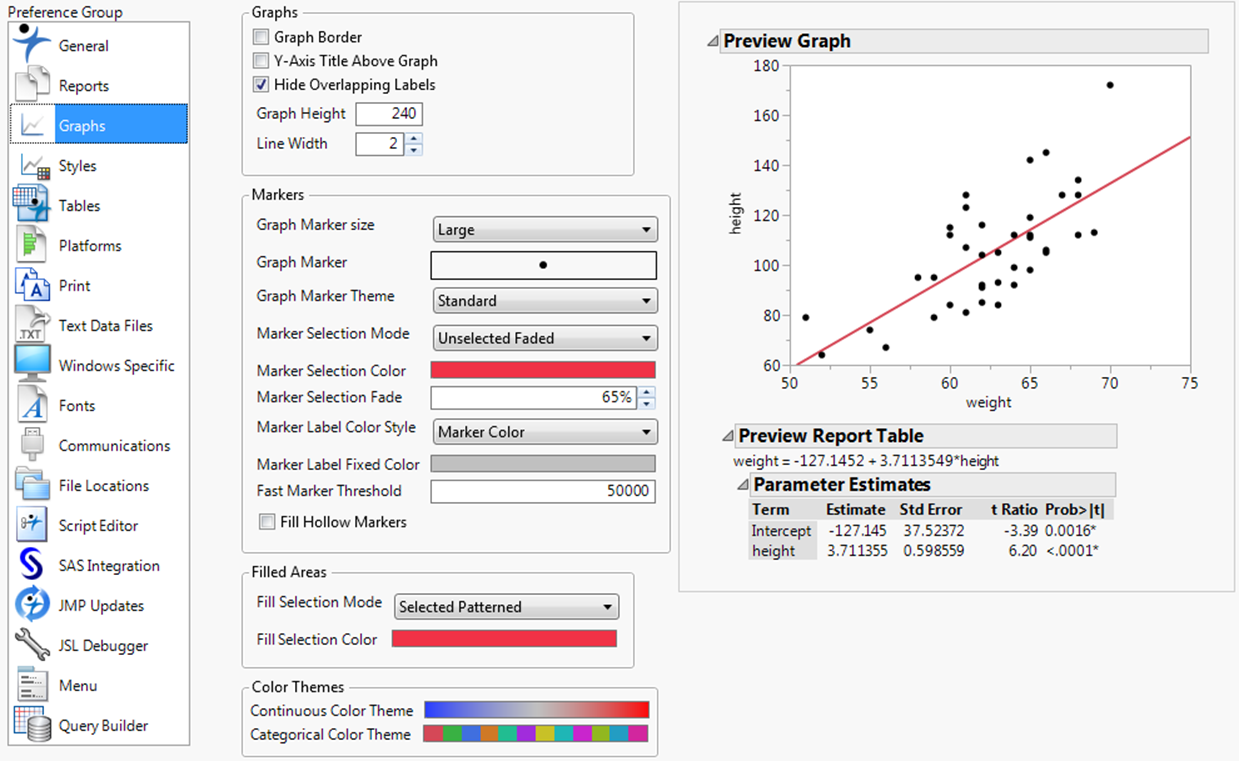
Graphs
Graph preferences customize the appearance of graphs. See “Styles” for additional details about configuring the appearance of graphs.
Figure 12.4 Graphs Preferences
|
Table 12.3 Preferences on the Graphs Page |
|
|
Preference |
Description |
|
Graph Border |
Draws a border line around the area of the graph. This option is not selected by default. |
|
Y-Axis Title Above Graph |
Shows the Title for the Y-Axis above the line rather than beside the line. This option is not selected by default. |
|
Hide Overlapping Labels |
Select this option to hide overlapping chart labels. This option is selected by default. |
|
Graph Height |
Sets the default height (in pixels) for a graph. Default is 240 pixels. |
|
Line Width |
Sets the default width (in pixels) for lines that pertain to content. Default is 2 pixels. Note: Does not apply to grid lines. |
|
Graph Marker size |
Select a default size for the markers in graphs: Dot, Small, Medium, Large, XL, XXL, or XXXL. |
|
Graph Marker |
Select a default marker shape for the markers in graphs. |
|
Graph Marker Theme |
Select a default theme for the markers in graphs when you mark by row or column. |
|
Marker Selection Mode |
Select the default formatting for selected markers. See “Marker Selection Modes” in the “JMP Platforms” chapter. |
|
Marker Selection Color |
When the Marker Selection Mode is Selected Same Color, this setting applies the specified color to selected markers. Default color is Red. |
|
Marker Selection Fade |
When the Marker Selection Mode is Unselected Faded, this setting fades the unselected markers by the specified amount (in percent). The default is 65%. |
|
Marker Label Color Style |
Select the color of the marker label that appears on a graph when you label a column in the data table. Marker Color The marker label is the same color as the marker. This option is selected by default. Marker Color Faded The marker label is faded according to the Marker Selection Fade preference. Fixed Color The marker label color is as specified. The Marker Label Fixed Color preference determines the color. |
|
Marker Label Fixed Color |
Select the color of fixed-color marker labels, an option that you select in the Marker Label Color Style preference. The default color is gray. |
|
Fast Marker Threshold |
When JMP refreshes a report window, it can draw markers on a plot at two different speeds: normal and fast. If JMP is in normal drawing mode, and the number of markers in a graph are more than the specified threshold number, JMP automatically switches to fast mode. Enter the number of markers that separate normal and fast mode. The default is 50,000. |
|
Fill Hollow Markers |
Select this option to apply an opaque background to markers. |
|
Fill Selection Mode |
Select the default highlight for selected rows in graphic objects: Selected Patterned A striped pattern (default) Selected Darkened A solid darker color Selected Outlined An outline Selected Same Color The Fill Selection Color in the preferences formats the selected object. |
|
Fill Selection Color |
Select the default color of selected rows in graphic objects when the Fill Selection Mode is “Selected Same Color”. The default color is red. |
|
Continuous Color Theme |
Select a default color theme for continuous data. The default theme is Blue to Gray to Red. See “Create Color Themes” in the “Enter and Edit Data” chapter. |
|
Categorical Color Theme |
Select a default color theme for categorical data. The default theme is JMP Default. See “Create Color Themes” in the “Enter and Edit Data” chapter. |
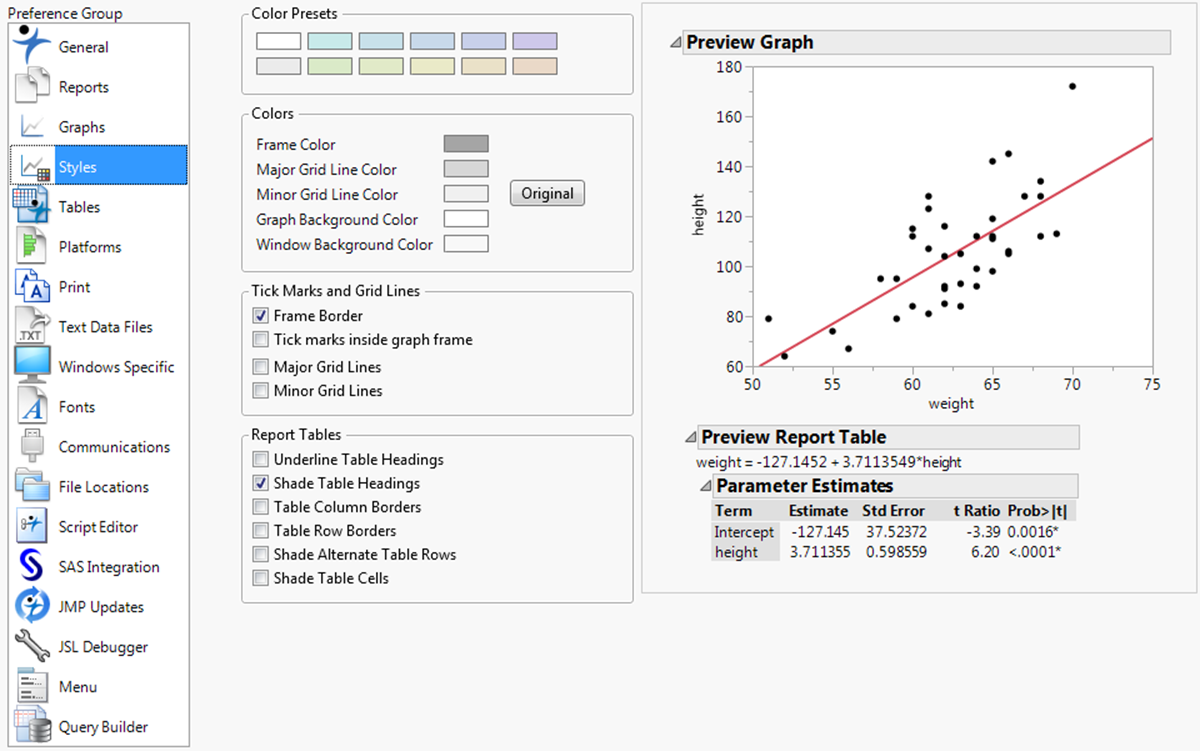
Styles
The Style pages enables you to customize colors, tick marks and grid lines, and report colors.
See “Graphs” for additional details about configuring the appearance of graphs.
Figure 12.5 Styles Preferences
|
Table 12.4 Preferences on the Styles Page |
|
|
Preference |
Description |
|
Color Presets |
The Color Presets provides a set of predefined colors for use in customizing the appearance of reports, graphs, charts, and so on Tints of the selected color are applied to the various elements. Note: The selected color is applied also to windows. |
|
Frame Color |
Defines the color applied to a graph frame and tick marks. Click to change the default color. |
|
Major Grid Line Color |
Defines the major grid line color. Click to change the default color. |
|
Minor Grid Line Color |
Defines the minor grid line color. Click to change the default color. |
|
Graph Background Color |
Click the color box to select a background color for all graphs. Click to change the default color. |
|
Window Background Color |
Click the color box to select a background color for all reports and data tables. Click to change the default color. |
|
Original |
Click to restore default color settings. |
|
Frame Border |
Shows borders only on the axes. |
|
Tick marks inside graph frame |
Shows axis tick marks inside the graph frame. |
|
Major Grid Lines |
Shows major grid lines on graphs. |
|
Minor Grid Lines |
Shows minor grid lines on graphs. |
|
Underline Table Headings |
Shows border under table headings. |
|
Shade Table Headings |
Shows table headings with shading. |
|
Table Column Borders |
Shows borders between table columns. |
|
Table Row Borders |
Shows borders between table rows. |
|
Shade Alternate Table Rows |
Shows alternate table rows with shading. |
|
Shade Table Cells |
Shows table cells with shading. |
|
Preview Graph |
Shows a preview area where you can see your changes before applying them. |
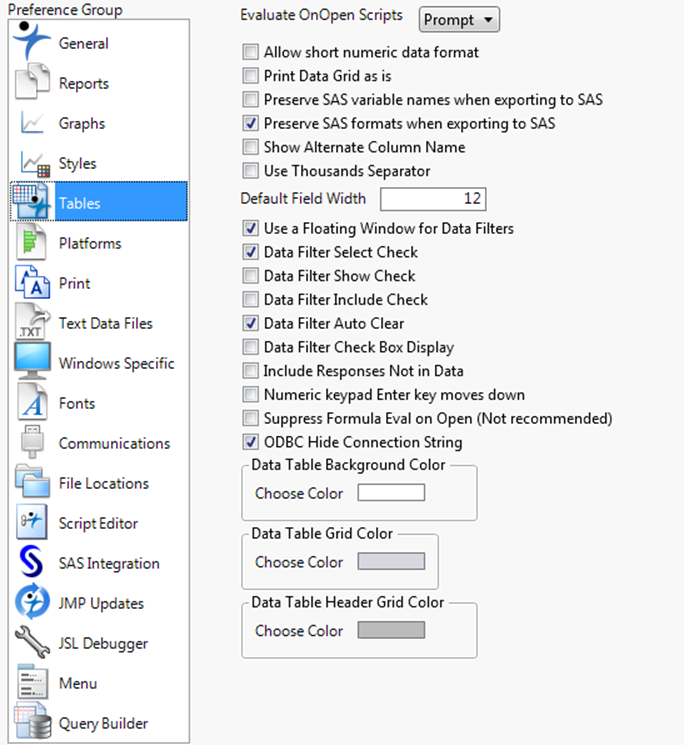
Tables
Table preferences customize JMP data tables, including formula handling, appearance, and compatibility with SAS data sets.
Figure 12.6 Tables Preferences
|
Table 12.5 Preferences on the Tables Page |
|
|
Preference |
Description |
|
Evaluate OnOpen Scripts |
If you save a script to a data table and name it OnOpen or On Open, JMP can automatically run the script whenever you open the data table. On Open scripts that execute other programs are never run. Prompt is selected by default. Your choice is remembered each time you open the data table in the current JMP session. Select Always to allow On Open scripts to run without prompting. Select Never to prevent On Open scripts from automatically running when a data table is opened. |
|
Allow short numeric data format |
JMP has the ability to store numeric data in as few as 8 bits (one byte). This option makes short-integer formats available to you when you select Cols > Column Info and assign a column a data type. When you use the correct short-integer format for your data, the numbers are not displayed differently, but the data table uses less disk space. See “The Short-Integer Format” in the “The Column Info Window” chapter. |
|
Print Data Grid as is |
Select this option to print the JMP data table as it appears on the screen. Clear this option to resize column widths to accommodate the content width. This option is cleared by default. |
|
Preserve SAS variable names when exporting to SAS |
Select this option to use variable names that are compliant with SAS when you export a JMP data table to a SAS data set. This option is cleared by default. |
|
Preserve SAS formats when exporting to SAS |
Select this option to use formats that are compliant with SAS when you export a JMP data table to a SAS data set. This option is selected by default. |
|
Show Alternate Column Name |
Select this option to show the name-label pair of the column. A column has name-label pair if the two column properties are defined and the Column Name equals one of the two properties. JMP recognizes the following name-label pairs: •SAS name-label pair, where the properties are “SAS Name” and “SAS Label” •SPSS name-label pair, where the properties are “SPSS Name” and “SPSS Label” •Short-long name-label pair, where the properties are “Short Name” and “Long Name” If the preference is checked, then both the name and label appear in the dialog. |
|
Use Thousands Separator |
Select this option to display numbers using the locale-appropriate thousands separator. This option is not selected by default. |
|
Default Field Width |
Changes the number of digits that appear in numeric columns. |
|
Use a Floating Window for Data Filters |
Select this option to float the Data Filter window on top of its associated data table. Clearing this option causes the Data Filter window to behave like any other window. This option is selected by default. |
|
Data Filter Select Check |
Select this option to show the Select check box in the Data Filter. This option is selected by default. |
|
Data Filter Show Check |
Select this option to show the Show check box in the Data Filter. This option is not selected by default. |
|
Data Filter Include Check |
Select this option to show the Include check box in the Data Filter. This option is not selected by default. |
|
Data Filter Auto Clear |
Select this option to show the Auto clear option in the Data Filter red triangle menu. This option is selected by default. |
|
Data Filter Check Box Display |
Select this option to always use check boxes for categorical filter columns. This option is not selected by default. |
|
Include Responses Not in Data |
(Categorical columns only) Shows all of the possible responses listed in value labels, even if the response is not present within the data. |
|
Numeric keypad Enter key moves down |
(Windows only) When a data table cell is selected and you press the Enter (or Return) key on the keyboard, the next table cell down is selected. Pressing either the TAB key or the ENTER key on the numeric keypad located to the right of the keyboard selects the next table cell to the right. Select this option to change the behavior of the ENTER key on the numeric keypad to select the next table cell down instead of to the right. This option is cleared by default. |
|
Suppress Formula Eval on Open |
Select this option to prevent columns formulas from being evaluated when you open data tables. Clear this option to allow formulas to be evaluated when you open data tables. This option is cleared by default. |
|
ODBC Hide Connection String |
Select this option to have the Open Database command hide the ODBC connection settings (that is, user ID and password). See the Scripting Guide book for additional information. |
|
Data Table Background Color |
Click the color box to select a background color for data tables. |
|
Data Table Grid Color |
Click the color box to select a color for the grid lines in a data table. |
|
Data Table Header Grid Color |
Click the color box to select a background color for the column names. |
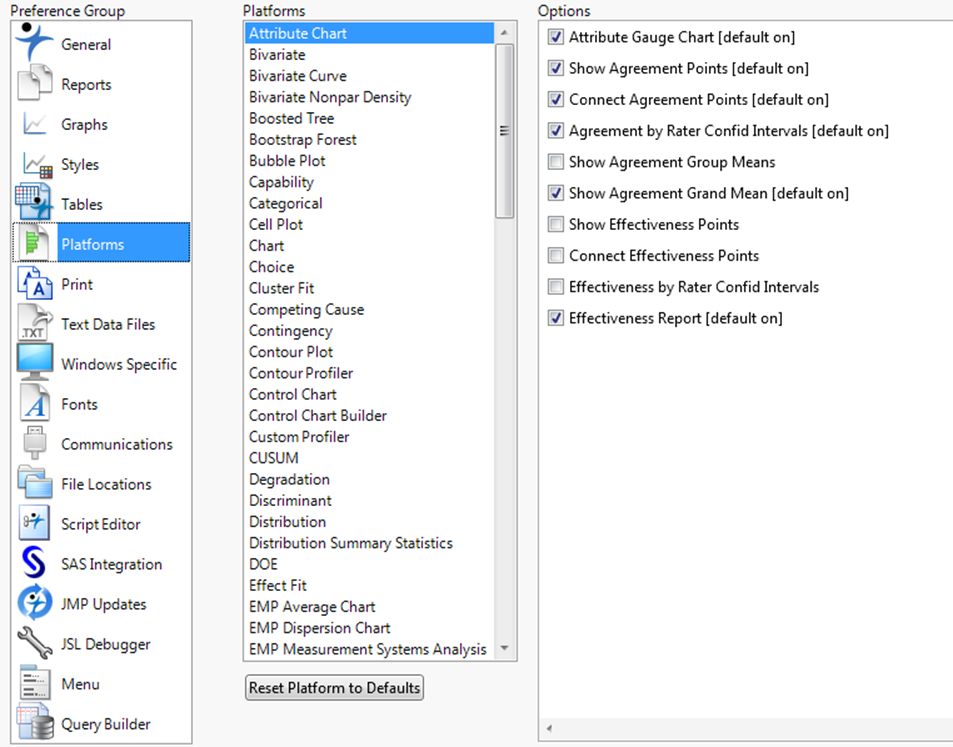
Platforms
Each analysis report has a variety of plot and table options that are shown by default. However, there might be additional options that you want to see each time you run a particular analysis. For example, a bivariate analysis shows a scatterplot by default, but you might also always want to see a linear fit each time. By selecting the Platforms option in the left panel of the Preferences window, you can set the default options for analyses. (Analyses are run by using platforms, such as the Bivariate platform. Thus, the name of this category is Platforms.)
Highlight an analysis name in the Platforms list. Its available options appear in the Options box with the defaults selected.
Click Reset Platform to Defaults to return the selected platform options to the default settings.
Click Reset to Defaults to return all platforms to their default settings.
Figure 12.7 Platforms Preferences
Graph Builder Preferences
There are a few preferences in Graph Builder that do not appear as options within JMP and cannot be scripted. Select Platforms, and then select Graph Builder from the list of platforms to see these preferences.
|
Table 12.6 Frequently Used Graph Builder Preferences |
|
|
Continuous Points Limit |
For continuous variables, this number indicates the number of rows at which the Points element is no longer shown initially. The default value is 1500. |
|
Continuous Alternate |
For continuous variables, indicates the element to display when there are more rows than the Points limit can handle. The default value is None, or you can select Contour (density contour). If None is selected, and the Continuous Smoother is turned off, Points appear when the limit is breached. |
|
Continuous Smoother |
For continuous variables, indicates whether the Continuous Smoother should appear. |
|
Categorical Points Limit |
For categorical variables, this number indicates the number of rows at which the Points element is no longer shown initially. The default value is 1500. |
|
Categorical Alternate |
For categorical variables, indicates the element to display when there are more rows than the Points limit can handle. The default value is Box Plot, or you can select from the following options: •None •Contour •Line •Smoother •Box Plot •Bar •Histogram |
|
Jitter |
Indicates whether jittering is on by default. Small spaces are displayed between the data points so that you can see each point more clearly. (Only applies to elements that support jittering.) |
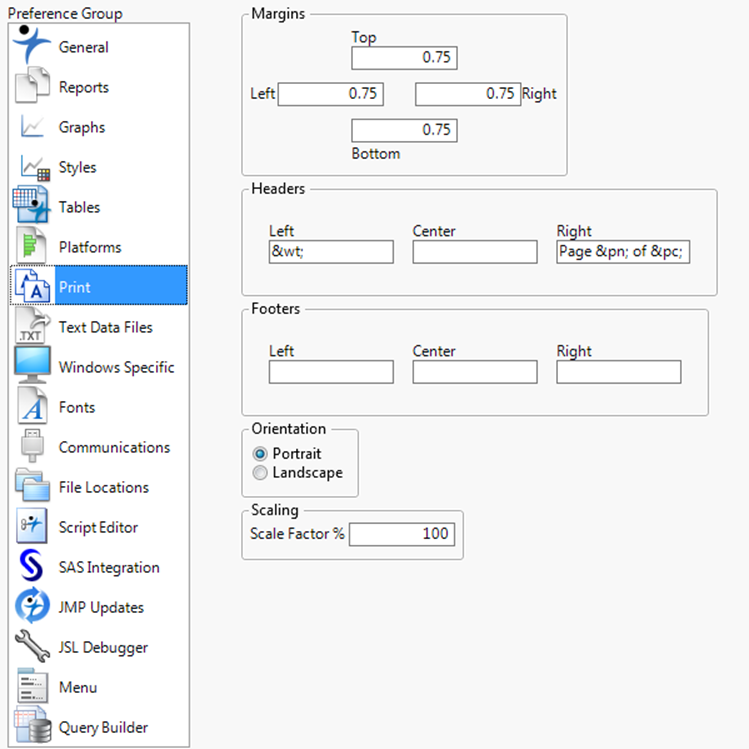
The Print pages enables you to configure default print settings such as, margins, header, and footers.
Figure 12.8 Print Preferences
|
Table 12.7 Preferences for Print Settings |
|
|
Preference |
Description |
|
Top (margin) |
Sets the print page’s top margin. The default value is 0.75 inches. |
|
Left (margin) |
Sets the print page’s left margin. The default value is 0.75 inches. |
|
Right (margin) |
Sets the print page’s right margin. The default value is 0.75 inches. |
|
Bottom (margin) |
Sets the print page’s bottom margin. The default value is 0.75 inches. |
|
Left (header) |
Sets the page’s left-side header information. The default value is &wt; (that is, the title). |
|
Center (header) |
Sets the page’s center header information. The default value is blank. |
|
Right (header) |
Sets the page’s right-side header information. The default value is Page &pn; of &pc; (that is, Page # of count). |
|
Left (footer) |
Sets the page’s left-side footer information. The default value is blank. |
|
Center (footer) |
Sets the page’s center footer information. The default value is blank. |
|
Right (footer) |
Sets the page’s right-side footer information. The default value is blank. |
|
Orientation |
Sets the page’s print orientation as either Portrait or Landscape. The default value is Portrait. |
|
Scale Factor |
Sets the page’s print scaling factor (in percent). The default value is 100%. |
Note: The code for printing the current date in the header or footer is &d.
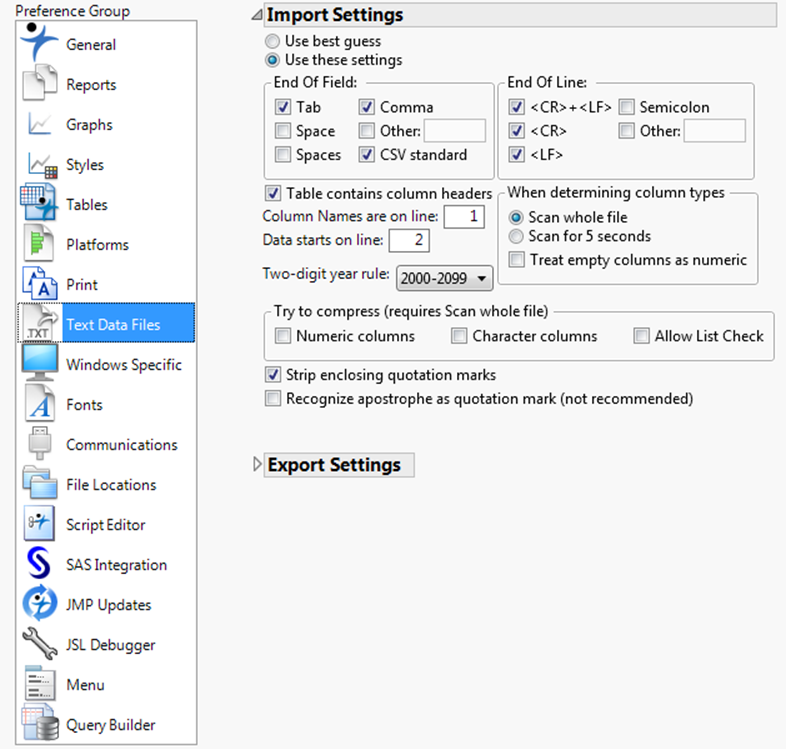
Text Data Files
Text Data File preferences customize the handling of importing and exporting text files.
Figure 12.9 Text Data Files Preferences
|
Table 12.8 Preferences for Import Settings for Text Files |
|
|
Preference |
Description |
|
Import Settings |
Select the strategy JMP uses to open text files. The default selection is Use these settings. In that case, you need to ensure that the settings reflect your text files. If you select Use Best Guess, JMP collects statistics in the text file on tabs, commas, blanks, and a few other characters and uses a rule-based system to decide what the file format might be. The rules try to make reasonable field widths and a reasonable number of fields per line. If your data format is too different from what the rules are designed to guess, JMP guesses incorrectly. In that case, either use the wizard or explicitly describe your data in these preference settings. |
|
End Of Field |
Select one or more characters to use as the delimiter that signifies the end of a field when importing text data. Select the Other option and enter a character to specify a delimiter that is not listed. |
|
End Of Line |
Select one or more characters to use as the delimiter that signifies the end of a line (row). Select the Other option and enter a character to specify a delimiter that is not listed. Note that if double-quotes are encountered when importing text data, the delimiter rules change to look for an end double-quote. Other text delimiters, including spaces, that are embedded within the quotes are ignored and treated as part of the text string. |
|
Table contains column headers |
Select this option if your text file contains columns names. If you select this option, enter the line number where the column names are located in the field next to Column Names are on line. |
|
Column Names are on line |
If you select the Table contains column headers option, enter the line number where the column names are located in this field. |
|
Data starts on line |
Enter the line number where the data starts in your text file. |
|
When determining column types |
Set how long JMP scans a text file to determine data types for the columns. Scan whole file is selected by default. Note that the Scan whole file option can cause importing a text file to be slow for large files. Consider selecting Scan for 5 seconds instead. When your text file contains columns of missing data, select Treat empty columns as numeric to import the columns as numeric rather than character. A period, Unicode dot, NaN, or a blank string are possible missing value indicators. This option is deselected by default. |
|
Two-digit year rule |
Select the rule that you want to use to import dates that have two-digit years instead of four. For details about these rules, see “Two-digit year rule” in the “Import Your Data” chapter. |
|
Try to compress |
Select the options used for compressing text files. Available options are: •Numeric columns •Character columns •Allow List Check Note: This feature requires a scan of the entire file. |
|
Strip enclosing quotation marks |
Select this option to remove quotation marks that enclose data in the text file. This option is selected by default. |
|
Recognize apostrophe as quotation mark |
Select this option to treat apostrophes as quotation marks and omit them. This option is off by default. Note: This option is not recommended unless your data comes from a nonstandard source that places apostrophes around data fields rather than quotation marks. |
|
Table 12.9 Preferences for Export Settings for Text Files |
|
|
Preference |
Description |
|
Export Table Headers |
Select this option to include column names when you save data tables as text files. |
|
End Of Field |
Select one or more characters to use as the delimiter signifying the end of a field when exporting text data. Select the Other option and enter a character to specify a delimiter that is not listed. |
|
End Of Line |
Select one or more characters to use as the delimiter that signifies the end of a line (row). Select the Other option and enter a character to specify a delimiter that is not listed. |
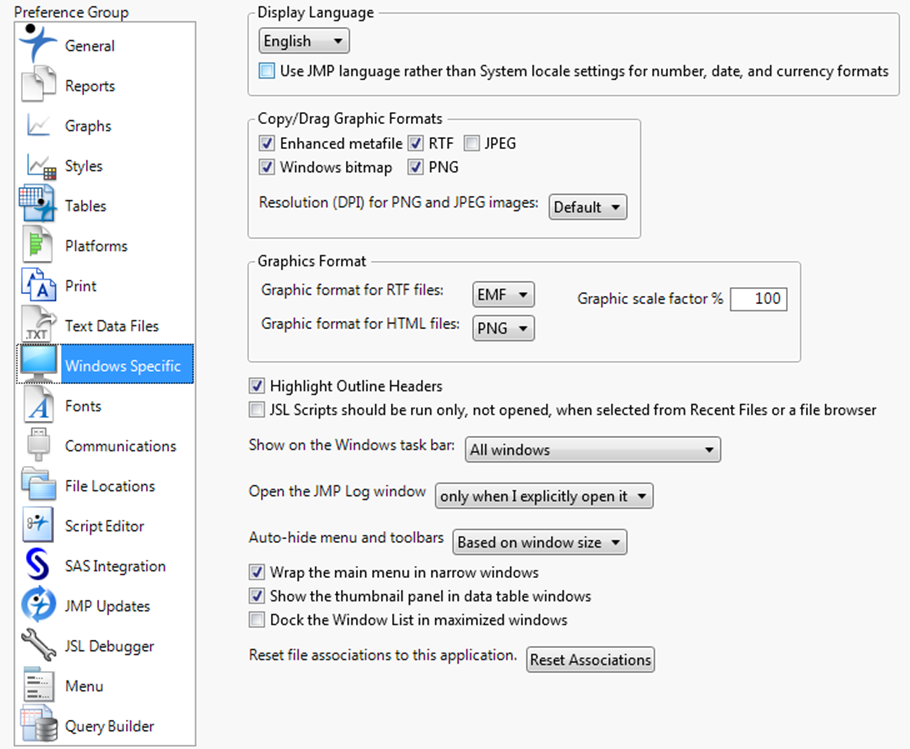
Windows Specific
These preferences customize settings for Windows computers, including auto-hiding menus and toolbars and selecting the default graphics format.
Figure 12.10 Windows Specific Preferences
|
Table 12.10 Windows Specific Preferences |
|
|
Preference |
Description |
|
Display Language |
Select the language in which you want to run JMP. The locale settings for your operating system normally determine settings for number, date, and currency formats. Select the option below the language menu to use that language to determine these formats instead. Text that appears in windows provided by the operating system (for example, File > Open), do not reflect changes in the language setting. Note: After changing the display language, close and restart JMP to have the language settings fully take effect. |
|
Copy/Drag Graphic Formats |
Select one or more graphic formats to use when copying and pasting (or dragging and dropping) graphics from JMP into other applications. |
|
Resolution (DPI) for PNG and JPEG Images |
Specify the DPI to be used when you copy a graphic format. Choose from the Default (96) or 300 DPI. 300 DPI is good for images that must be stretched, embedded in trade publications, or printed. However, this setting uses more memory and is slower to generate for large images. For details about specifying a higher DPI, see “Setting the Graphic DPI” in the “Save and Share Data” chapter. |
|
Graphics Formats |
Select the format to use for graphics when you save a JMP report as an RTF file or an HTML file. In the Graphic Scale Factor % box, enter the percentage at which you want graphics to appear in other applications. This feature might not work with all versions of your chosen application. |
|
Highlight Outline Headers |
Select this option to give title bars in the data table and report windows a light shade of gray. This option is selected by default. Clear this option to give the title bars a darker shade of gray. |
|
JSL Scripts should be run only, not opened, when selected from Recent Files or a file browser |
Select this option to force all scripts to run when opened. If this is selected, the script window for the script is not opened. This option is off by default. |
|
Show on the Windows task bar |
Select which JMP windows you would like displayed on the Windows task bar. The default selection is All Windows. You can also choose to display the main JMP window and data table windows. |
|
Open the JMP Log window |
Select one of the options to open the log only when text (such as error messages) is added to it or every time you start JMP. The default setting displays the log only when you open it. |
|
Auto-hide menu and toolbars |
Select the rule used to determine when menus and toolbars are hidden. The default value is Based on window size. |
|
Wrap the main menu in narrow windows |
Select this option to wrap the menu to additional lines when the window is narrower is than the menu. This option is on by default. |
|
Show the thumbnail panel in data table windows |
Select this option to show the thumbnail panel of reports at the bottom of a data table. This option is on by default. |
|
Dock the Window List in maximized windows |
Select this option to automatically dock the Window List if you maximize your JMP windows. This option is off by default. |
|
Reset file associations to this application |
Click this button to associate all JMP file types with the JMP version that you are running. |
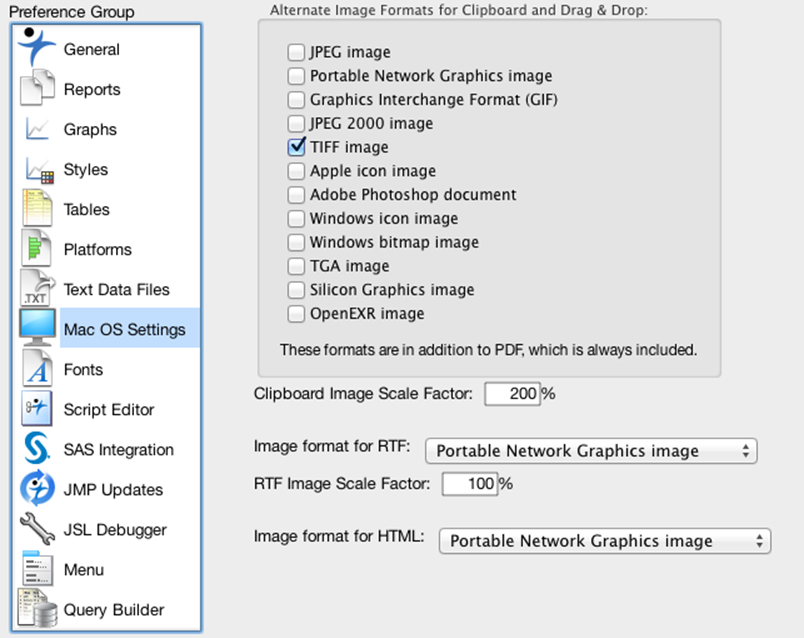
Mac OS Settings
Mac OS Settings preferences customize settings for Macintosh machines, including the graphics formats and file associations.
Figure 12.11 Mac OS Settings Preferences
|
Table 12.11 Macintosh OS Settings |
|
|
Preference |
Description |
|
Alternate Image Formats for Clipboard and Drag & Drop |
Select one or more graphic formats to use when copying and pasting (or dragging and dropping) graphics from JMP into other applications. |
|
Clipboard Image Scale Factor |
Enter the percentage at which you want graphics to appear in other applications. |
|
Image format for RTF |
Select the format to use for graphics when you save a JMP report as an RTF file. |
|
RTF Image Scale Factor |
Enter the percentage at which you want graphics to appear in RTF documents. |
|
Image format for HTML |
Select the format to use for graphics when you save a JMP report as an HTML file. |
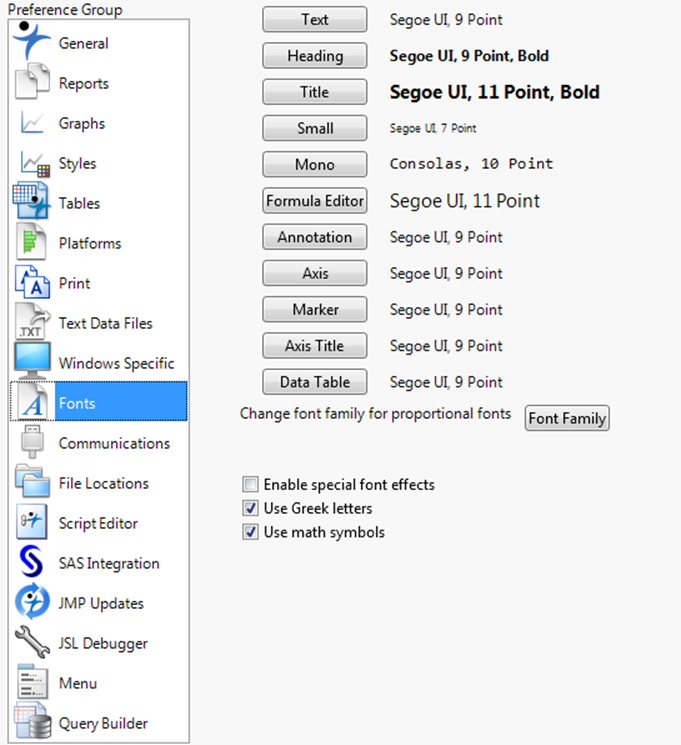
Fonts
Font preferences customize the appearance of reports, data tables, and scripts, including fonts, text size, and font style.
Figure 12.12 Fonts Preferences
|
Table 12.12 Preferences for Customizing Fonts |
|
|
Preference |
Description |
|
Text |
Sets the font for the text portion of a JMP analysis report. |
|
Heading |
Sets the font for the heading of columns in an analysis report and a data table. |
|
Title |
Sets the font for the title shown in all title bars. |
|
Small |
Sets the font for small text, which is used in the upper left corner of the data grid to show the number of columns and rows. |
|
Mono |
Sets the font used in the JMP Scripting Language (JSL) editor for script commands. |
|
Formula Editor |
Sets the font for the expressions entered into the Formula Editor. |
|
Annotation |
Sets the default font used in annotations. |
|
Axis |
Sets the font used for the axis tick labels. |
|
Marker |
Sets the font used for alphanumeric markers. |
|
Axis Title |
Sets the font for axis titles. |
|
Data Table |
Sets the font for displaying data in the data table. |
|
Font Family |
Select a proportional font. The font that you select is immediately applied to all settings except for Mono, which is used for scripts. |
|
Enable special font effects |
(Windows only) Select this option to enable setting Underline and Strikeout in the other font settings. This option is cleared by default. |
|
Use Greek letters |
Select this option to use Greek letters instead of spelling out Greek letters. (For example, π instead of pi.) This option is selected by default. |
|
Use math symbols |
Select this option to use math symbols instead of simple text representations of math symbols. (For example, ± instead of +/-) This option is selected by default. |
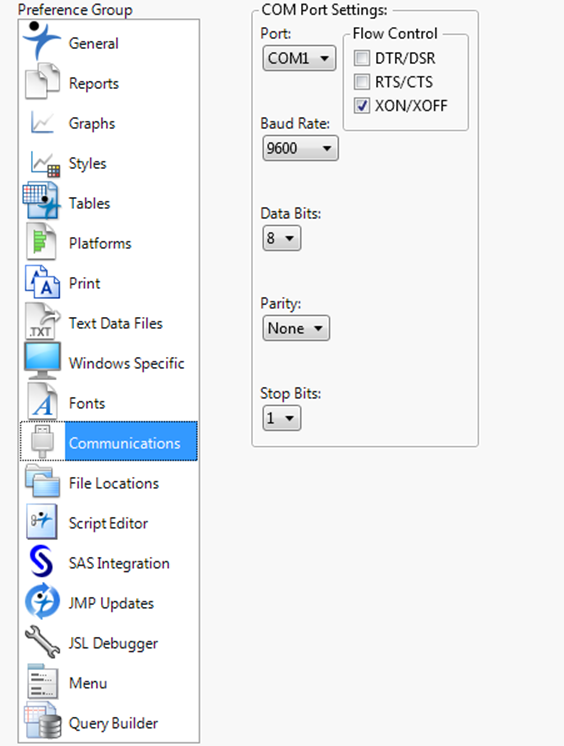
Communications
(Windows only) Communications preferences customize settings for reading data from an external source. These settings need to be specified only if you are using an instrument to do so.
Figure 12.13 Communications Preferences
|
Table 12.13 Preferences on the Communications Page |
|
|
Preference |
Description |
|
Port |
Select the port that your data source uses. |
|
Baud Rate |
Set the baud rate for your data source. |
|
Data Bits |
Set the number of data bits (7 or 8). |
|
Parity |
Set the parity bit. None is the default value. |
|
Stop Bits |
Set the stop bits (1 or 2). |
|
Flow Control |
Set the flow control. XON/XOFF is the default value. |
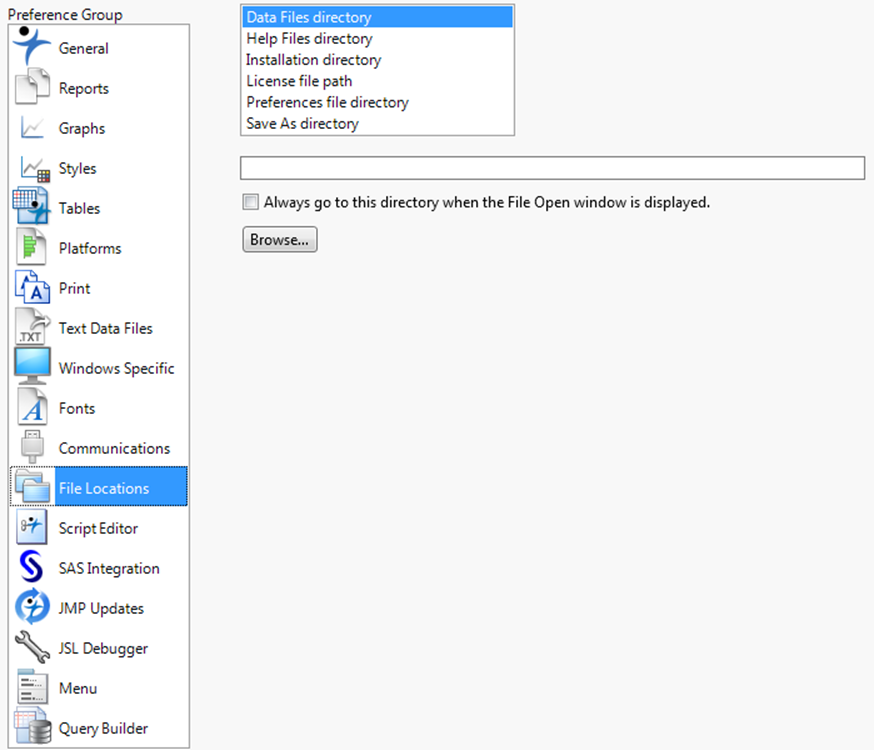
File Locations
(Windows only) File Locations preferences set the default locations of JMP system files. Usually, the files can stay where JMP installs them, and you do not have to change anything here. However, if you do move files, such as Help files, elsewhere, you should update the location here.
Figure 12.14 File Locations Preferences
|
Table 12.14 Preferences on the File Locations Page |
|
|
Preference |
Description |
|
Data Files directory |
Change the folder in which JMP looks for data files (for example, data tables). |
|
Help Files directory |
Change the folder in which JMP looks for Help files. |
|
Installation directory |
Change the JMP installation folder. |
|
License file path |
Change the folder in which JMP looks for your JMP License file. |
|
Preferences file directory |
Change the folder in which JMP looks for preference information. |
|
Save As directory |
Change the folder in which JMP saves data files when you select File > Save As. |
|
Always go to this directory when the File Open window is displayed |
Select to have JMP always use the selected path when you select File > Open. |
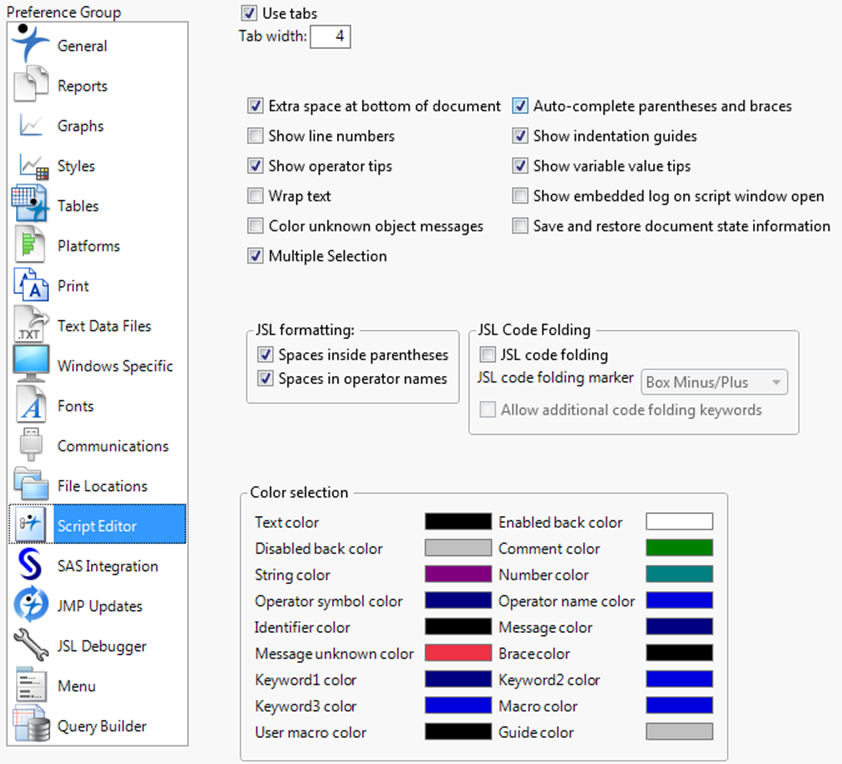
Script Editor
Script Editor preferences customize the appearance of the JSL Script Editor, such as tab width, syntax coloring, and tooltips.
Figure 12.15 Script Editor Preferences
|
Table 12.15 Preferences on the Script Editor Page |
|
|
Preference |
Description |
|
Use tabs |
Select this option to enable tabs in your scripts. This option is selected by default. Clear this option to replace any tab that you type with spaces. |
|
Tab width |
Enter how many spaces a tab should indent. If you have disabled tabs, any tab you type is replaced with the number of spaces specified. The default value is 4. |
|
Extra space at bottom of document |
Select this option to enable scrolling up from the last blank lines of a script. This option is selected by default on Windows and deselected on Macintosh. |
|
Auto-complete parentheses and braces |
Select this option to enable the script editor to automatically add closing parentheses, square brackets, and curly braces when you type an opening one. This option is selected by default. |
|
Show line numbers |
Select this option to show the line numbers on the left side of the script editor. This option is off by default. |
|
Show indentation guides |
Select this option to see faint vertical lines that mark indention. This option is selected by default. |
|
Show operator tips |
Select this option to see tooltips for JSL operators. This option is selected by default. |
|
Show variable value tips |
Select this option to see tooltips for variable values. This option is selected by default. |
|
Wrap Text |
Select this option to always wrap text in the script editor. This option is off by default. |
|
Show embedded log on script window open |
Select this option to have an embedded log window appear in the scripting window when editing or running scripts. This option is off default. |
|
Color unknown object messages |
Select this option to always show unknown object messages in color. Unknown object messages will appear in the color specified by “Message unknown color”. This option is off by default. |
|
Save and restore document state information |
Saves the state of collapsed and expanded code, and restores that state when the script is reopened. |
|
Spaces inside parentheses |
Select this option to cause the script editor to add spaces between parentheses, brackets, and braces and their contents for automatically formatted scripts. This is on by default. |
|
Spaces in operator names |
Select this option to cause the script editor to add spaces between words within operator names. For example, turning on this option results in New Window instead of NewWindow. This option is selected by default. |
|
JSL code folding |
Select this option to use code folding markers in the script editor, which mark the opening and closing of user defined functions and Expr() blocks. You can expand and collapse these marked blocks of code. This option is off by default. You can also choose the appearance of the marker using the JSL code folding marker menu. |
|
Allow additional code folding keywords |
Select this option to enable using additional keywords for folding markers in the script editor. See the Scripting Guide book for details. |
|
Color selection |
To set your own color for any of the listed types, click the color box and select your color. |
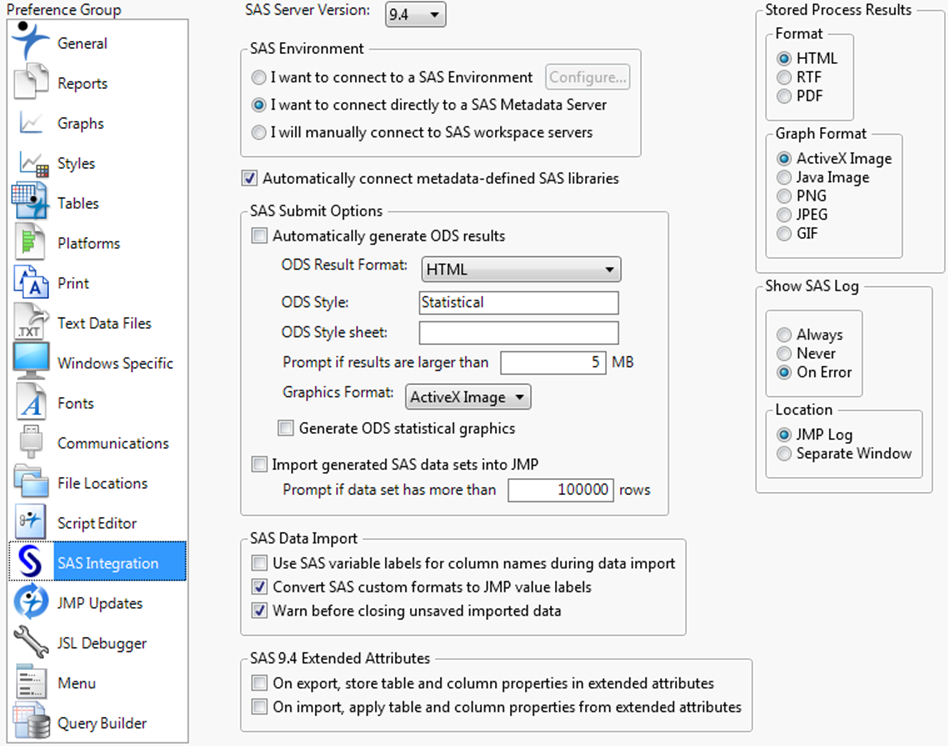
SAS Integration
SAS Integration preferences customize the default settings for working with SAS servers. For details about using the SAS Integration capabilities, see “Import Data from SAS” in the “Import Your Data” chapter.
Note: The SAS Environment options appear after you select SAS 9.3 or 9.4 from the SAS Server Version list.
Figure 12.16 SAS Integration Preferences
|
Table 12.16 Preferences on the SAS Integration Page |
|
|
Preference |
Description |
|
SAS Server Version |
Select the default version for the SAS Server. This can also be changed in the Server Connections window. (See “Connect to a SAS Metadata Server” in the “Import Your Data” chapter.) This option does not apply when connecting to local SAS on Windows. |
|
I want to connect to a SAS Environment |
Select this option to always connect to a SAS Environment and click Configure to configure the URL of the location. |
|
I want to connect to a SAS Metadata Server |
Select this option to always connect to a SAS Metadata Server. This option is selected by default. Clear this option if you do not have a SAS Metadata Server available, and you connect directly to SAS Workspace Servers instead. |
|
I will manually connect to SAS workspace servers |
Select this option to manually connect to a SAS workspace server. |
|
Automatically connect metadata-defined SAS libraries |
Select this option to connect to metadata-defined SAS libraries automatically when you connect to a SAS Workspace Server. Selected by default. When the Workspace Server contains a large number of metadata-defined SAS libraries, deselect this option to speed up your connection to the server. |
|
Automatically generate ODS results |
Select this option to generate ODS (operational data store) results. This option is cleared by default. |
|
ODS Result Format |
Select the format for ODS reports. The default value is HTML. |
|
ODS Style |
Enter the style name for ODS reports. The default value is Statistical. |
|
ODS Style sheet |
Enter the style sheet name for ODS reports. |
|
Prompt if results are larger than __ MB |
Enter the number of MB that triggers a prompt for you to continue or cancel the operation. The default value is 5. |
|
Graphics Format |
Select the format for graphics for ODS reports. |
|
Generate ODS statistical graphics |
Select this option to include statistical graphics in the ODS reports. |
|
Import generated SAS data sets into JMP |
Select this option to import any generated data sets into JMP automatically. |
|
Prompt if data set has more than __ rows |
Enter the number of rows that triggers a prompt for you to continue or cancel the operation. The default value is 100,000. |
|
Use SAS variable labels for column names during data import |
Select this option to use the column labels in the SAS data set as the JMP data table column names when importing a SAS data set into a JMP data table. |
|
Convert SAS custom formats to JMP value labels |
Select this option to use the information in the SAS column formats to set JMP value labels when importing a SAS data set into a JMP data table. |
|
Warn before closing unsaved imported data |
Select this option to trigger a prompt to save any SAS data sets that you imported into JMP and have not saved before closing. |
|
On export, store table and column properties in extended attributes |
Select to allow extended attribute support during SAS 9.4 data export. This option is not selected by default. |
|
On import, apply table and column properties from extended attributes |
Select to allow extended attribute support during SAS 9.4 data import. This option is not selected by default. |
|
Stored Process Results: Format |
Select a report format: HTML, RTF, or PDF. |
|
Stored Process Results: Graph Format |
Select a graph format: ActiveX Image (only available on a SAS server that runs on Windows), Java Image, PNG, JPEG, or GIF. |
|
Show SAS Log |
Select Always, Never, or On Error to set when the SAS log is displayed |
|
Location |
Select the location for SAS log information: within the JMP log window, or in a separate SAS log window. |
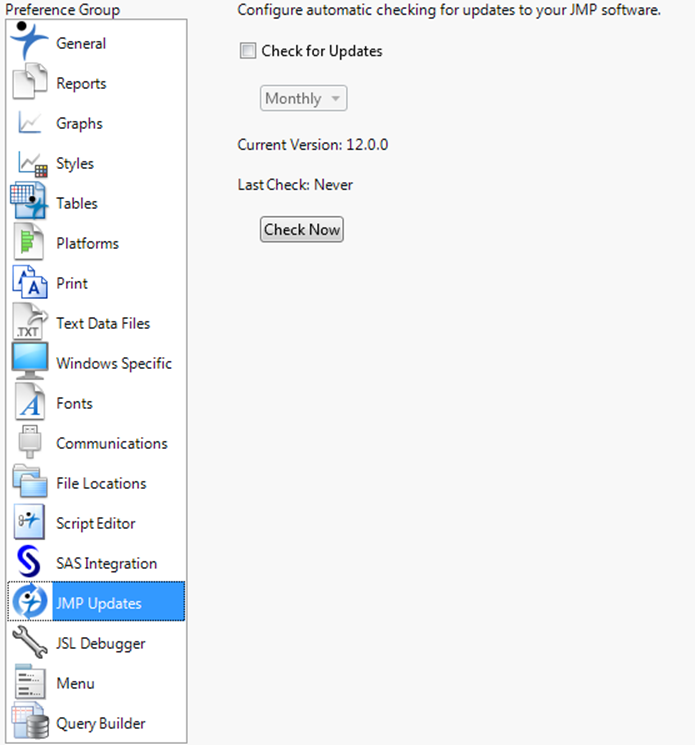
JMP Updates
The JMP Update preferences show you what version of JMP you currently have, the last time it was updated, and whether and how often JMP checks automatically for updates.
Figure 12.17 JMP Updates Preferences
|
Table 12.17 Preferences on the JMP Updates Page |
|
|
Preference |
Description |
|
Check for Updates |
Select this option to have JMP automatically check for updates. If this option is selected, specify how often the check is performed: Daily, Weekly, or Monthly. |
|
Current Version |
What version of JMP you are currently running. |
|
Last Check |
The last time you checked for an update. |
|
Check Now |
Click this button to perform an update check immediately. |
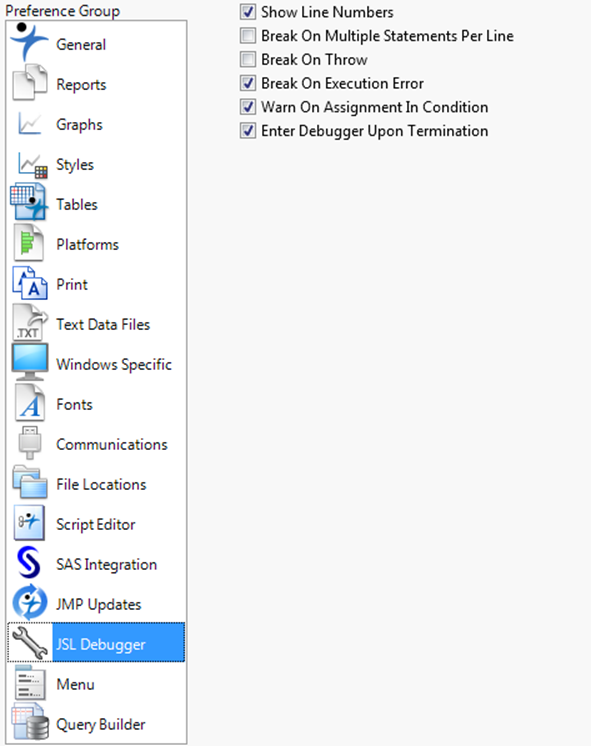
JSL Debugger
The JSL Debugger preferences let you show or hide line numbers, create breaks in scripts, and show warnings.
Figure 12.18 JSL Debugger Preferences
|
Table 12.18 Preferences on the JSL Debugger Page |
|
|
Preference |
Description |
|
Show Line Numbers |
Shows or hides the line numbers for the script in the debugger. The default value is selected. |
|
Break on Multiple Statements Per Line |
Stops executing the script between each expression in a single line. The default value is deselected. |
|
Break On Throw |
Breaks when an exception error occurs in a Try() function. For example, the exception error in the Try() function is thrown by a Throw() function. The Debugger breaks on theThrow() instead of continuing through the rest of the codes. This lets you identify where the problem occurred in the script and then return to debugging. The default value is deselected. |
|
Break On Execution Error |
Stops executing the script when the error occurs rather than closing the Debugger. The default value is selected. |
|
Warn On Assignment In Condition |
Select to show a warning when you enter an assignment expression for the breakpoint condition. For example, if you specify x = 1 instead of x == 1 in the breakpoint condition, you are prompted to verify the specification. The default value is selected. |
|
Enter Debugger Upon Termination |
Select to enter the Debugger when JMP terminates. The default value is selected. |
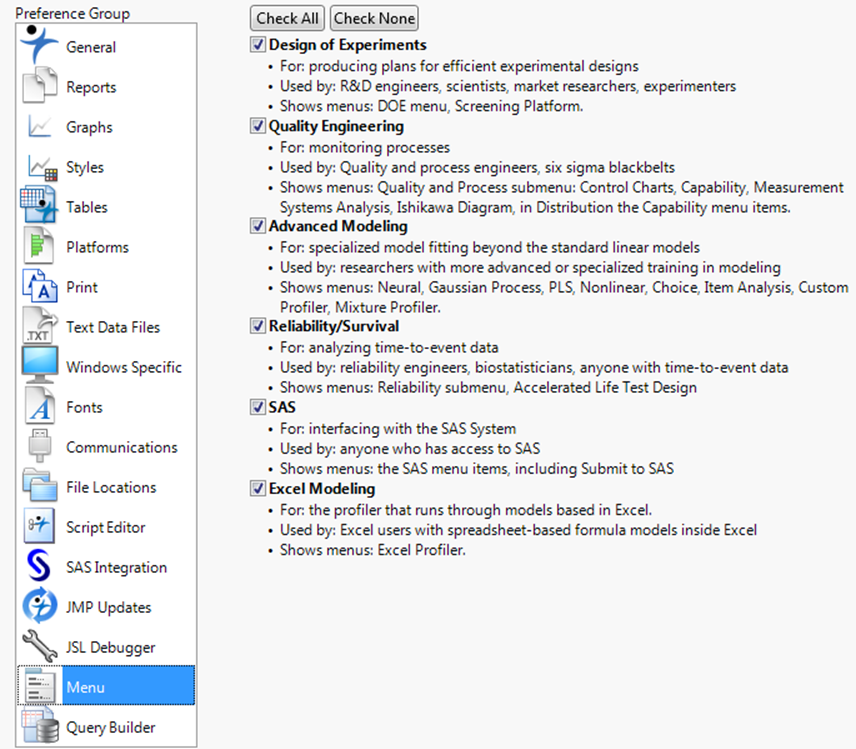
Menu Preferences
The Menu preferences show and hide menus based on how you use JMP. This gives you fewer menu items to browse through and streamlines the JMP interface. For example, if you never design experiments, deselect Design of Experiments. Other menus are grouped by area of interest, such as quality engineering, advanced modeling, reliability and survival, SAS options and Excel Modeling.
Figure 12.19 Menu Preferences
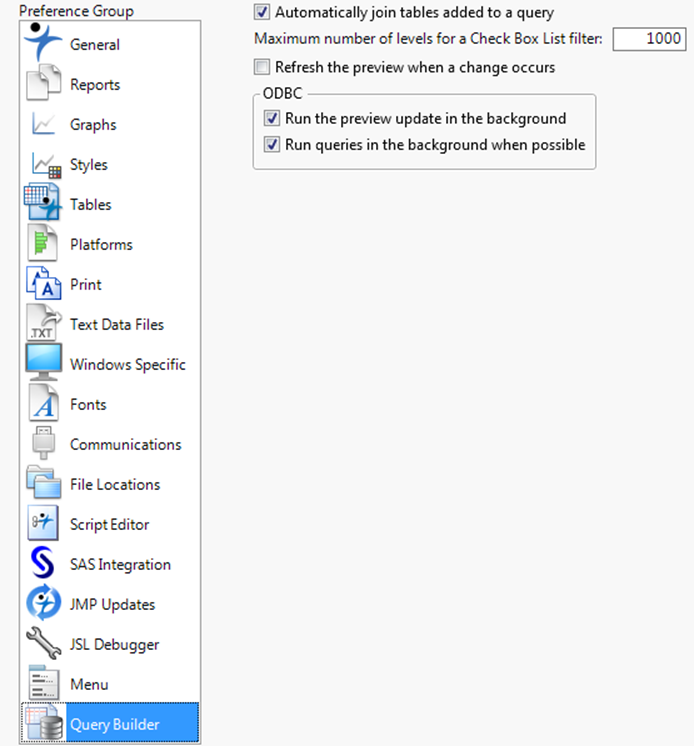
Query Builder
The Query Builder preferences customize SQL queries that you perform in Query Builder.
Figure 12.20 Query Builder Preferences
|
Table 12.19 Preferences on the Query Builder Page |
|
|
Preference |
Description |
|
Automatically join tables added to a query |
Automatically joins database tables in Query Builder based on keys and common column names. This option is selected by default. Deselect this option to prevent memory issues with large databases. |
|
Maximum number of levels for a Check Box List filter |
Specifies whether the filter for a categorical variable is added as a Check Box List filter. By default, when you add a categorical variable that has more than 1,000 levels, the filter is added as a Like or Not Like filter. You can change the filter to a Check Box List in Query Builder. |
|
Refresh the preview when a change occurs |
Updates the data view on the Query Preview tab when a change occurs. This option is selected by default. |
|
Run the preview update in the background |
Updates the data view Query Preview tab without displaying the status so that you can continue to work while the queries run. This option is selected by default. |
|
Run queries in the background when possible |
Runs database queries without displaying the status so that you that can continue to work Query Builder while the queries run. This option is selected by default. |
All materials on the site are licensed Creative Commons Attribution-Sharealike 3.0 Unported CC BY-SA 3.0 & GNU Free Documentation License (GFDL)
If you are the copyright holder of any material contained on our site and intend to remove it, please contact our site administrator for approval.
© 2016-2026 All site design rights belong to S.Y.A.