Pentaho Analytics for MongoDB (2014)
Chapter 5. Modifying and Enhancing Instaview Metadata
With Instaview, you can easily access, transform, and visualize data without the deep technical experience needed to stage data and design analytics solutions. The Instaview build process automatically creates a data transformation, metadata layer, and data cache, as seen in the previous chapter. This chapter shows readers the Model Editor perspective to modify and enhance the generated metadata model saved inside Instaview. These enhancements will make the data models more accurate, useful, and intuitive for your analytics users.
The following are the topics that we will cover in this chapter:
· Model design with dimensions and measures
· Modifying measures and dimensions
· Creating a new analysis view
By the end of this chapter, you will have an updated metadata model to better reflect the business requirements.
Model design with dimensions and measures
Instaview metadata is made up of measures and dimensions. A measure is a standard numerical unit used to express the size, amount, or degree of something. As numeric data elements, measures are aggregated at query time by each dimension defined in the metadata. For example, the total volume of shares traded in the stock market in the history represents a single measure with a large, aggregated value in units. That summarized measure value is not very useful for investors unless the dataset also contains dimensionality.
The total volume of shares traded for Google stock (GOOG) on October 18, 2013, is a more meaningful measure value. Dimensions such as stock symbol and time add context to the measure of volume of shares. Dimensional data becomes powerful for business users when modeled correctly with multiple dimensions and measures to form a multidimensional model for analysis.
In our sample clickstream data, event dimensions provide context to the event measures. When dimensional context is applied to the event measures, we can answer questions such as: who performed the event as indicated by ip_address, what type of event is indicated by the event, and when did the event occur as indicated by date_session. The dimensional structure is defined by the available fields from the connection query. We can even combine multiple fields into levels to form dimension hierarchies. Hierarchies allow users to drill down each level in the hierarchy to the lowest level defined in the dimension. For example, a typical geography dimension would contain four levels in the following order from highest to lowest: country, state, city, and postal code. This hierarchy allows users to summarize revenue, for example, by country and then drill down to the hierarchy to postal code. By default, every dimension contains at least one hierarchy and one level; however, a single dimension can contain multiple hierarchies with one or more levels in each hierarchy.
A measure value in a densely populated dataset will exist for most combinations of dimension members. For example, the dimension member combination of ip_address = "20.49.248.146", event = "Watched Video" and date_session = "2013-03-21" will result in anevent_count measure value of 1. Pentaho Instaview combines measures and dimensions into a multidimensional model, so users can simultaneously analyze multiple measures and dimensions to detect patterns and anomalies and gain valuable insight into the data.
Open an existing Instaview
At this point, you should have created, saved, and closed the Clickstream Instaview modifications from the previous chapter. We need to reopen Clickstream to make modifications to the original model design. The initial model is autogenerated with dimensions and measures defined by each field's data type. By default, non-numeric data type fields are added as dimensions, while numeric data types are added as measures and dimensions. Rarely does the initial model meets the needs of the business, so our first task is to enhance the default model. Our goal is to make the model intuitive and easy to use.
In Instaview's Configure mode, navigating to Model | Edit launches you into the Model Editor perspective of PDI, as shown in the following screenshot:
While in edit mode, you will see a list of available fields that can be used to create your measures and dimensions along with a default multidimensional model. The following table shows the icons, names, and attributes of the available model objects:
|
Model object icon |
Model object name |
Model object attributes |
|
|
Measure |
Display Name and Selected Aggregation |
|
|
Dimension |
Dimension Name and Time Dimension Option |
|
|
Hierarchy |
Hierarchy Name |
|
|
Level |
Name, Contains only unique member Option, Source Column, and Ordinal Column |
In the next section, we will make several changes to improve the model for better analysis.
Modifying measures and dimensions
In this section, we make several changes to improve the model for better analysis. It is important to check the aggregation setting for every measure in a model. Aggregation defines the numerical function to apply to the measure when aggregating its values across the model dimensions.
1. So, the first set of model changes in this section are for measures. We change the Display Name and Selected Aggregation for Durationsession and create two new measures: Session Count, to count sessions, and Event Count, to count events. By the end of this section, your model will have three measures with three different aggregation settings: average, count distinct, and count.
Session duration measure
In the following exercise, you will rename the Durationsession to a more business-friendly name and change its aggregation from sum to average, because it is incorrect to summarize averages. The steps for this are as follows:
1. While in Instaview's Configure mode, click on the Edit hyperlink in the Model section to start making changes. You will see the default Clickstream model containing one measure and eight dimensions.
2. The three sections available to edit a model are as follows:
1. The Data tab (1) provides a list of available fields defined by your data source connection. To create a dimensional model, you drag the available fields from the Data section into the Measures and Dimension folders located in the Analysis tab (section 2).
2. The Analysis tab (2) shows the measures and dimensions for analysis.
3. The Properties tab (3) displays the available properties for each object you select.
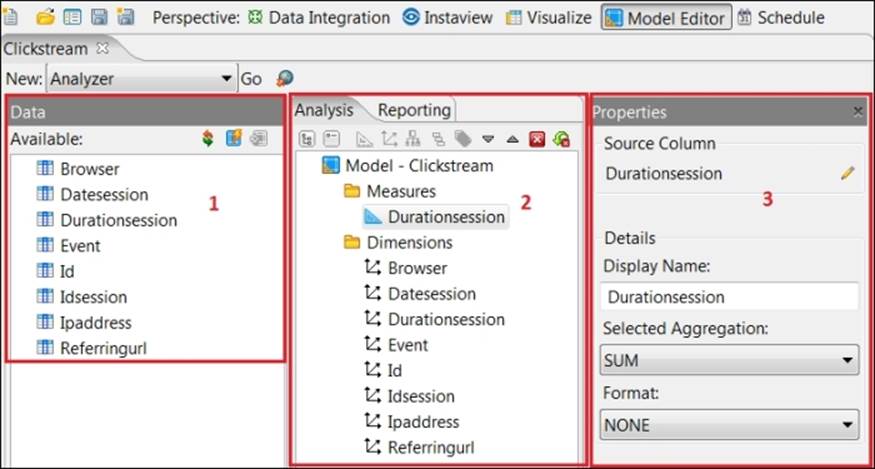
3. Click on the Durationsession measure to highlight it, and the Properties tab (3) will appear to the right with dropdown menus for changing display name, selected aggregation, and format:
4. On the Properties tab (3), change the measure name by typing Session Duration in the Display Name textbox.
5. Change Selected Aggregation to AVERAGE.
Session count measure
Now, we create a new session count measure that is calculated by counting the number of distinct Idsession values:
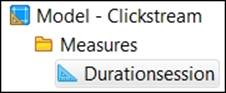
1. Drag Idsession from the Data tab (1) to the Measures folder on the Analysis tab (2).
![]()
2. Click on Idsession in the Measures folder to highlight it.
3. On the Properties tab (3), change the measure name by typing Session Count in the Display Name textbox.
4. Change Selected Aggregation to COUNT_DISTINCT.
Event count measure
Now, we create a new event count measure that is calculated by counting the Event values:
1. Drag Event from the Data tab (1) to the Measures folder on the Analysis tab (2).
2. Click on Event in the Measures folder to highlight it.
3. On the Properties tab (3), change the measure name by typing Event Count in the Display Name textbox.
4. Change Selected Aggregation to COUNT.
Referring URL dimension
The next set of model changes are for dimensions. We start by creating a three-level hierarchy made up of the Referringurl, Ipaddress, and Idsession fields. This hierarchy gives users the option to drill down from referring URL to IP address and session ID. The steps for this are as follows:
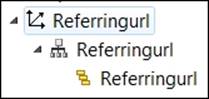
1. Expand the Referringurl dimension to display the Referringurl hierarchy.
2. Expand the Referringurl hierarchy to display the Referringurl level.
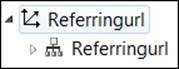
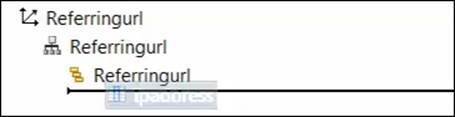
3. To add a new level to the hierarchy, drag Ipaddress from the Data tab (1) to the area directly below the Referringurl dimension level. A black level line will appear when you hover just under the level, as shown in the following screenshot:
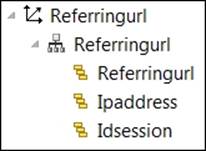
4. Drag Idsession from the Data tab (1) to the area directly below the Ipaddress dimension level. The result is a three-level hierarchy that looks as follows:
Other dimension changes
The final set of dimension changes is cosmetic. We rename a dimension and remove unnecessary or redundant dimensional information.
1. Rename the Datesession dimension, hierarchy, and level by highlighting each object and subsequently changing the Display Name to Session Date.
2. Delete the Durationsession dimension by clicking on the dimension to highlight it and then clicking on the red X button to delete it.
3. Delete the Id, Idsession, and Ipaddress dimensions using the same method as in the previous step.
4. Click on the Save icon from the toolbar to save your model changes.
5. Compare your measures and dimensions to the model in the following screenshot:
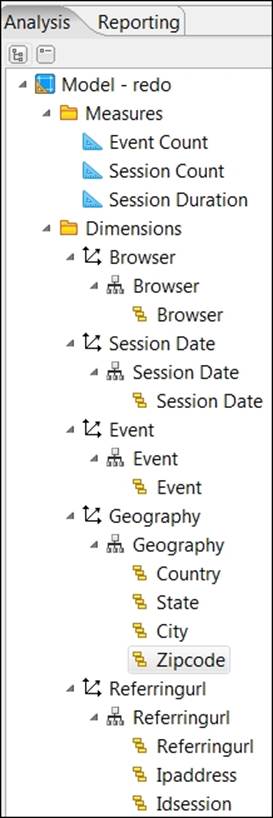
6. When you are done comparing the models, click on the Instaview perspective in the top-right hand side of the window to return to Instaview's Configure mode:
![]()
7. Click on the Run button in the top-left area of Configure mode to refresh the model with the new fields, new geography data, and updated metadata.
Creating a new analysis view
You should be in the View mode after refreshing your Instaview. With a newly updated model, it is a good idea to test model changes by creating a new analysis. The analysis created in the following exercise will validate that our measures are correctly aggregating across the Referringurl dimension:
1. Click on the New Analysis button.
Note
The measures and dimensions are updated in the Available fields section.
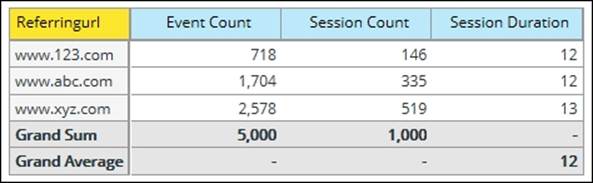
2. Drag all three measures, Event Count, Session Count, and Session Duration, to the Measures drop zone in the Layout section.
3. Drag Referringurl to the Rows drop zone in the Layout section.
4. Click on the Report Options button, checkmark Show Grand Totals for Columns, and then click on OK.
5. Right click on the Session Duration column header and choose Subtotals from the right-click menu options.
6. Uncheck the default Sum aggregation and check Average.
7. Click on OK.
Your table values should match those in the following figure:
8. Click on the Save View button and name the visualization as Chapter05-Measures_Table. Click on OK.
9. Click on the Close button in the top-right corner of your screen, and save your Clickstream Instaview changes.
Summary
Congratulations! You have just completed the Clickstream Instaview by updating the metadata model with additional geography fields, new measures, and a hierarchy with multiple levels. As you can see, Instaview allows you to easily access, transform, and visualize data for agile development and quick prototyping. Now, we are ready to move towards more production-oriented Pentaho tools designed to deliver MongoDB data at scale and into production. The next chapter will show you the power of Report Designer , which is used to build prompted reports against MongoDB data.
All materials on the site are licensed Creative Commons Attribution-Sharealike 3.0 Unported CC BY-SA 3.0 & GNU Free Documentation License (GFDL)
If you are the copyright holder of any material contained on our site and intend to remove it, please contact our site administrator for approval.
© 2016-2026 All site design rights belong to S.Y.A.