Learning Nagios 4 (2014)
Chapter 6. Notifications and Events
We already know how notifications work in Nagios. The previous chapters described how Nagios sends information to the users when a problem occurs and how it decides to notify people. Previously, our examples were limited to sending an e-mail 24 hours a day or only during working days.
In this chapter, we will cover the following topics:
· Setting up notifications effectively—when they should be sent; how they should be sent; and how to use multiple methods of notifying users, such as setting up Nagios to send a text message to your mobile during the day or to send you a message on Jabber or HipChat only when you are online
· Using escalations that allow sending information about the host or service status when it is failing for a long period of time—for example, notifying a manager when a critical service has been down for over four hours
· Sending commands via the Nagios external commands, such as adding comments on hosts and services, modifying notification settings
· Using event handlers that can be set up to be run whenever a service status changes
Creating effective notifications
This section covers notifications in more depth and details how Nagios can tell other people about what is happening. We will discuss a simple approach, as well as a more complex one on how notifications can make your life easier.
In many cases, a plain e-mail notification about a problem may not always be the right thing to do. As people's inboxes get cluttered with e-mails, the usual approach is to create rules to move certain messages that they don't even read to separate folders. There's a pretty good chance that if people start getting a lot of notifications to which they won't need to react, they'll simply ask their favorite mailing program to move these messages into a do not look in here unless you have plenty of time folder. Moreover, in such cases, if there is an issue they should be handling at the time, they will most probably miss the notification e-mail.
This section talks about what can be implemented in your company to make notifications more convenient for the IT staff. Limiting the amount of irrelevant information sent to various people tends to decrease their response time, because they will have much less information to filter out.
Using multiple notifications
The first feature that many Nagios administrators overlook is the ability to create more than one notification command: Nagios can notify you on both instant messaging (such as Jabber or HipChat) and e-mail. It can also send you an SMS. A disadvantage is that at some point you might end up receiving text messages at 2 A.M. about an outage of a machine that may be down for the next three days, which is not critical.
At this point, it's worth mentioning that there's another easy solution. The approach is to create multiple contacts for a single person. For example, you can set up different contacts when you're at work and when you're offline, and define a profile that ensures that you are not disturbed too much during the night.
For example, to handle various times of the day in a different fashion, you can set up the following contacts:
· jdoe-workhours: This is a contact that will only receive notifications during working hours; notifications will be carried out using both the corporate IM system and e-mails
· jdoe-daytime: This is a contact that will only receive notifications between 7 A.M. and 10 P.M., excluding working hours; notifications will be sent as a text or a pager message and an e-mail
· jdoe-night: This would be a contact that will only receive notifications between 10 P.M. and 7 A.M.; notifications will only be sent out as an e-mail
All entries would also contain contactgroups pointing to the same groups that the single jdoe contact entry used to contain. In this way, the other objects, such as hosts, services, or contact groups related to this user would not be affected. All entries would also reside in the same file, for example, contacts/jdoe.cfg.
The main drawback of this approach is that logging on to the web interface would require using one of the previous users or keeping the jdoe contact without any notifications, just to be able to log on to the interface.
The preceding example combined the creation of multiple contacts and the use of multiple notification commands to achieve a convenient way of getting notified about a problem. Using only multiple contacts also works fine. Another approach to the problem is to define different contacts for different ways to be notified—for example, jdoe-email, jdoe-sms, and jdoe-jabber. This way, you can define different contact methods for various time periods—instant messages during working hours, text messages while on duty, and an e-mail when not at work.
Another important issue is to make sure that as few people as possible are notified of the problem. Imagine there is a host without an explicit administrator assigned to it. A notification about a problem is sent out to 20 different people. In such a case, either each of them will assume that someone else will resolve the problem, or people will run into a communication problem over discussing who will actually handle it.
Teams that closely cooperate with each other usually solve these issues with ease—knowledgeable people start discussing an issue and a natural solution to solve the issue comes out of the discussion. However, the teams that are distributed across various locations or that have inefficient communication within their team will run into problems in such cases.
That is why it is a good idea to either nominate a coordinator who will assign tasks as they arise, or try to maintain a short list of people responsible for each machine. If you need to make sure that other people will investigate the problem if the person responsible for the machine cannot do it immediately, then it is a good idea to resort to escalations for this purpose. These are described later in this chapter.
Previously, we mentioned that notifications only via e-mail may not always be the best thing to do. For example, they don't work well for situations that require quick response times. There are various reasons behind this. First, e-mails are slow—even though the e-mail lands on your mail server in a few seconds, people usually only poll their e-mails every few minutes. Second, people tend to filter e-mails and skip those in which they are not interested.
Another good reason why e-mails should not always be used is that they stay in your e-mail account until you actually fetch and read them. If you have been on a two-week vacation and a problem has occurred, should you still be worried when you read it after you get back? Has the issue been resolved already?
If your team needs to react to problems promptly, using e-mails as the basic notification method is definitely not the best choice. Let's consider what other possibilities exist to notify users of a problem effectively.
As already mentioned, a very good choice is to use instant messaging or Short Message Service (SMS) as the basic means of notification, and only use e-mail as the last resort. Some companies might also use the client-server approach to notify the users of the problems, perhaps integrated with showing Nagios' status only for particular hosts and services. NagiosExchange has plenty of available solutions you can use to handle notifications effectively. Visit http://exchange.nagios.org/ for more details.
Sending instant messages via Jabber
The first and the most powerful option for notifications is to use Jabber (http://www.jabber.org/). There is an existing script for this that is available in the contributions repository on the Nagios project website (visithttp://nagios.sf.net/download/contrib/notifications/notify_via_jabber). This is a small Perl script that sends messages over Jabber. You may need to install additional system packages to handle Jabber connectivity from Perl. On Ubuntu, this requires running the following command:
root@ubuntu1:~# apt-get install libnet-jabber-perl
If you are using Central Perl Archive Network (CPAN), which is the source for Perl modules and documentation (visit http://www.cpan.org/), to install Perl packages, then simply run the following command:
root@ubuntu1:~# cpan install Net::Jabber
In order to use the notification plugin, you will need to customize the script—change the SERVER, PORT, USER, and PASSWORD parameters to those of an existing account. Our recommendation is to create a separate account for Nagios notifications—you will need to set up authorizations for each user to which you want to send notifications.
After modifying the script, it can be used for notifications as follows:
define command{
command_name notify-host-by-jabber
command_line /path/to/notify_via_jabber $_CONTACTJABBERID$ "Nagios Host Notification Type: $NOTIFICATIONTYPE$ Host: $HOSTNAME$\nState: $HOSTSTATE$ Address: $HOSTADDRESS$ Info: $HOSTOUTPUT$ "
}
define command{
command_name notify-service-by-jabber
command_line /path/to/notify_via_jabber $_CONTACTJABBERID$ "Nagios Service Notification Type: $NOTIFICATIONTYPE$ Service: $SERVICEDESC$ Host: $HOSTALIAS$ Address: $HOSTADDRESS$ State: $SERVICESTATE$ Additional Info: $SERVICEOUTPUT$"
}
The preceding commands can be used for host and service notifications, and will send a descriptive message using Jabber to the specified user. The $_CONTACTJABBERID$ text will be replaced with the current contact's _JABBERID custom variable.
Please note that due to the way Jabber works, the best approach for the notify_via_jabber script would be to use the same Jabber server as that used by clients to receive notifications.
As you plan to monitor servers and, potentially, even outgoing Internet connectivity, it would not be wise to use public Jabber servers to report errors. Therefore, it is a good idea to set up a private Jabber server, probably on the same host on which the Nagios monitoring system is running.
There are multiple desktop clients for the Jabber protocol that can be used to receive Nagios notifications in a convenient way. Pidgin, available at http://www.pidgin.im/, is a cross-platform instant messaging client with multiple protocol support and includes support for Jabber.
Notifying users with text messages
There are extremely useful packages to send SMS (text messages sent from mobile phones) and multiple interfaces to send SMS information via the Internet—such as http://www.twilio.com/, which offers a service to send SMS to phones across a large number of countries.
Using Twilio to send notifications from Nagios is straightforward. Download the twilio-sms command line from https://www.twilio.com/labs/bash/sms. It also requires creating a configuration file that specifies account information for Twilio. For an installation performed according to the steps given in Chapter 2, Installing Nagios 4, the location for the file is /opt/nagios/.twiliorc.
Next, create a Nagios command that uses the twilio-sms command directly, as follows:
define command{
command_name notify-host-by-twilio
command_line echo "Nagios $NOTIFICATIONTYPE$ Host: $HOSTNAME$ State: $HOSTSTATE$" | /path/to/twilio-sms $_CONTACTSMSNUMBER$
}
define command{
command_name notify-service-by-twilio
command_line echo "Nagios $NOTIFICATIONTYPE$ Svc: $SERVICEDESC$ Host: $HOSTALIAS$ State: $SERVICESTATE$" | /path/to/twilio-sms $_CONTACTSMSNUMBER$
}
The downside of using Internet-based notification services is that if Internet connectivity is down, it is not possible for Nagios to send notifications. This may be a problem for Internet providers who need to be sure that their customers are online all the time.
Another possibility to send notifications is to use GSM terminals or USB modems that offer a convenient way to send SMS notifications. Both GSM terminals and USB modems can be used to send text messages via regular SIM cards, which only require GSM coverage and not Internet access. These devices are usually connected via USB or a serial port.
There are multiple tools that allow managing GSM terminals/modems, such as Gammu (http://wammu.eu/gammu/) and Gnokii (http://www.gnokii.org/).
Both are very common applications, and when setting up a GSM terminal, it is best to check both for how well a specific hardware is supported and choose the program that supports this specific GSM terminal better. Depending on the exact hardware used, additional steps to set up drivers and/or configure Gammu/Gnokii may be needed. It is recommended to refer to the documentation for both Gammu/Gnokii, as well as the GSM terminal's documentation.
After setting up, both Gammu and Gnokii provide command-line tools to send SMS messages. The following example shows how to send messages using Gammu:
define command{
command_name notify-host-by-gammu
command_line echo "Nagios $NOTIFICATIONTYPE$ Host: $HOSTNAME$ State: $HOSTSTATE$" | /path/to/gammu --sendsms TEXT $_CONTACTSMSNUMBER$
}
define command{
command_name notify-service-by-gammu
command_line echo "Nagios $NOTIFICATIONTYPE$ Svc: $SERVICEDESC$ Host: $HOSTALIAS$ State: $SERVICESTATE$" | /path/to/gammu --sendsms TEXT $_CONTACTSMSNUMBER$
}
Current mobile phones also offer cheap Internet connectivity, and smart devices offer the possibility to write custom applications in Java, .NET, Ruby, Python, and Tcl, among many other languages. Therefore, you can also create a client-server application that queries the server for the status of selected hosts and services. It can even be unified with a notification command that pushes the changes down to the application immediately.
Integrating with HipChat
There are also multiple specialized tools for communication within organizations—such as HipChat, a service available at http://www.hipchat.com/. It is a popular online service for group and direct communication within a company. The service has extensive APIs is commonly used to send notifications in addition to regular messaging.
HipChat offers rooms for group communications that are often used to receive notifications as well, for example, a room for Nagios notifications, where the IT staff resides and receives notifications instantly. The chat can then also be used quickly and informally to assign tasks to individuals.
There is a ready-to-use, freely available solution to integrate Nagios with HipChat named hipsaint, which is available at https://github.com/hannseman/hipsaint.
To use it, simply download the source code and run the installation script as follows:
$ python setup.py install
Next, create new commands to send notification to specific rooms as follows:
define command {
command_name notify-host-by-hipchat
command_line hipsaint --token=tokenid --room=roomid --type=host --inputs="$HOSTNAME$|$LONGDATETIME$|$NOTIFICATIONTYPE$|$HOSTADDRESS$|$HOSTSTATE$|$HOSTOUTPUT$" -n
}
define command {
command_name notify-service-by-hipchat
command_line hipsaint --token=tokenid --room=roomid --type=service --inputs="$SERVICEDESC$|$HOSTALIAS$|$LONGDATETIME$|$NOTIFICATIONTYPE$|$HOSTADDRESS$|$SERVICESTATE$|$SERVICEOUTPUT$" -n
}
All of the above are ways to send notifications about host/service statuses, which are more convenient than regular e-mails. Letting the IT staff know about problems (and once they are resolved) and being able to communicate to other people in your team/company is essential. Using e-mails may be a good solution in many cases; however, it is a good idea to spend some time on researching for a convenient and non-intrusive approach to use for Nagios notifications.
Apart from the examples previously mentioned, there are many more ready-to-use solutions available online. Many of them are listed on Nagios Exchange at http://exchange.nagios.org/directory/Addons/Notifications.
Understanding escalations
A common problem with resolving problems is that a host or a service may have unclear ownership. Often, there is no single person responsible for a host or service, which makes resolution of the problem difficult. It is also typical to have a service with subtle dependencies on other things, which by themselves are small enough not to be monitored by Nagios. In such a case, it is good to include lower management in the escalations, so that they are able to focus on problems that haven't been resolved in a timely manner.
Here is a good example: a database server might fail because a small Perl script, which is run prior to actual start and cleans things up, has entered an infinite loop. The owner of this machine is notified. But the question is, who should be fixing it? The script owner? Or perhaps the database administrator? Often, this ends up in different teams assuming someone else should resolve it—programmers waiting on database administrators and vice versa.
In such cases, escalations are a great way to solve such complex problems. In the previous example, if the problem has not been resolved for two hours, the IT team coordinator or manager would be notified. Another hour later, he/she would get another e-mail. At that point, an urgent meeting would be scheduled with the developer who owns the script and the database admin to discuss how this could be solved.
Of course, in real-world scenarios, escalations to the management alone does not solve all problems. However, often situations need a coordinator who will take care of communicating issues between teams and trying to find a company-wide solution. Business-critical services also require much higher attention. In such cases, following an escalation ladder for all major problems can really benefit the company.
Setting up escalations
Nagios offers many ways to set up escalations depending on your needs. Escalations should not be sent out just after a problem occurs because that would create confusion and prevent smaller problems from being solved. Usually, escalations are set up so that additional people are informed only if a problem has not been resolved after a certain amount of time.
From a configuration point of view, all escalations, are defined as separate objects. There are two types of objects—hostescalation and serviceescalation. Escalations are configured so that they start and stop being active along with the normal host or service notifications. In this way, if you change the notification_interval directive in a host or service definition, the times at which escalations start and stop will also change.
A sample escalation for a company's main router is as follows:
define hostescalation
{
host_name mainrouter
contactgroups it-management
first_notification 2
last_notification 0
notification_interval 60
escalation_options d,u,r
}
This will define an escalation for the mainrouter host. With this escalation, the it-management contact group will also get notifications, starting with the second notification. In addition, it will cause the notifications about the host to be in a DOWN and UP state even when it recovers. How Nagios handles notifications and escalations is described in more detail in the next section of the chapter.
The following table describes all available directives to define a host escalation. Items in bold are required when specifying an escalation.
|
Option |
Description |
|
host_name |
This specifies a list of all hosts for which the escalation should be defined, and is separated by commas. |
|
hostgroup_name |
This specifies a list of all host groups for which the escalation should be defined. All hosts inside the said host groups will have the escalation defined for them. It is separated by commas. |
|
contacts |
This is a list of all contacts that should receive notifications related to this escalation, and is separated by commas. At least one contact or contact group needs to be specified for each escalation. |
|
contactgroups |
This is a list of all contacts groups that should receive notifications related to this escalation, and is separated by commas. At least one contact or contact group needs to be specified for each escalation. |
|
first_notification |
This is the number of notifications after which this escalation becomes active. Setting this to 0 causes notifications to be sent until the host recovers from the problem. |
|
last_notification |
This is the number of notifications after which this escalation stops being active. |
|
notification_interval |
This specifies the interval (the number of minutes) between sending notifications related to this escalation. |
|
escalation_period |
This specifies the time period during which an escalation is valid. If it is not specified, this defaults to 24 hours a day, 7 days a week. |
|
escalation_options |
This specifies the host states for which notification types should be sent and is separated by commas. This can be one or more of the following: · d: host DOWN state · u: host UNREACHABLE state · r: host recovery (UP state) |
Service escalations are defined in a way that is very similar to host escalations. You can specify one or more hosts or host groups, as well as a single service description. A service escalation will be associated with this service on all hosts mentioned in the host_nameand hostgroup_name attributes.
The following is an example of a service escalation for an OpenVPN check on the company's main router:
define serviceescalation
{
host_name mainrouter
service_description OpenVPN
contactgroups it-management
first_notification 2
last_notification 0
notification_interval 60
escalation_options w,c,r
}
This will define an escalation for the OpenVPN service running on the mainrouter host. With this escalation, the it-management contact group will also get notifications, starting with the second notification. The escalation will cause notifications about the service to be inWARNING and CRITICAL states even when it recovers.
The following table describes all the available directives to define a service escalation. Items in bold are required when specifying an escalation.
|
Option |
Description |
|
host_name |
This specifies a list of all the hosts for which the escalation should be defined, and is separated by commas. |
|
hostgroup_name |
This specifies a list of all host groups that the escalation should be defined for. All hosts inside the said host groups will have the escalation defined for them. It is separated by commas. |
|
service_description |
This is the service for which the escalation is being defined. |
|
contacts |
This is a list of all contacts that should receive notifications related to this escalation, and is separated by commas. At least one contact or contact group needs to be specified for each escalation. |
|
contactgroups |
This is a list of all contact groups that should receive notifications related to this escalation, and is separated by commas. At least one contact or contact group needs to be specified for each escalation. |
|
first_notification |
This is the number of notifications after which this escalation becomes active. |
|
last_notification |
This is the number of notifications after which this escalation stops being active. Setting this to 0 causes notifications to be sent until the service recovers from the problem. |
|
notification_interval |
This specifies the interval (the number of minutes) between sending notifications related to this escalation. |
|
escalation_period |
This specifies the time period during which an escalation is valid. If it is not specified, this defaults to 24 hours a day, 7 days a week. |
|
escalation_options |
This specifies the service states for which notification types should be sent, and is separated by commas. This can be one or more of the following: · r: service recovers (OK state) · w: service WARNING state · c: service CRITICAL state · u: service UNKNOWN state |
Understanding how escalations work
Let's consider the following configuration—a service along with two escalations:
define service
{
use generic-service
host_name mainrouter
service_description OpenVPN
check_command check_openvpn_remote
check_interval 15
max_check_attempts 3
notification_interval 30
notification_period 24x7
}
# Escalation 1
define serviceescalation{
host_name mainrouter
service_description OpenVPN
first_notification 4
last_notification 8
contactgroups it-escalation1
escalation_options w,c
notification_period 24x7
notification_interval 15
}
# Escalation 2
define serviceescalation{
host_name mainrouter
service_description OpenVPN
first_notification 8
last_notification 0
contactgroups it-escalation2
escalation_options w,c,r
notification_period 24x7
notification_interval 120
}
In order to show how the escalations work, let's take an example—a failing service. A service fails for a total of 16 hours and then recovers; for the clarity of the example, we'll skip the soft and hard states and the time required for hard state transitions.
Service notifications are set up so that the first notification is sent out 30 minutes after failure, which is then repeated every 60 minutes. The next notification is sent 1.5 hours after the actual failure, and so on. The service also has two escalations defined for it:
· Escalation 1: It is first triggered along with the fourth service notification that is sent out. The escalation stops being active after the eighth service notification about the failure. It only sends out reports about problems, not recovery. The escalation_options is set to w,c, which is the WARNING and CRITICAL states. The interval for this escalation is 15 minutes.
· Escalation 2: It is first triggered along with the eighth service notification and never stops. The last_notification directive is set to 0. It sends out reports about problems and recovery. The escalation_options is set to w,c,r, which is the WARNING, CRITICAL, andRECOVERY states. The interval for this escalation is two hours.
The following diagram shows when both the escalations are sent out:
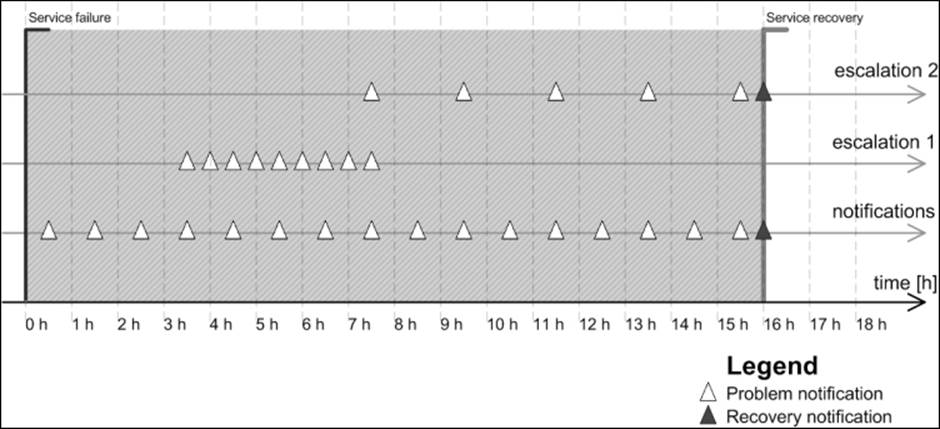
The notifications for the service are sent out 0.5, 1.5, 2.5, 3.5 … hours after the occurrence of the initial service failure.
Escalation 1 becomes active after 3.5 hours, which is when the fourth service notification is sent out. The last notification related to escalation 1 is sent out 7.5 hours after the initial failure. This is when the eighth service notification is sent out. It is sent every 30 minutes, so a total of nine notifications related to escalation 1 are sent out.
Escalation 2 becomes active after 7.5 hours, which is when the eighth service notification is sent out. The last notification related to escalation 2 is sent out when the problem is resolved and concerns the actual problem resolution. It is sent every two hours, so a total of four notifications related to escalation 2 are sent out.
Escalations can be defined to be independent of each other. There is no reason why Escalation 2 cannot start after the sixth service notification is sent out. There are also no limits on the number of escalations that can be set up for a single host or service.
The main point is that escalations should be defined reasonably so that they don't overload the management or other teams with problems that can be solved without their interference.
Escalations can also be used to contact different people for a certain set of objects based on time periods. If an escalation has the first_notification option set to 1 and the last_notification option set to 0, then all notifications related to this escalation will be sent out exactly in the same way as notifications for the service itself. For example, on working days, regular IT staff may handle problems; however, during holidays, if notifications about problems should also go to the CritSit team, then you can simply define an escalation saying that during the holidays time period, the CritSit group should also be notified when the first notification is sent out. The following is an example that is based on the OpenVPN service defined earlier:
define serviceescalation
{
host_name mainrouter
service_description OpenVPN
first_notification 1
last_notification 0
contactgroups CritSit
notification_period holidays
notification_interval 30
escalation_options w,c,r
}
The preceding definitions specify both the service and its escalation. Please note that the notification_interval option is set to the same value in both the object and the escalation.
Sending commands to Nagios
Nagios offers a very powerful mechanism to receive events and commands from external applications—the external commands pipe. This is a pipe file created on a filesystem that Nagios uses to receive incoming messages. The filename is rw/nagios.cmd, and it is located in the directory passed as the localstatedir option during compilation. If you have followed the compilation and installation instructions given in Chapter 2, Installing Nagios 4, the filename will be /var/nagios/rw/nagios.cmd.
The communication does not use any authentication or authorization. The only requirement is to have write access to the pipe file. An external command file is usually writable by the owner and the group; usually, the group used is nagioscmd. If you want a user to be able to send commands to the Nagios daemon, simply add that user to this group.
A small limitation of the command pipe is that there is no way to get any results, and so, it is not possible to send query commands to Nagios. Therefore, by just using the command pipe, you have no confirmation that the command you have just passed to Nagios has actually been processed or will be processed soon. It is, however, possible to read the Nagios logfile and check if it indicates that the command has been parsed correctly, if necessary.
An external command pipe is used by the web interface to control how Nagios works. The web interface does not use any other means to send commands or apply changes to Nagios. This gives us a good understanding of what can be done with the external command pipe interface.
From the Nagios daemon perspective, there is no clear distinction as to who can perform what operations. Therefore, if you plan to use the external command pipe to allow users to submit commands remotely, you need to make sure that the authorization is in place so that unauthorized users cannot send potentially dangerous commands to Nagios.
The syntax to format commands is easy. Each command must be placed on a single line and end with a newline character. The syntax is as follows:
[TIMESTAMP] COMMAND_NAME;argument1;argument2;...;argumentN
TIMESTAMP is written as UNIX time; that is, the number of seconds since 1970-01-01 00:00:00. This can be created using the date +%s system command. Most programming languages also offer the means to get the current UNIX time. Commands are written in upper case. This can be one of the commands that Nagios should execute, and the arguments depend on the actual command.
All of the commands that can be sent to Nagios using the external command pipe are defined in the documentation available at http://www.nagios.org/developerinfo/externalcommands/commandinfo.php.
Adding comments to hosts and services
One of the commands that can be sent to Nagios via the external pipe are commands to add a comment for a host or service. This can be used by automated processes to add comments regarding
For example, to add a comment to a host stating that it has passed a security audit, one can use the following shell command:
echo "['date +%s'] ADD_HOST_COMMENT;somehost;1;Security Audit;
This host has passed security audit on 'date +%Y-%m-%d'" >/var/nagios/rw/nagios.cmd
This will send an ADD_HOST_COMMENT command to Nagios over the external command pipe. Nagios will then add a comment to the host, somehost, stating that the comment originated from Security Audit. The first argument specifies the hostname to add the comment to; the second tells Nagios if this comment should be persistent. The next argument describes the author of the comment, and the last argument specifies the actual comment text.
Similarly, adding a comment to a service requires the use of the ADD_SVC_COMMENT command. The command's syntax is very similar to the ADD_HOST_COMMENT command, except that the command requires the specification of the hostname and the service name.
For example, to add a comment to a service stating that it has been restarted, use the following code:
echo "['date +%s'] ADD_SVC_COMMENT;router;OpenVPN;1;nagiosadmin;
Restarting the OpenVPN service" >/var/nagios/rw/nagios.cmd
The first argument specifies the hostname to which to add the comment; the second is the description of the service to which Nagios should add the comment. The next argument tells Nagios if this comment should be persistent. The fourth argument describes the author of the comment, and the last argument specifies the actual comment text.
You can also delete a single comment or all comments using the DEL_HOST_COMMENT, DEL_ALL_HOST_COMMENTS, DEL_SVC_COMMENT, or DEL_ALL_SVC_COMMENTS commands.
Scheduling host and service checks
Other commands worth mentioning are related to scheduling checks on demand. Very often, it is necessary to request that a check must be carried out as soon as possible; for example, when testing a solution.
This time, let's create a script that schedules a check of a host, all services on that host, and a service on a different host, as follows:
#!/bin/sh
NOW='date +%s'
echo "[$NOW] SCHEDULE_HOST_CHECK;somehost;$NOW" \
>/var/nagios/rw/nagios.cmd
echo "[$NOW] SCHEDULE_HOST_SVC_CHECKS;somehost;$NOW" \
>/var/nagios/rw/nagios.cmd
echo "[$NOW] SCHEDULE_SVC_CHECK;otherhost;Service Name;$NOW" \
>/var/nagios/rw/nagios.cmd
exit 0
The commands SCHEDULE_HOST_ and SCHEDULE_HOST_SVC_CHECKS accept a hostname and the time at which the check should be scheduled. The SCHEDULE_SVC_CHECK command requires the specification of a service description as well as the name of the host on which to schedule the check.
Normal scheduled checks, such as the ones previously scheduled , might not actually take place at the time that you scheduled them. Nagios also needs to take allowed time periods into account, as well as verify whether the checks were disabled for a particular object or for Nagios entirely.
There are cases when you'll need to force Nagios to preform a check. In such cases, you should use the SCHEDULE_FORCED_HOST_, SCHEDULE_FORCED_HOST_SVC_CHECKS, and SCHEDULE_FORCED_SVC_CHECK commands. They work in exactly the same way as previously described, but make Nagios skip the checking of time periods and ensure that the checks are disabled for a particular object. In this way, a check will always be performed regardless of other Nagios parameters.
Modifying custom variables
Other commands worth using are related to the custom variables feature, which is detailed in Chapter 5, Advanced Configuration. When you define a custom variable for a host, service, or contact, you can change its value on the fly with the external command pipe.
Because these variables can then be directly used by check or notification commands and event handlers, it is possible to make other applications or event handlers change these attributes directly without modifications to the configuration files.
A good example would be the IT staff using an application that allows receiving notifications, for example, Growl, a notification system for OS X and Windows (visit http://growl.info/ and http://www.growlforwindows.com/ for more details).
It is then possible for a helper application also to periodically send information about the last known IP address, and that information is then passed to Nagios, assuming that the person is in the office. This can then be passed to a notification command to use that specific IP address while sending a message to the user.
Assuming that the username is jdoe and the custom variable name is DESKTOPIP, the message that would be sent to the Nagios external command pipe would be as follows:
[1206096000] CHANGE_CUSTOM_CONTACT_VAR;jdoe;DESKTOPIP;12.34.56.78
This would cause a later use of $_CONTACTDESKTOPIP$ to return a value of 12.34.56.78.
Nagios offers the CHANGE_CUSTOM_CONTACT_, CHANGE_CUSTOM_HOST_VAR, and CHANGE_CUSTOM_SVC_VAR commands to modify custom variables in contacts, hosts, and services, respectively.
The commands previously explained are just a small subset of the full capabilities of the Nagios external command pipe. For a complete list of commands, visit http://www.nagios.org/developerinfo/externalcommands/commandlist.php, where the External Command List can be seen.
External commands are usually sent from event handlers or from the Nagios web interface. You will find external commands most useful when writing event handlers for your system, or when writing an external application that interacts with Nagios.
Creating event handlers
Event handlers are commands that are triggered whenever the state of a host or service changes. They offer functionalities similar to those of notifications. The main difference is that the event handlers are called for each type of change and even for each soft state change. This provides the ability to react to a problem before Nagios notifies it as a hard state and sends out notifications about it. Another difference is what the event handlers do: instead of notifying users that there is a problem, event handlers carry out actions automatically.
For example, if a service is defined with max_check_attempts set to 4, the retry_interval set to 1, and check_interval set to 5, then the following example illustrates when event handlers will be triggered and with what values for $SERVICESTATE$, $SERVICESTATETYPE$, and$SERVICEATTEMP$ macro definitions:
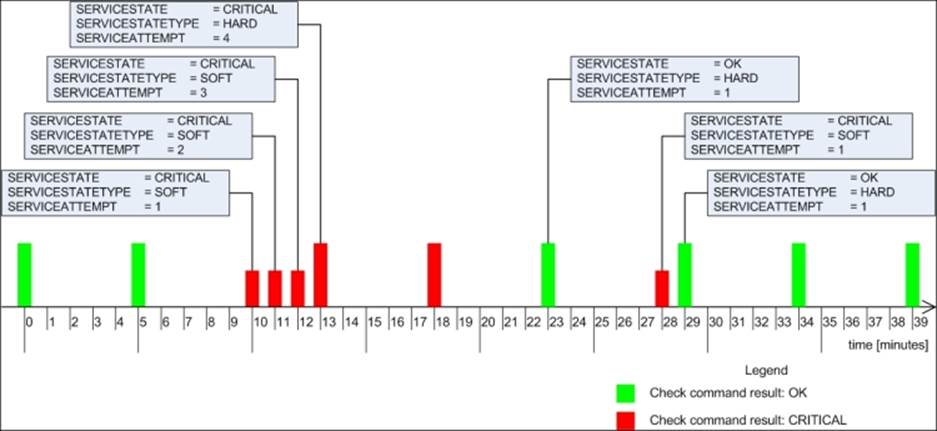
Event handlers are triggered for each state change, for example, in minutes, 10, 23, 28, and 29. When writing an event handler, it is necessary to check whether an event handler should perform an action at that particular time. See the example in the following section for more details.
Event handlers are also triggered for each soft check attempt. It is also triggered when the host status becomes hard (when max_check_attempts attempts of checks have been made and the service has not recovered). In this example, these occur at minutes 11, 12, and 13. It's important to know that the events will run if no state change has occurred and the object is in a hard state; for example, no events are triggered in minutes 5, 18, 34, and 39.
Restarting services automatically
A typical example might be that your web server process tends to crash once a month. Because this is rare, it is very difficult to debug and resolve it. Therefore, the best way to proceed is to restart the server automatically until a solution to the problem is found.
If your configuration has max_check_attempts set to 4, as in the preceding example, then a good place to try to restart the web server is after the third soft failure check; in the previous example, this would be minute 12.
Assuming that the restart has been successful, the previous figure would look like what is shown in the following figure:
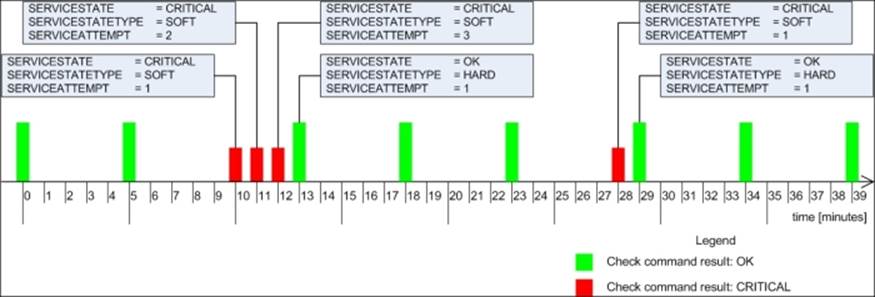
Please note that no hard critical state has occurred since the event handler resolved the problem. If a restart cannot resolve the issue, Nagios will only try it once as the attempt is done only in the third soft check.
Event handlers are defined as commands, similar to check commands. The main difference is that the event handlers only use macro definitions to pass information to the actual event handling script. This implies that the $ARGn$ macro definitions cannot be used, and arguments cannot be passed in the host or service definition by using the ! separator.
In the previous example, we would define the following command:
define command
{
command_name restart-apache2
command_line $USER1$/events/restart_apache2
$SERVICESTATE$ $SERVICESTATETYPE$ $SERVICEATTEMPT$
}
The command would need to be added to the service. For both hosts and services, this requires adding an event_handler directive that specifies the command to be run for each event that is fired. In addition, it is good to set event_handler_enabled to 1 to make sure that event handlers are enabled for this object.
The following is an example of a service definition:
define service
{
host_name localhost
service_description Webserver
use apache
event_handler restart-apache2
event_handler_enabled 1
}
Finally, a short version of the script is as follows:
#!/bin/sh
# use variables for arguments
SERVICESTATE=$1
SERVICESTATETYPE=$2
SERVICEATTEMPT=$3
# we don't want to restart if current status is OK
if [ "$SERVICESTATE" != "OK" ] ; then
# proceed only if we're in soft transition state
if [ "$SERVICESTATETYPE" == "SOFT" ] ; then
# proceed only if this is 3rd attempt, restart
if [ "$SERVICESTATEATTEMPT" == "3" ] ; then
# restarts Apache as system administrator
sudo service apache2 restart
fi
fi
fi
exit 0
Because we're using sudo here, obviously the script needs an entry in the sudoers file to allow the nagios user to run the command without a password prompt. An example entry for the sudoers file is as follows:
nagios ALL=NOPASSWD: /usr/sbin/service
This will tell sudo that the /usr/sbin/service command can be run by the nagios user and passwords will not be requested before running the command.
According to our script, the restart is only done after the third check fails. Assuming that the restart was successful, the next Nagios check will notify that Apache is running again. As this is considered a soft state, Nagios has not yet sent out any notifications about the problem.
If the service does not restart correctly, the next check will cause Nagios to set this failure as a hard state. At this point, notifications will be sent out to the object owners.
You can also try performing a restart in the second check. If that does not help, then during the third attempt, the script can forcefully terminate all Apache2 processes using the killall or pkill command. After this has been done, it can try to restart the service, as seen in the following example:
# proceed only if this is 3rd attempt, restart
if [ "$SERVICESTATEATTEMPT" == "2" ] ; then
# restart Apache as system administrator
sudo service apache2 restart
fi
# proceed only if this is 3rd attempt, restart
if [ "$SERVICESTATEATTEMPT" == "3" ] ; then
# try to terminate apache2 process as system administrator
sudo pkill apache2
# starts Apache as system administrator
sudo service apache2 start
fi
Similar to the previous example, it requires adding an entry in the sudoers file. It also requires the adding of the pkill command, as seen in the following code. The whole path to the command is /usr/bin/pkill:
nagios ALL=NOPASSWD: /usr/bin/pkill
nagios ALL=NOPASSWD: /usr/sbin/service
Another common scenario is to restart one service if another one has just recovered—for example, you might want to restart the e-mail servers that use a database for authentication if the database has just recovered from a failure state. The reason is that some applications may not manage disconnected database handles correctly. This can lead to the service working correctly from the Nagios perspective, but not allowing some of the users in due to internal problems.
If you have set this up for hosts or services, it is recommended that you keep flapping enabled for these services. It often happens that due to incorrectly planned scripts and the relations between them, some services might be stopped and restarted.
In such cases, Nagios will detect these problems and stop running event handlers for these services, which will cause fewer malfunctions to occur. It is also recommended that you keep notifications set up so that people also get information on when flapping starts and stops.
Modifying notifications
Nagios also offers the ability to change various parameters related to notifications. These parameters are modified via an external command pipe, similar to a few of the commands shown in the previous section.
A good example would be when Nagios contact persons have their workstations connected to the local network only when they are actually at work (which is usually the case if they are using notebooks), and turn their computers off when they leave work. In such a case, a ping check for a person's computer could trigger an event handler to toggle that person's attributes.
Let's assume that our jdoe user has two actual contacts—jdoe-email and jdoe-jabber—each for different types of notifications. We can set up a host corresponding to the jdoe workstation. We will also set it up to be monitored every five minutes and create an event handler. The handler will change the host and service notification time period of jdoe-jabber to none on a hard host down state. On a host up state change, the time period for jdoe-jabber will be set to 24x7. In this way, the user will only get Jabber notifications if he or she is at work.
Nagios offers commands to change the time periods during which a user wants to receive notifications. The commands for this purpose are CHANGE_CONTACT_HOST_NOTIFICATION_TIMEPERIOD and CHANGE_CONTACT_SVC_NOTIFICATION_TIMEPERIOD. Both commands take the contact name and the time period as their arguments.
An event handler script that modifies the user's contact time period based on the state is as follows:
#!/bin/sh
NOW='date +%s'
CONTACT=$1-jabber
if [ "$2,$3" = "DOWN,HARD" ] ; then
TP=none
else
TP=24x7
fi
echo "[$NOW] CHANGE_CONTACT_HOST_NOTIFICATION_TIMEPERIOD;$CONTACT;$TP" \
>/var/nagios/rw/nagios.cmd
echo "[$NOW] CHANGE_CONTACT_SVC_NOTIFICATION_TIMEPERIOD;$CONTACT;$TP" \
>/var/nagios/rw/nagios.cmd
exit 0
The command should pass $CONTACTNAME$, $SERVICESTATE$, and $SERVICESTATETYPE$ as parameters to the script.
In case you need a notification about a problem that has been re-sent, use the SEND_CUSTOM_HOST_NOTIFICATION or SEND_CUSTOM_SVC_NOTIFICATION command. These commands take host names or host and service names, additional options, author name, and comments that should be added to the notification.
The additional options allow us to specify if the notification should also include all escalation levels (a value of 1), if Nagios should skip time periods for specific users (a value of 2), and if Nagios should increment notifications counters (a value of 4). Options are stored bitwise, so a value of 7 (1 + 2 + 4) would enable all of these options. The notification including escalations would be sent to all. It will be forced and the escalation counters will be increased. The option value of 3 means that the notification should be broadcasted to all escalations as well, and the time periods should be skipped.
To send a custom notification, including escalations, about the main router to all users, send the following command to Nagios:
[1206096000] SEND_CUSTOM_HOST_NOTIFICATION;router1;3;jdoe;RESPOND ASAP
Using adaptive monitoring
Nagios provides a very powerful feature named adaptive monitoring that allows the modification of various check-related parameters on the fly. This is done by sending a command to the Nagios external command pipe.
The first thing that can be changed on the fly is the command to be executed by Nagios, along with the attributes that will be passed to it—an equivalent of the check_command directive in the object definition. In order to do that, we can use the CHANGE_HOST_CHECK_COMMANDor CHANGE_SVC_CHECK_COMMAND command. These require the hostname or the hostname and service description, and the check command as arguments.
This can be used to change how hosts or services are checked, or to only modify parameters that are passed to the check commands; for example, a check for ping latency can be modified based on whether a primary or a backup connection is used. An example to change a check command of a service, which changes the command and its specified parameters, is as follows:
[1206096000] CHANGE_SVC_CHECK_COMMAND;linux1;PING;check_ping!500.0,50%
A similar possibility is to change the custom variables that are used later in a check command. An example where the following command and service are used is as follows:
define command
{
command_name check-ping
command_line $USER1$/check_ping –H $HOSTADDRESS$ -p $_SERVICEPACKETS$
-w $_SERVICEWARNING$ –c $_SERVICECRITICAL$
}
define service
{
host_name linux2
service_description PING
use ping
check_command check-ping
_PACKETS 5
_WARNING 100.0,40%
_CRITICAL 300.0,60%
}
This example is very similar to the one we saw earlier. The main benefit is that parameters can be set independently; for example, one event handler might modify the number of packets to send, while another can modify the warning and/or critical state limits.
The following is an example to modify the warning level for the ping service on a linux1 host:
[1206096000] CHANGE_CUSTOM_SVC_VAR;linux1;PING;_WARNING;500.0,50%
It is also possible to modify event handlers on the fly. This can be used to enable or disable scripts that try to resolve a problem. To do this, you need to use the CHANGE_HOST_EVENT_HANDLER and CHANGE_SVC_EVENT_HANDLER commands.
In order to set an event handler command for the Apache2 service mentioned previously in this section, send the following command:
[1206096000] CHANGE_SVC_EVENT_HANDLER;localhost;webserver;restart-apache2
Please note that setting an empty event handler disables any previous event handlers for this host or service. The same comment also applies when modifying the check command definition. In case you are modifying commands or event handlers, please make sure that the corresponding command definitions actually exist; otherwise, Nagios might reject your modifications.
Another feature that you can use to fine-tune the execution of checks is the ability to modify the time period during which a check should be performed. This is done with the CHANGE_HOST_CHECK_TIMEPERIOD and CHANGE_SVC_CHECK_TIMEPERIOD commands. Similar to the previous commands, these accept the hostname or the host and service names, and the new time period to be set. Consider the following example:
[1206096000] CHANGE_SVC_CHECK_TIMEPERIOD;localhost;webserver;workinghours
As is the case with command names, you need to make sure that the time period you are requesting to be set exists in the Nagios configuration. Otherwise, Nagios will ignore this command and leave out the current check time period.
Nagios also allows modifying intervals between checks—both for the normal checks, and retrying during soft states. This is done through the CHANGE_NORMAL_HOST_CHECK_, CHANGE_RETRY_HOST_CHECK_INTERVAL, CHANGE_NORMAL_SVC_CHECK_INTERVAL, andCHANGE_RETRY_SVC_CHECK_INTERVAL commands. All of these commands require passing the hostname or the host and service names, as well as the intervals that should be set.
A typical example of when intervals are modified on the fly is when the priority of a host or service relies on other parameters in your network. An example might be a failover server that will only be run if the primary server is down.
It is very important to make sure that the host and all of the services on it are working properly before actually performing scheduled backups. During idle time, its priority might be much lower. Another issue might be that monitoring the failover server should be performed more often in case the primary server fails.
An example to modify the normal interval for a host to every 15 minutes is as follows:
[1206096000] CHANGE_NORMAL_HOST_CHECK_INTERVAL;backupserver;15
There is also the possibility to modify how many checks need to be performed before a state is considered to be hard. The commands for this are CHANGE_MAX_HOST_CHECK_ATTEMPTS and CHANGE_MAX_SVC_CHECK_ATTEMPTS.
The following is an example command to set the maximum retries for a host to 5:
[1206096000] CHANGE_MAX_HOST_CHECK_ATTEMPTS;linux1;5
There are many more commands that allow the fine-tuning of monitoring and check settings on the fly. It is recommended that you get acquainted with all of the external commands that your version of Nagios supports, as mentioned in the section introducing the external commands pipe.
Summary
In this chapter, we have learned how to use the notification mechanism more effectively by sending information about the host and service status using multiple protocols such as SMS or instant messaging. This can be used to reduce the number of e-mails sent and reduce the chances of failure information getting caught by spam or e-mail filters.
We have also learned about escalations, and how those can be used automatically to inform additional people when a problem has not been resolved in a timely manner. This can be especially important in large organizations or when there is no clear ownership of one or more resources.
The chapter also covered sending commands to Nagios and how that can be used to add information about hosts and services, scheduling checks, and changing custom variables.
We have also learned how to create event handlers and how those can be used automatically to attempt to restart a service and/or change notification settings.
The chapter also covered adaptive notifications and how events or external applications can fine-tune the check settings for hosts and services.
The next chapter will cover passive checks and Nagios Service Check Acceptor (NSCA). These can be used to notify Nagios about the host and service status from external applications or other Nagios instances, including sending the information across networks.
All materials on the site are licensed Creative Commons Attribution-Sharealike 3.0 Unported CC BY-SA 3.0 & GNU Free Documentation License (GFDL)
If you are the copyright holder of any material contained on our site and intend to remove it, please contact our site administrator for approval.
© 2016-2026 All site design rights belong to S.Y.A.